Market Overview
| Study Period | 2020 - 2031 |
|---|---|
| Forecast Data Period | 2026 - 2031 |
| Historical Data Period | 2020 - 2024 |
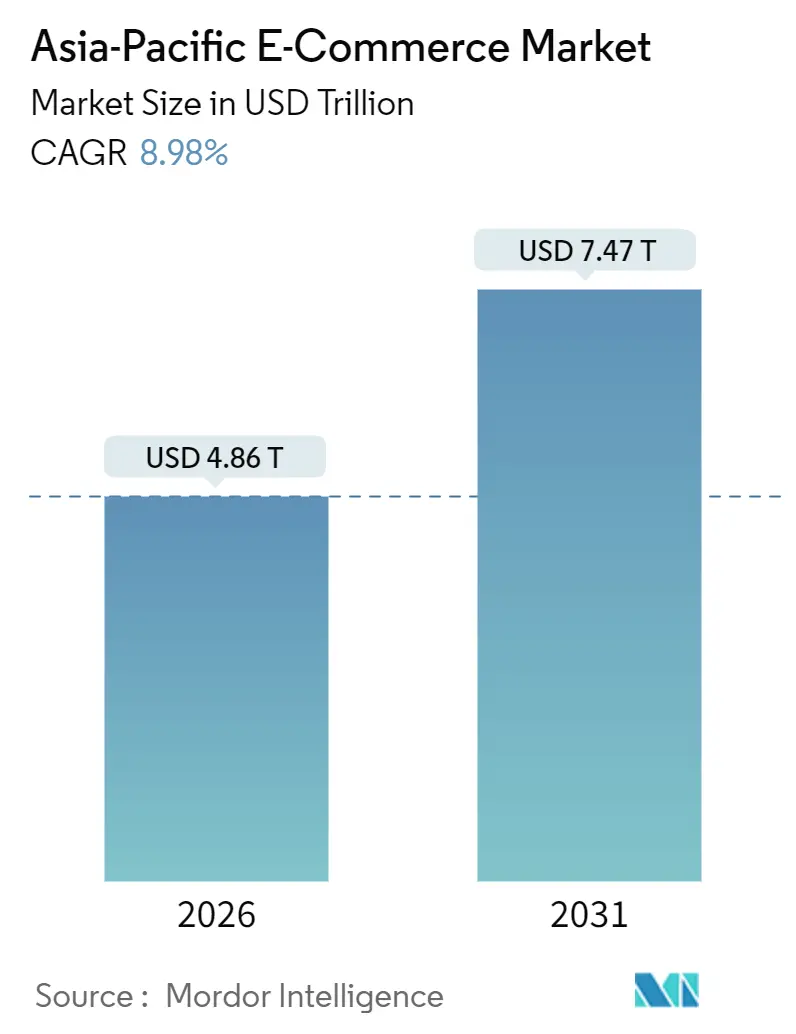
| Market Size (2026) | USD 4.86 Trillion |
| Market Size (2031) | USD 7.47 Trillion |
| Growth Rate (2026 - 2031) | 8.98% CAGR |
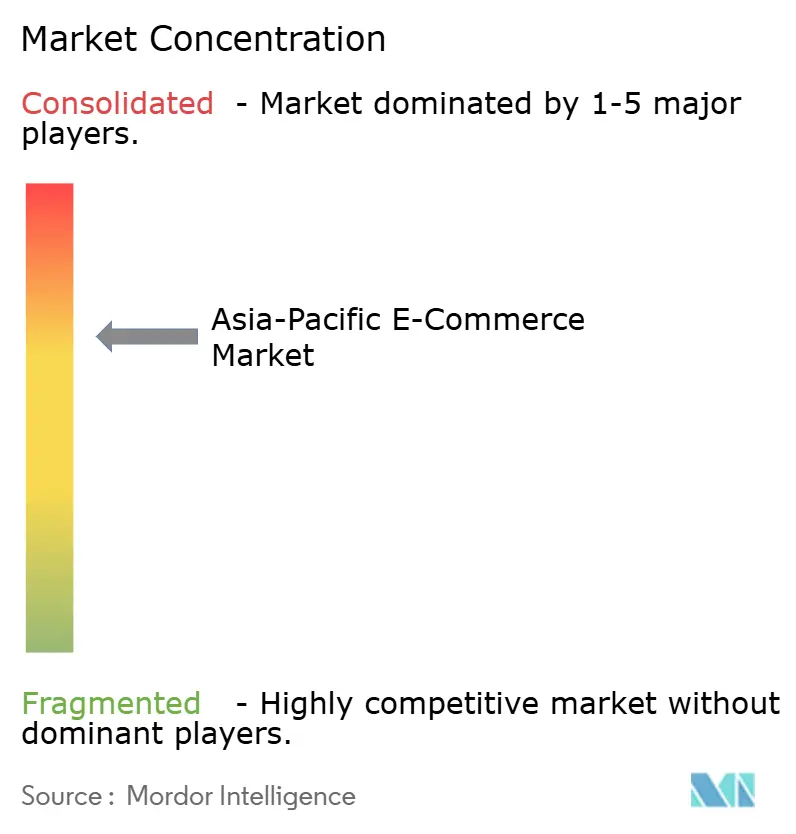
| Market Concentration | Medium |
Major Players *Disclaimer: Major Players sorted in no particular order Image © Mordor Intelligence. Reuse requires attribution under CC BY 4.0. | |
Asia-Pacific E-commerce Market Analysis by Mordor Intelligence
The Asia-Pacific E-commerce Market size is valued at USD 4.86 trillion in 2026 and is projected to climb to USD 7.47 trillion by 2031, advancing at an 8.98% CAGR. Rising smartphone ownership, the ubiquity of digital wallets, and cross-border trade accords are steering a structural shift in shopping behavior. Hyper-local fulfillment hubs, super-app ecosystems, and live-stream shopping are compressing delivery times, deepening engagement, and enlarging the active buyer base. Direct-from-China exporters such as Temu and Shein are capitalizing on higher de minimis thresholds to penetrate Australia, Japan, and South Korea, intensifying price competition. At the same time, environmental compliance spending, especially on electric delivery fleets, signals that sustainability investments are becoming table stakes rather than a differentiator for market leaders.
Key Report Takeaways
- By business model, the B2C segment held 78.34% of the Asia-Pacific E-commerce Market share in 2025, while the B2B segment is expanding at a 9.67% CAGR through 2031.
- By device type, smartphones accounted for 64.23% of the Asia-Pacific E-commerce Market size in 2025 and are set to grow at a 9.03% CAGR to 2031.
- By payment method, digital wallets captured 47.36% of transaction value in 2025, whereas BNPL is advancing at a 14.21% CAGR through 2031.
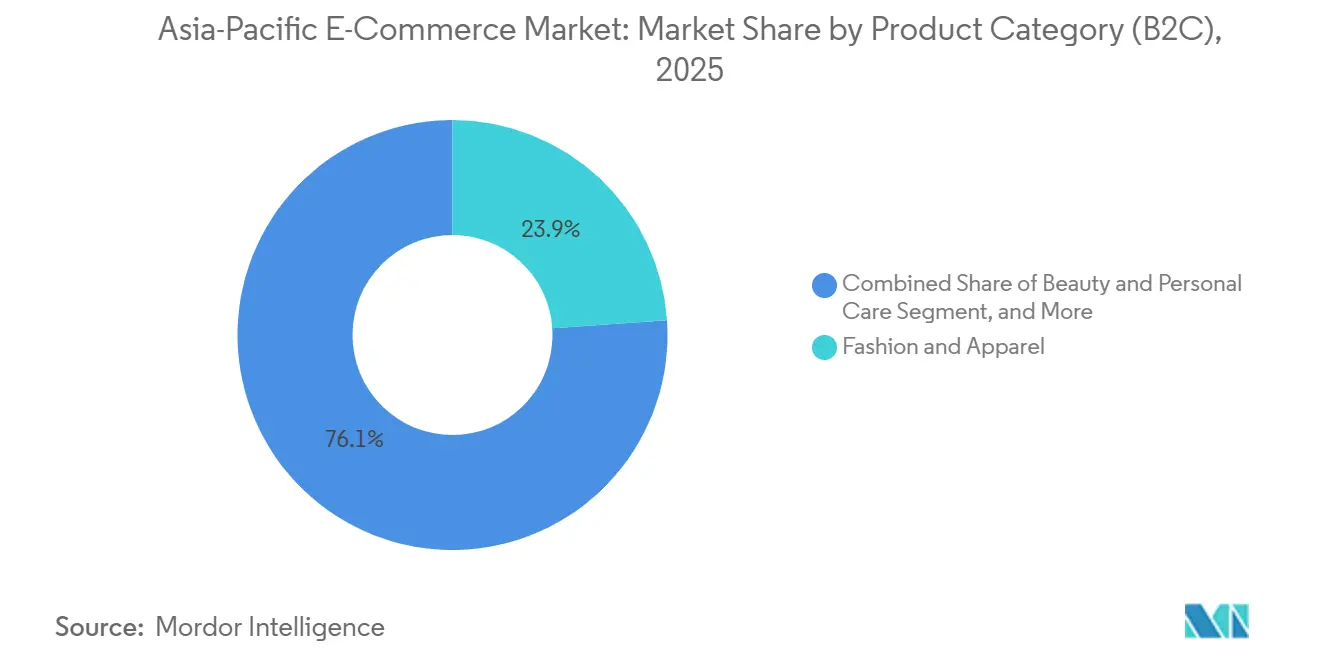
- By product category, fashion led with 23.91% revenue share in 2025, but beauty is forecast to post a 10.13% CAGR to 2031.
- By geography, China retained 28.7% of regional sales in 2025, while the Philippines is on course for the swiftest expansion at a 16.7% CAGR between 2026 and 2031.
Note: Market size and forecast figures in this report are generated using Mordor Intelligence’s proprietary estimation framework, updated with the latest available data and insights as of January 2026.
Asia-Pacific E-commerce Market Trends and Insights
Drivers Impact Analysis*
| Driver | (~) % Impact on CAGR Forecast | Geographic Relevance | Impact Timeline |
|---|---|---|---|
| AI-Driven Hyper-Local Fulfilment Hubs | +1.8% | China, India, South Korea, urban Southeast Asia | Medium term (2-4 years) |
| Social-Commerce and Live-Stream Shopping Boom | +1.5% | China, South Korea, Southeast Asia, emerging India | Short term (≤ 2 years) |
| Government-Led Cross-Border E-commerce Pacts | +1.3% | APEC members, ASEAN, RCEP signatories | Long term (≥ 4 years) |
| Rapid Adoption of M-Commerce and Super-Apps | +1.2% | Southeast Asia, India, tier-2 and tier-3 China | Medium term (2-4 years) |
| Extensive Internet Accessibility | +1.0% | India, Indonesia, Vietnam, Philippines, rural China | Long term (≥ 4 years) |
| Growing Disposable Income of Consumers | +0.9% | India, Vietnam, Indonesia, tier-2 China | Long term (≥ 4 years) |
| Source: Mordor Intelligence | |||
AI-Driven Hyper-Local Fulfilment Hubs
Machine-learning systems are predicting demand at the postal-code level, enabling inventory to be staged inside micro-warehouses that sit within 5 kilometers of dense residential zones. JD.com operated more than 1,600 automated centers by 2025, achieving 30-minute delivery in Beijing and Shanghai.[1]JD.com Investor Relations, “Annual Report 2025,” jd.com The concept is transferring to India, where Flipkart’s partnership with kirana stores cut delivery expenses by 40% while preserving sub-60-minute windows. Shopee is rolling out similar dark-store networks in Jakarta and Manila to counter GrabMart’s grocery push. Capital intensity limits fast replication, giving well-funded incumbents a defensible moat and compressing cash-conversion cycles as faster turnover lets suppliers accept shorter payment terms.
Social-Commerce and Live-Stream Shopping Boom
Live-stream commerce generated CNY 2.5 trillion (USD 350 billion) in China during 2025, with Douyin securing 45% of the gross merchandise value. Southeast Asian platforms are mirroring the tactic: Shopee Live and Lazada Live host daily influencer shows that regularly triple conversion rates compared with standard listings. Augmented-reality try-ons allow shoppers to visualize makeup shades or apparel fits in real time, narrowing the experiential gap with brick-and-mortar outlets. China’s regulator now holds influencers jointly liable for product misrepresentation, elevating compliance thresholds but boosting consumer trust.[2] State Administration for Market Regulation, “Guidelines on Live-Stream Marketing,” samr.gov.cn
Government-Led Cross-Border E-commerce Pacts
The Regional Comprehensive Economic Partnership removed tariffs on 90% of goods among 15 economies by 2025, shrinking shipping friction across China, Japan, South Korea, Australia, New Zealand, and ASEAN.[3]ASEAN, “RCEP Implementation Update,” asean.org APEC’s 2024 framework standardized customs data and lifted the de minimis threshold to USD 150, cutting clearance to under 12 hours at major ports. These accords allow exporters to move parcels without local warehouses, lowering landed costs by up to 20% and challenging domestic retailers. India’s bilateral digital-trade pacts with Singapore and the UAE simplify cross-border B2B paperwork through mutual e-signature recognition.
Rapid Adoption of M-Commerce and Super-Apps
Super-apps such as Grab, Gojek, and Paytm integrate ride-hailing, food delivery, digital finance, and retail into a single interface that monopolizes mobile screen time. Grab counted more than 35 million monthly transacting users in 2025, with grocery service GrabMart accounting for 18% of gross value.[4]Grab Investor Relations, “Form 20-F 2025,” investors.grab.com India’s Unified Payments Interface logged 11.7 billion transactions in December 2025, nudging Flipkart and Amazon India to default to UPI at checkout. The super-app blueprint is less dominant in Japan and South Korea, where consumers prefer stand-alone apps, suggesting that ecosystem consolidation thrives where digital service maturity is lower and switching costs are higher.
Restraints Impact Analysis*
| Restraint | (~) % Impact on CAGR Forecast | Geographic Relevance | Impact Timeline |
|---|---|---|---|
| Fragmented Last-Mile Logistics | -1.2% | Indonesia, Philippines, rural India, island economies | Medium term (2-4 years) |
| Rising ESG-Compliance Platform Costs | -0.9% | Australia, Japan, South Korea, urban China | Long term (≥ 4 years) |
| Cross-border Tax Complexity | -0.7% | ASEAN, India-Australia, Japan-China corridors | Medium term (2-4 years) |
| Security and Privacy Concerns | -0.6% | Global, heightened in Australia, Japan, South Korea | Short term (≤ 2 years) |
| Source: Mordor Intelligence | |||
Fragmented Last-Mile Logistics
Fragmented last-mile logistics result in inconsistent couriers and sparse cold-chain facilities. Tokopedia disclosed that 22% of orders in eastern Indonesia were delayed beyond five days during 2025, denting repeat-purchase rates.[5]Tokopedia, “Eastern Indonesia Logistics Study 2025,” tokopedia.com India’s tier-2 and tier-3 cities face parallel hurdles of non-standard addresses and manual handoffs between national and local carriers. Crowd-sourced gig networks offer flexibility but create liability and quality risks, while Australia’s 2024 ruling that riders are employees raises labor costs.
Rising ESG-Compliance Platform Costs
Governments and investors are pushing platforms to decarbonize fleets, use recyclable packaging, and disclose labor practices. Coupang earmarked USD 500 million to electrify its South Korean delivery fleet by 2027, a move estimated to lift operating expenses by 8%. Australia mandates that 70% of packaging be recyclable or compostable by 2025, forcing redesigns that inflate material costs. Alibaba pledges to power 100% of its cloud infrastructure with renewables by 2030, highlighting that green spending is migrating from optional to obligatory.
*Our forecasts treat driver/restraint impacts as directional, not additive. The impact forecasts reflect baseline growth, mix effects, and variable interactions.
Segment Analysis
By Business Model: Enterprises Accelerate Platform-to-Business Commerce
The B2C segment accounted for 78.34% of the Asia-Pacific E-commerce Market share in 2025, anchoring near-term revenue for most platforms. In contrast, the B2B segment is widening at a 9.67% CAGR through 2031 as enterprises digitize procurement and agriculture supply chains. Alibaba’s 1688.com handled CNY 1.2 trillion (USD 168 billion) in 2025 by pairing manufacturers with wholesalers through AI-enabled sourcing engines. Pinduoduo’s Duo Duo Wholesale aggregates demand from rural retailers, funneling factory-gate pricing to towns previously served by informal intermediaries. Higher repeat-purchase rates and lower customer-acquisition costs give B2B a margin profile that increasingly appeals to investors.
Cross-border B2B marketplaces processed USD 45 billion in export orders during 2025, illustrating how easier customs rules convert offline trade into digital flows. India’s government-backed ONDC B2B module, launched in 2025, removes marketplace commissions and threatens incumbent fee structures.[6]Ministry of Commerce and Industry, India, “ONDC Progress Update 2025,” commerce.gov.in JD.com’s enterprise unit now supplies MRO goods to factories, compressing sourcing cycles by 40% and capturing share from offline distributors. As a result, the Asia-Pacific E-commerce Market size attached to B2B is set to expand more quickly than consumer-facing volumes over the forecast horizon.


By Device Type (B2C): Mobile-First Architecture Commands Transaction Flow
Smartphones generated 64.23% of transaction value in 2025, giving them the dominant slice of the Asia-Pacific E-commerce Market size for device categories. Affordable 5G handsets priced below USD 150 in India and Vietnam are enlarging the total addressable base. Platforms now build progressive web apps that cache catalog data for low-bandwidth zones and use biometric authentication for one-click payments. Voice-assistant commerce remains niche but is growing in Japan and South Korea, where households reorder staples through speakers paired with local marketplaces.
Mobile’s primacy is reshaping user-interface design: vertical scrolling, large tap targets, and image-first layouts replace desktop carousels. Social-commerce integration lets buyers move from discovery on TikTok or Instagram to checkout inside a super-app without app-hopping. Payment tokenization and device-based authentication reduce fraud and raise trust among older demographics.[7]Visa, “Device-Based Authentication in E-commerce,” visa.com Consequently, desktop and laptop shares will keep receding, locking mobile in as the innovation frontier for the Asia-Pacific E-commerce Market.
By Payment Method (B2C): BNPL Adds Flexibility to Digital-Wallet Dominance
Digital wallets captured 47.36% of B2C payment value in 2025, reinforcing their position as the default tender across most platforms. Buy Now Pay Later usage, however, is racing ahead at a 14.21% CAGR to 2031 as younger shoppers favor installment flexibility. Afterpay, Zip, and Atome partnered with more than 15,000 merchants by 2025 and underwrite risk with alternative data such as mobile usage patterns. Australia’s Treasury now mandates credit checks for BNPL tickets above AUD 2,000 (USD 1,340), tightening oversight.[8]Australian Treasury, “BNPL Regulatory Framework 2024,” treasury.gov.au
Wallet operators are responding by embedding BNPL directly inside their apps, turning credit into a feature rather than a stand-alone product. India’s UPI AutoPay allows subscription-based purchases on Flipkart without manual approval, cutting payment failure rates. Singapore’s MAS caps BNPL tenures at 12 months, aligning the segment with conventional credit rules. These shifts point toward an integrated checkout stack in which the Asia-Pacific E-commerce Market share of standalone BNPL apps declines even as installment options proliferate.
By Product Category (B2C): Beauty Surges Ahead of Fashion
Fashion and apparel led product sales with 23.91% revenue share in 2025, yet beauty and personal care is projected to outgrow all categories at a 10.13% CAGR through 2031. Chinese consumers increasingly order Japanese skincare via Tmall Global, while Southeast Asian shoppers import Korean cosmetics on Shopee. Subscription boxes achieved a 35% repeat-purchase rate in 2025, creating predictable revenue streams that offset acquisition costs. Consumer-electronics demand remains buoyant thanks to steady smartphone upgrade cycles, whereas furniture platforms battle high return costs that pressure margins.
Platforms are crossing category boundaries: fashion players launch private-label cosmetics, and beauty retailers add apparel accessories to raise basket sizes. Regulatory tightening, such as China’s stricter ingredient-disclosure rules for imported cosmetics in 2024, raises entry barriers for small brands but strengthens consumer confidence in established labels. Quick-commerce services are also carving share in food and beverage by guaranteeing 15-minute delivery in dense urban cores. Altogether, beauty’s momentum signals a durable shift in spending mix inside the Asia-Pacific E-commerce Market.

Geography Analysis
China held 28.7% of Asia-Pacific E-commerce Market share in 2025. The country’s dominance rests on Alibaba’s integrated marketplace, JD.com’s high-speed logistics grid, and Pinduoduo’s rural outreach. Urban growth is slowing as penetration in tier-1 cities matures, so platforms are redirecting capital toward tier-2 and tier-3 hubs where disposable incomes are climbing. This inland focus keeps absolute Asia-Pacific E-commerce Market size gains high even as national growth rates moderate.
India remains the largest incremental contributor after China, powered by quick-commerce startups that promise grocery delivery under 10 minutes and the government-backed ONDC network that lowers merchant fees. Japan registers modest expansion because dense offline retail still draws foot traffic, yet yen depreciation fuels cross-border luxury imports from Chinese sellers. South Korea’s landscape is led by Coupang and Naver, which are pairing live-stream shows with same-day delivery to defend against low-cost entrants. Australia and New Zealand show mature penetration, but rising data-compliance costs and sustainability mandates are nibbling at margins.
Southeast Asia delivers the fastest regional uplift, helped by youthful demographics, mobile-first habits, and super-app ubiquity. Within the bloc, the Philippines is set for the quickest climb, with e-commerce sales forecast to rise at a 16.7% CAGR from 2026 to 2031 as logistics investments unlock demand islands. Indonesia, Vietnam, and Thailand are also expanding briskly as Shopee and Lazada subsidize shipping and cashback to attract first-time buyers. Cross-border frameworks such as RCEP and APEC’s de minimis thresholds let Chinese exporters ship directly to ASEAN consumers, eroding price gaps with local retailers. Telecom-led mobile wallets in Pakistan, Bangladesh, and Sri Lanka are narrowing payment frictions, hinting that today’s tail markets could join the growth league later in the decade.
Competitive Landscape
The Asia-Pacific E-commerce Market shows moderate concentration: the top five platforms captured roughly 55% of regional gross merchandise value in 2025, leaving meaningful share for local specialists. Strategic focus centers on vertical integration. Alibaba expanded Cainiao’s automated hubs, JD.com patented 127 autonomous-delivery innovations, and Amazon India poured USD 250 million into 10-minute grocery fulfillment. Quick-commerce insurgents like Zepto in India and community-group-buy outfits in China are exploiting micro-warehouse models to leapfrog legacy supply chains.
Cross-border entrants Temu and Shein leverage China’s manufacturing heft and higher de minimis thresholds to undercut domestic rivals, forcing incumbents to defend on delivery speed rather than price. Regulatory interventions are creating divergent playing fields: Australia’s data-right law promotes interoperability, India’s ONDC erodes commission moats, and China’s antitrust oversight curtails exclusive merchant deals. Sustainability is the next contest domain, with Coupang’s USD 500 million EV pledge and Alibaba’s renewable-energy targets illustrating that green differentiation is quickly commoditizing. In sum, technology depth, logistics scale, and regulatory agility define durable advantage in the Asia-Pacific E-commerce Market.
Asia-Pacific E-commerce Industry Leaders
Alibaba Group Holding Ltd.
Amazon.com Inc.
JD.com Inc.
Rakuten Group Inc.
Sea Ltd. (Shopee)
- *Disclaimer: Major Players sorted in no particular order

Recent Industry Developments
- January 2026: Alibaba Group committed USD 2 billion to extend its Cainiao network with 50 automated sorting centers across Indonesia, Vietnam, and Thailand, targeting next-day cross-border delivery.
- December 2025: Sea Limited’s Shopee embedded live-stream commerce inside TikTok videos, sharing revenue with influencers to court Gen Z shoppers.
- November 2025: JD.com acquired a 30% stake in Vietnam’s Tiki for USD 300 million, securing exposure to 10 million active users and local logistics know-how.
- October 2025: Flipkart and NPCI enabled UPI AutoPay for subscriptions, aiming to lift repeat-purchase frequencies by one-quarter.
- September 2025: Coupang allocated USD 500 million to electrify its fleet by 2027, forecasting a 40% carbon-emission cut.


Research Methodology Framework and Report Scope
Market Definitions and Key Coverage
Our study defines the Asia-Pacific e-commerce market as every business-to-consumer, business-to-business, and consumer-to-consumer product or service transaction that is initiated over the public internet and settled through an electronic payment, regardless of fulfilment mode or device.
Scope Exclusions: Pure digital media downloads, ride-hailing fares, and enterprise EDI flows are not counted.
Segmentation Overview
- By Business Model
- B2C
- B2B
- By Device Type (B2C)
- Smartphone / Mobile
- Desktop and Laptop
- Other Device Types
- By Payment Method (B2C)
- Credit and Debit Cards
- Digital Wallets
- Buy Now Pay Later (BNPL)
- Other Payment Methods
- By Product Category (B2C)
- Beauty and Personal Care
- Consumer Electronics
- Fashion and Apparel
- Food and Beverages
- Furniture and Home
- Toys, DIY and Media
- Other Product Categories
- By Country
- China
- India
- Japan
- South Korea
- South East Asia
- Australia and New Zealand
- Rest of Asia-Pacific
Detailed Research Methodology and Data Validation
Primary Research
Mordor analysts interview marketplace category managers, third-party logistics executives, payment-gateway product heads, and SME exporters across China, India, Japan, South Korea, and the ASEAN corridor to validate secondary findings, plug data gaps, and refine elasticity assumptions.
Desk Research
We build the foundation with open datasets from agencies such as UNCTAD, the World Bank, GSMA, national statistics offices (for example, China's NBS and India's RBI digital-payment dashboard), and regional trade associations. Company filings, investor decks, and reputable business press gathered through Dow Jones Factiva and D&B Hoovers complement macro sources and give us merchant-level clues on average selling price (ASP) shifts.
Shipping manifests (Volza), patent filings queried on Questel, and customs duty receipts help us cross-check cross-border volumes, while academic journals clarify consumer behavior pivots after policy moves such as India's ONDC rollout. The list above is illustrative rather than exhaustive.
Market-Sizing & Forecasting
A top-down construct starts with official retail sales and digital-payment penetration, which are then adjusted for online share, basket value, and return rates. Supplier roll-ups of leading platforms' GMV and sampled ASP × parcel counts serve as bottom-up checks that fine-tune totals. Key variables tracked include smartphone penetration, digital-wallet share at checkout, parcel volume per capita, discretionary-spend elasticity, and average cross-border duty per order.
We project the market with a multivariate regression blended with scenario analysis, anchoring coefficients on historical correlations and forward opinions gathered in primary calls. Where platform data are partial, interpolation is guided by regional parcel scans and currency-adjusted ASP trends.
Data Validation & Update Cycle
Outputs pass multi-step peer review, variance thresholds, and anomaly flags before sign-off. Reports refresh annually, and we trigger interim updates when material policy, FX, or supply-chain shocks emerge. A last-mile analyst sweep ensures clients always receive the latest view.
Why Mordor's APAC E-Commerce Baseline Commands Reliability
Published estimates often diverge because firms choose different scopes, currencies, and refresh rhythms.
Key gap drivers include whether services like digital media are added, if B2B flows are omitted, the currency conversion date, and the cadence at which models absorb new GMV disclosures. Mordor's disciplined variable selection, annual refresh, and dual-path validation keep our figure centered and transparent.
Benchmark comparison
| Market Size | Anonymized source | Primary gap driver |
|---|---|---|
| USD 4.44 trillion (2025) | Mordor Intelligence | |
| USD 10.70 trillion (2024) | Global Consultancy A | Bundles digital media, travel, and ticketing; limited merchant verification |
| USD 2.90 trillion (2024) | Regional Consultancy B | Counts B2C GMV only, excluding B2B and recommerce flows |
| USD 2.98 trillion (2022) | Trade Journal C | Relies on pre-pandemic baseline and outdated FX rates; refresh every three years |
Differences show that scope breadth and data freshness, rather than complex math, explain most spread. By aligning inputs to clear transaction tests and refreshing yearly, Mordor Intelligence delivers a balanced, decision-ready baseline that clients can trace and replicate.


Key Questions Answered in the Report
How large is the Asia-Pacific E-commerce Market in 2026?
The market is valued at USD 4.86 trillion in 2026 and is expected to reach USD 7.47 trillion by 2031.
Which device type drives most e-commerce sales in Asia-Pacific?
Smartphones generated 64.23% of transaction value in 2025, reflecting the region's mobile-first architecture.
What is the fastest-growing payment option across Asia-Pacific platforms?
Buy Now Pay Later solutions are growing at a 14.21% CAGR through 2031, overtaking other alternatives among younger shoppers.
Which product category is projected to outpace others through 2031?
Beauty and personal care is forecast to expand at a 10.13% CAGR, surpassing fashion's growth rate.
How are cross-border trade agreements influencing e-commerce?
RCEP and APEC frameworks are lowering tariffs and customs friction, letting Chinese exporters ship directly to consumers across the region with lower landed costs.
What sustainability commitments have leading platforms made?
Coupang plans to electrify its fleet with a USD 500 million investment by 2027, while Alibaba targets 100% renewable energy for its cloud operations by 2030.
Page last updated on:


