
Market Overview
| Study Period | 2020 - 2031 |
|---|---|
| Forecast Data Period | 2026 - 2031 |
| Historical Data Period | 2020 - 2024 |
| Market Size (2026) | USD 3.63 Billion |
| Market Size (2031) | USD 5.07 Billion |
| Growth Rate (2026 - 2031) | 6.88 % |
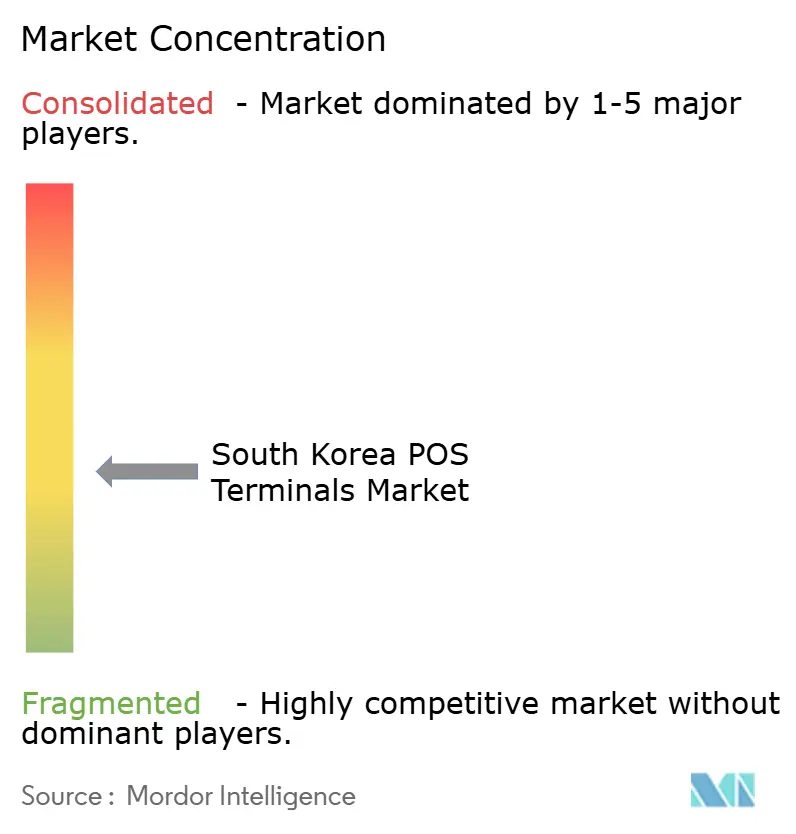
| Market Concentration | Medium |
Major Players *Disclaimer: Major Players sorted in no particular order Image © Mordor Intelligence. Reuse requires attribution under CC BY 4.0. | |
South Korea POS Terminals Market Analysis by Mordor Intelligence
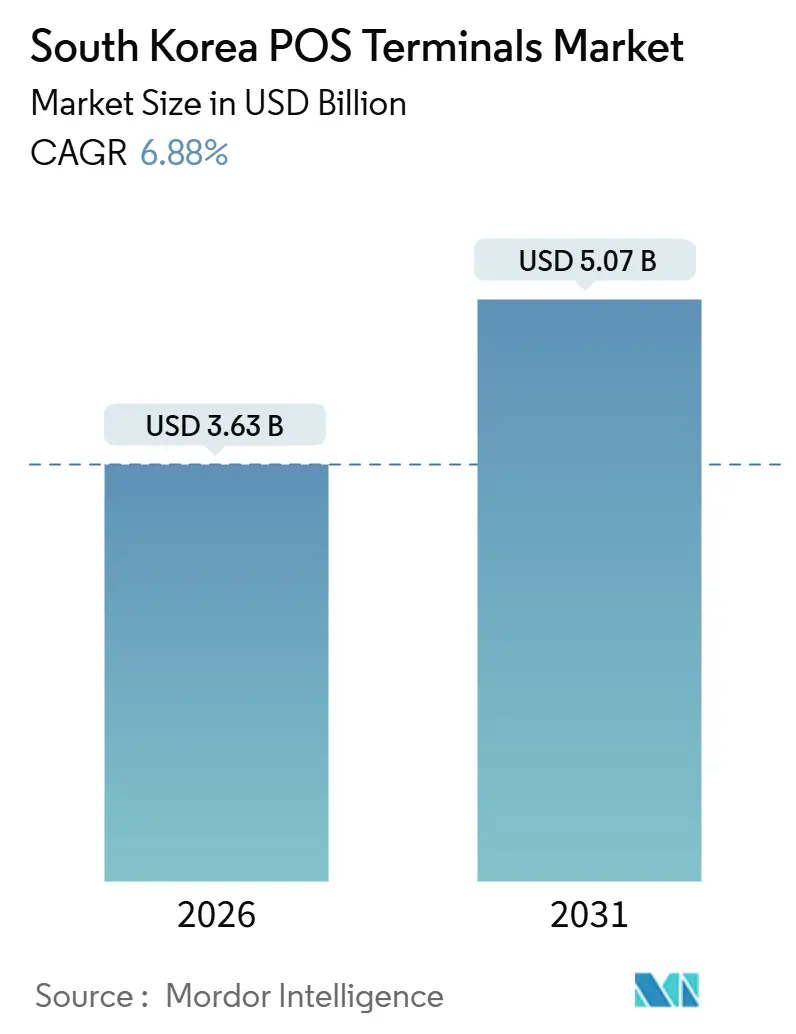
The South Korea POS terminals market size reached USD 3.63 billion in 2026 and is projected to hit USD 5.07 billion by 2031, reflecting a 6.88% CAGR over the forecast period. This expansion stems from a decisive pivot away from cash toward contactless cards, QR codes, and mobile wallets, all reinforced by government cashless mandates, a resurging tourism sector, and retailer investments in smart checkout systems. Rapid replacement of aging countertop devices in convenience and department stores aligns with first-time deployments in healthcare, logistics, and duty-free corridors, giving the South Korea POS terminals market several concurrent growth engines. Intensifying price competition among domestic integrators and global vendors, rising NFC penetration, and the growing appeal of cloud-based analytics further bolster transaction volumes and software revenue. Even so, cybersecurity breaches and semiconductor supply disruptions have periodically delayed rollouts, underscoring the importance of scale economies in hardware procurement and software development.
Key Report Takeaways
- By mode of payment acceptance, contact-based terminals led with 70.62% of the South Korea POS terminals market share in 2025, while contactless systems are forecast to grow at a 7.54% CAGR through 2031.
- By POS type, fixed devices held 55.34% share of the South Korea POS terminals market size in 2025, whereas mobile and portable terminals are on track for a 7.67% CAGR to 2031.
- By component, hardware accounted for 62.71% of revenue in 2025; software is poised to expand at a 7.84% CAGR, the fastest rate among components.
- By deployment mode, on-premise systems captured 61.86% share in 2025, but cloud solutions are advancing at a 7.48% CAGR as retailers adopt subscription pricing and real-time data sync.
- By end-user industry, retail commanded 35.58% share in 2025, while healthcare terminals are set to register an 8.12% CAGR, the highest among all verticals.
Note: Market size and forecast figures in this report are generated using Mordor Intelligence’s proprietary estimation framework, updated with the latest available data and insights as of January 2026.
South Korea POS Terminals Market Trends and Insights
Drivers Impact Analysis*
| Driver | (~) % Impact on CAGR Forecast | Geographic Relevance | Impact Timeline |
|---|---|---|---|
| Surge in Smart POS Installations Across Large Retail Chains | +1.8% | National, concentrated in Seoul, Busan, Incheon metro areas | Medium term (2–4 years) |
| Rapid Adoption of Contactless and Mobile Wallet Payments | +1.5% | National, with early gains in urban centers and tourism corridors | Short term (≤ 2 years) |
| Government Push Toward a Cashless Economy (Zero-Pay Roll-out) | +1.2% | National, strongest in SME-dense districts | Medium term (2–4 years) |
| Expansion of E-commerce-Driven Omni-Channel Fulfilment | +1.0% | National, led by Seoul Capital Area and major logistics hubs | Medium term (2–4 years) |
| Tourism Boom Fueling Duty-Free and Hospitality POS Upgrades | +0.9% | Incheon, Seoul, Jeju Island, Busan port areas | Short term (≤ 2 years) |
| AI-Enabled Upselling and Inventory Analytics at the POS | +0.5% | National, early adoption in large retail and convenience chains | Long term (≥ 4 years) |
| Source: Mordor Intelligence | |||
Surge in Smart POS Installations Across Large Retail Chains
Major chains are rolling out Android-based smart devices that fuse payment, loyalty, and inventory lookup on a single terminal, shrinking queues and lowering labor costs. Shinsegae I and C reported KRW 625.7 billion (USD 434 million) in 2024 revenue after coupling cloud POS with AI self-checkout across its stores.[1] GS Retail migrated roughly 18,000 franchise outlets to SAP S/4HANA Cloud, cutting profit-and-loss report generation from 40 minutes to 40 seconds. National retail sales climbed to KRW 179.1 trillion (USD 124.6 billion) in 2024, fueling terminal refresh cycles. The upside is balanced by integration hurdles when legacy back-office systems cannot parse GS1 Application Identifiers for variable-weight produce.[2]
Rapid Adoption of Contactless and Mobile Wallet Payments
Samsung Pay, Kakao Pay, Naver Pay, and Toss now dominate urban point-of-sale environments, and Apple Pay’s 2025 expansion with Shinhan and KB Kookmin Cards showcased pent-up NFC demand. Yet only about 10% of stores possessed compliant readers by March 2025, with each upgrade costing roughly KRW 200,000 (USD 138). Eight card issuers adopted an EMVCo-aligned QR standard in June 2024, easing hardware constraints. Meanwhile, Bank of Korea completed ISO 20022 migration for real-time settlement, shortening authorization cycles.
Government Push Toward a Cashless Economy (Zero Pay Roll-out)
Zero Pay charges zero merchant fees and is accepted at more than 2 million businesses, aiding SMEs and fueling QR adoption. The Financial Services Commission has earmarked USD 368 million for 2024-2027 fintech investments, reinforcing payment-infrastructure upgrades. MyData 2.0 widened data-sharing to offline channels in 2025 and lowered the minimum user age to 14, prompting merchants to install age-verification modules. Real-time payments hit 9.1 billion in 2023 and continue to scale, making compliance with QR and NFC standards mandatory for merchants.
Expansion of E-commerce-Driven Omni-Channel Fulfilment
Online channels captured 50.6% of total retail sales in 2024, up from 47.3% in 2023. Retailers now deploy POS networks that synchronize stock across stores, warehouses, and click-and-collect points, enabling same-day delivery. Shinsegae’s SSG.COM integrates its cloud POS with department stores and fulfillment centers, while e-invoicing rules requiring PKI signatures and 5-year data retention push vendors to embed compliance logic. These omni-channel demands support growth in software subscriptions even as supermarket foot traffic moderates.
Restraints Impact Analysis*
| Restraints | (~) % Impact on CAGR Forecast | Geographic Relevance | Impact Timeline |
|---|---|---|---|
| Persistent Data-Security and Cyber-Fraud Concerns | -0.9% | National, heightened in high-transaction-volume retail and financial sectors | Short term (≤ 2 years) |
| High Up-Front Hardware Costs for Small Merchants | -0.7% | National, most acute in rural and low-margin SME segments | Medium term (2–4 years) |
| Fragmented Rules on Digital Receipt Compliance | -0.4% | National, with municipal-level variation | Medium term (2–4 years) |
| Semiconductor Supply-Chain Volatility | -0.3% | National, with global supply dependencies | Short term (≤ 2 years) |
| Source: Mordor Intelligence | |||
Persistent Data-Security and Cyber-Fraud Concerns
The August 2025 Lotte Card breach leaked data on 2.97 million users, spotlighting vulnerabilities and triggering demand for PCI-PTS 6.x hardware encryption. SK Telecom’s USIM hack the same year forced regulators to tighten wallet oversight. Revised enforcement decrees now impose stricter capital and transaction ceilings on payment gateways. Budget-constrained merchants, however, often delay upgrades because secure processors add cost and integration complexity.
High Up-Front Hardware Costs for Small Merchants
An NFC-capable terminal still averages KRW 200,000 (USD 138), a hurdle for rural shops. NHN KCP introduced KCP Order in November 2025, leveraging QR codes or NFC stickers to cut monthly fixed costs by over 80% compared with kiosks. SoftPOS platforms promise similar savings but require lengthy EMV certifications.[3] With limited government subsidies, SMEs often keep magnetic-stripe readers, stalling Apple Pay growth and preserving a split between premium smart POS and basic card units.
*Our forecasts treat driver/restraint impacts as directional, not additive. The impact forecasts reflect baseline growth, mix effects, and variable interactions.
Segment Analysis
By Mode of Payment Acceptance: Contactless Momentum Builds Despite NFC Gaps
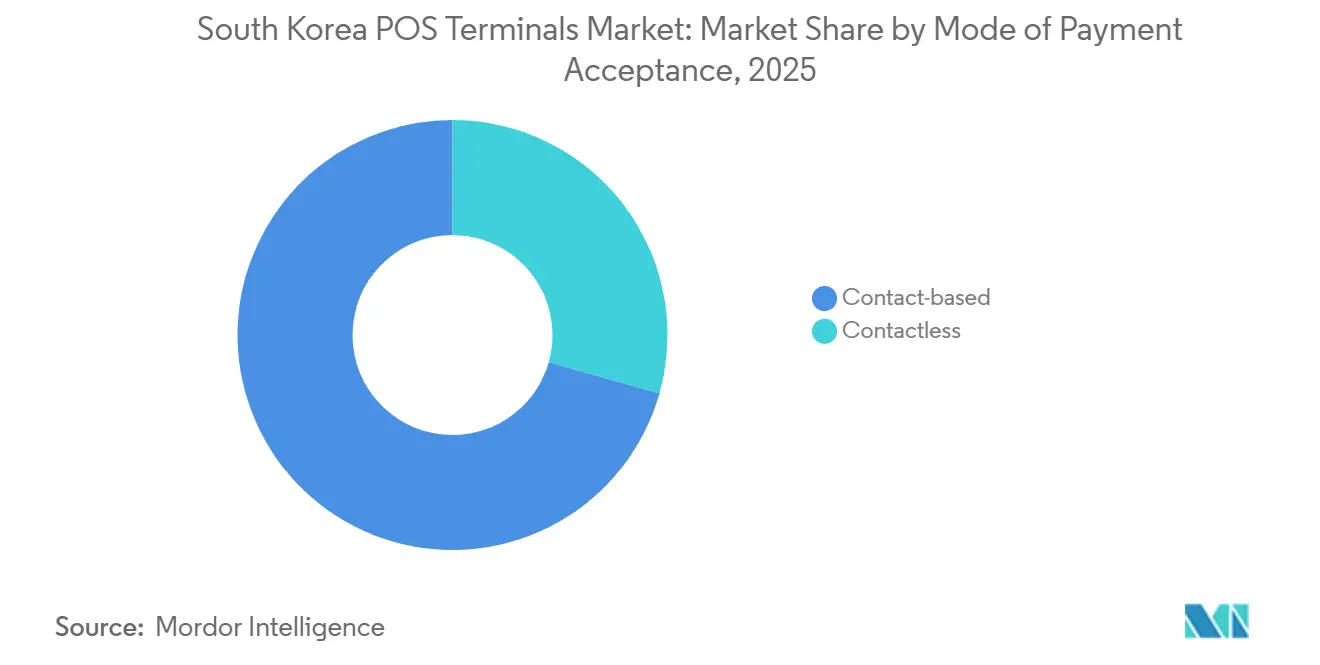
Contact-based devices held 70.62% share in 2025, mirroring the installed base across 2.9 million merchant locations. Yet contactless volumes are set for a 7.54% CAGR to 2031, pushing the South Korea POS terminals market toward wider NFC and QR coverage. Apple Pay’s wider issuer roster adds urgency for NFC upgrades, and the common QR standard cuts reliance on proprietary hardware. Ingenico’s AXIUM CX9000 and Verifone’s X990, both PCI-PTS 6.x certified, give retailers multi-interface platforms. With NFC modules priced above magnetic-stripe readers, Samsung Pay’s magnetic secure transmission preserves legacy acceptance, slowing convergence. Government cashless incentives and falling unit prices, however, will narrow the gap, making contactless acceptance mainstream before 2031. The South Korea POS terminals market size for contactless solutions is therefore poised to expand meaningfully, provided subsidy frameworks offset merchant upgrade expenses.
As EMVCo-aligned QR rolls out nationwide, retailers gain an immediate path to contactless payments without buying new readers. Bank of Korea’s ISO 20022 settlement rails give acquirers faster fund availability, improving merchant cash flow. Meanwhile, GS1 mandates on QR and DataMatrix codes for variable-weight goods oblige scanner upgrades, further encouraging retailers to adopt dual-mode terminals. Together, these factors accelerate the shift toward contactless, even as chip-and-PIN devices remain prominent through the forecast horizon.
By POS Type: Mobile Units Target Last-Mile and Queue-Bust Scenarios
Fixed systems controlled 55.34% share in 2025 thanks to countertop deployments in supermarkets and department stores. Mobile and portable devices are forecast to grow at 7.67% annually, winning last-mile delivery, curbside pickup, and in-aisle checkout use cases. Bluebird’s SP60-M and Point Mobile’s P8, each weighing under 300 grams, come with built-in printers and secure elements, making them attractive for couriers and field staff.
TSC’s 2024 purchase of Bluebird consolidated mobile POS, RFID, and tablets under one roof, signaling a strategic pivot toward portable devices. Yet high-throughput grocery lanes still require fixed units with cash drawers and dual monitors, a niche served by POSBANK’s MINT and EDGE 1560 models. Mobile devices dominate fast-moving hospitality and logistics, while fixed systems persist in large basket retail where peripheral integration matters.
By Component: Software Surges as AI and Cloud Analytics Scale
Hardware represented 62.71% revenue in 2025, but software is projected to rise at a 7.84% CAGR. SaaS suites such as Spharos POS let merchants deploy terminals, kiosks, and apps under a single subscription, interfacing with VANs like NICE and KSNET. Shinhan Card’s AI 5025 program, which targets 50% AI-driven consultations this year, embeds machine learning for real-time fraud alerts and personalized offers.
Subscription revenues improve margins because they avoid costly bill-of-materials outlays. In parallel, government plans to raise AI penetration in retail from below 3% to 30% within three years will push cloud analytics deeper into store operations. Even so, the South Korea POS terminals market size for hardware remains large because aging readers must still be replaced on a five-to-seven-year cycle, sustaining procurement volumes.
By Deployment Mode: Cloud Gains Ground but On-Premise Rules for Now
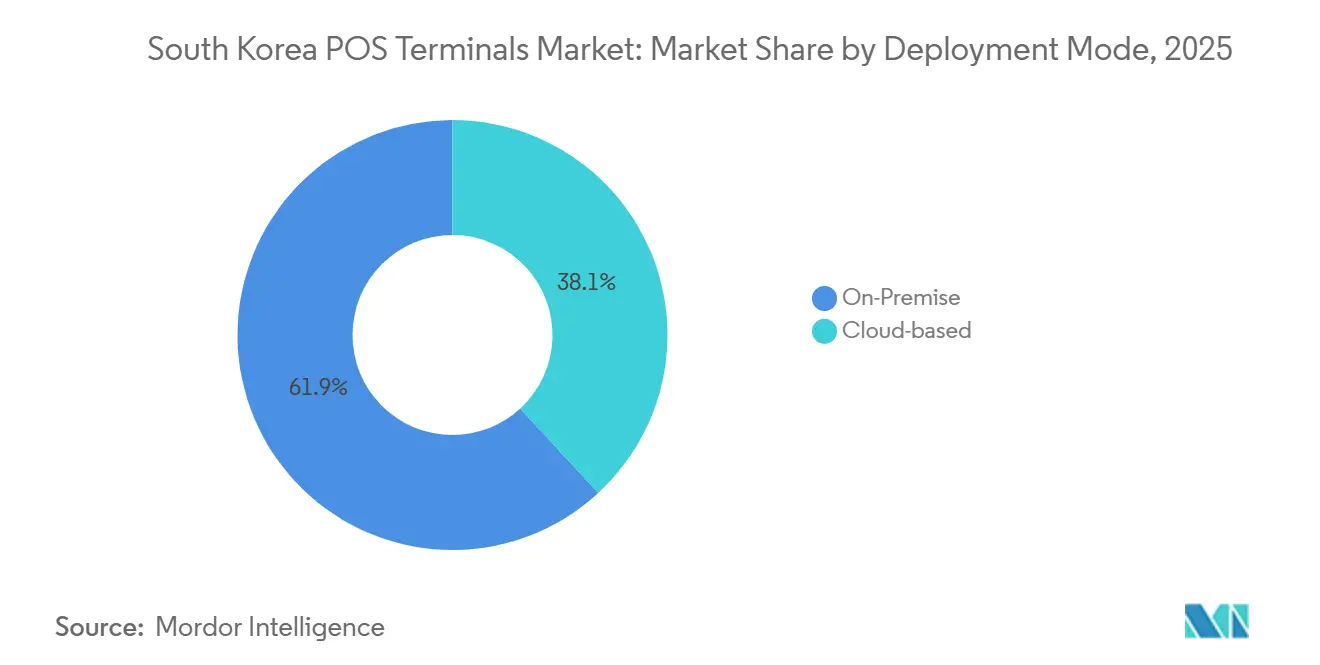
On-premise solutions held 61.86% share in 2025 as retailers valued data sovereignty and offline resilience. Cloud deployments, however, are growing at 7.48% annually, propelled by real-time sync and remote updates. NHN KCP’s KCP POS+ synchronizes sales across iOS, Android, and Windows endpoints, enabling tablet-based ordering without local servers.
Regulatory mandates influence the mix. The National Tax Service requires PKI signatures on e-invoices and 5-year archival, tasks simpler to automate in cloud systems. Conversely, the Electronic Financial Transactions Act enforces strict gateway capital rules, nudging some merchants to retain on-premise processing. Hybrid architectures combining local transaction capture with cloud analytics are emerging, but the trajectory remains firmly toward cloud as bandwidth costs fall.
By End-User Industry: Healthcare Outpaces While Retail Anchors Revenue
Retail maintained 35.58% share in 2025, buoyed by KRW 179.1 trillion (USD 124.6 billion) in store sales. Healthcare, the fastest-growing vertical, is expected to post an 8.12% CAGR through 2031 as hospitals digitize billing and insurance claims. Fujitsu’s biometric platform, co-developed with the Korea Financial Telecommunications and Clearings Institute, enables fingerprint and facial authentication for patient payments.
Tourism-driven hospitality segments deploy QR-ready terminals to process UnionPay, Alipay, and WeChat Pay, especially in Incheon Airport duty-free outlets. Logistics firms embed portable readers on delivery routes, and the government’s MyData 2.0 framework grants fintechs access to offline transaction data, encouraging cross-vertical integrations. The South Korea POS terminals market size within healthcare is set to expand as electronic medical records converge with secure, biometric-enabled payment devices.
Geography Analysis
South Korea POS terminals market adoption clusters around the Seoul Capital Area, Incheon, Busan, and Jeju. Seoul, housing flagship department stores and 18,000 GS25 outlets, drives early contactless uptake and anchors over one-third of total terminal shipments. Incheon International Airport, a gateway for more than 50 million annual travelers, catalyzes hospitality upgrades, including biometric checkout at Lotte Duty Free. Jeju Island matches Incheon in QR acceptance, owing to Chinese visitor spend that captured 62% of cross-border purchases in late 2024.
Busan’s port and growing logistics parks stimulate demand for mobile POS devices in delivery fleets, while Zero Pay’s zero-fee structure has boosted QR installations among SMEs outside metropolitan cores. The Financial Services Commission backs regional fintech hubs, channeling a share of its USD 368 million fund into non-Seoul innovation centers. Yet NFC penetration remains patchy; only about 10% of stores nationwide had compliant readers by March 2025, limiting Apple Pay usage until subsidy schemes expand.
Municipal variation in digital-receipt rules adds operational friction for chains, with some jurisdictions mandating additional fiscal printers. Bank of Korea’s ISO 20022 rails reduce interbank settlement times nationwide, but internet bandwidth still varies, influencing cloud adoption rates. Cloud migration projects such as GS Retail’s finance overhaul show how centralized data architecture can harmonize processes across 17 provinces, narrowing earlier capability gaps.
Regulatory Landscape
South Korea's POS terminal ecosystem is shaped by electronic payment and data-security obligations that affect both hardware refresh cycles and software design. The Financial Services Commission oversees electronic financial transactions, including information-security requirements for financial entities and payment intermediaries, while the Korea Internet and Security Agency (KISA) supports information-security standards and assessment functions under the Ministry of Science and ICT.
At the acceptance layer, terminals used for card payments rely on security certification practices supported by industry bodies such as the Credit Finance Association of Korea. This reinforces the shift toward IC cards and encrypted processing and sustains demand for newer secure terminal specifications after high-profile fraud and breach events. Separately, tax and record-keeping obligations, including PKI-signed e-invoicing with multi-year retention requirements, continue to affect POS software features and deployment choices (on-premise vs cloud), as well as vendor responsibilities for secure storage and auditability.
Value Chain Analysis
The South Korea POS terminals value chain spans component suppliers and terminal OEMs, software developers and systems integrators, and then payment connectivity and settlement rails. Hardware vendors provide countertop and mobile terminals with secure elements and IC/EMV capabilities, while POS software providers and integrators deliver Android-based smart POS, cloud dashboards, and connectors that link to inventory, loyalty, kiosk, and analytics modules.
Transaction routing and merchant onboarding are handled primarily through VAN providers and acquirers that connect terminals to card networks and bank settlement. They also run mandatory security testing and certification workflows before devices can process card payments. Downstream, merchants across retail, hospitality, healthcare, and logistics drive requirements such as QR acceptance, digital receipts, and e-invoicing compliance, which increases the share of recurring software and services (device management, security updates, and data analytics) alongside continued hardware replacement cycles.
Competitive Landscape
The vendor ecosystem is moderately fragmented. Samsung SDS, LG CNS, KSNET, NICE, and Hyundai Card square off against Ingenico, Verifone, Fujitsu, and Toshiba, while more than 800 fintech startups vie for niches in SoftPOS, QR overlays, and AI analytics. TSC’s KRW 120 billion (USD 83 million) purchase of Bluebird merged mobile POS, RFID, and tablets, seeking scale in last-mile and in-aisle deployments. Kakao Pay’s KRW 500 billion takeover of SSG Pay and Smile Pay expanded its merchant footprint and payment-gateway heft.
Price differentiation centers on NFC reader availability, QR overlay services, and AI modules for promotional targeting. Ingenico’s AXIUM CX9000 and Verifone’s X990 meet newer PCI-PTS 6.x standards and bundle app stores, while domestic players cross-sell VAN connectivity. Barcoding mandates in GS1 Release 21 require vendors to upgrade scanners and middleware for GS1 DataMatrix parsing, influencing grocery and produce retailers’ supplier choices.
White-space remains in healthcare, logistics, and SoftPOS. SoftPOS uptake is constrained by EMV certification delays but promises lower cost of ownership, a key lever for SMEs. NHN KCP’s KCP Order, which lets merchants rely on QR codes or NFC stickers, demonstrates disruptive potential by slashing hardware expenses. Vendors that marry secure processors with cloud analytics and barcode compliance are set to capture share as the South Korea POS terminals market tilts toward integrated, software-heavy solutions.
South Korea POS Terminals Industry Leaders
-
Fujitsu Korea Limited
-
HANASIS Co., LTD.
-
EES Corp Co. Ltd
-
Hwasung System Co., Ltd.
-
Toshiba Global Commerce Solutions Inc.
- *Disclaimer: Major Players sorted in no particular order
Market Opportunities and Future Outlook
The most visible opportunity is in subsidized smart-store upgrades for SMEs, where cost and compliance requirements are pushing merchants toward newer terminals, kiosks, and software-led POS stacks. The government's Smart Store Technology Dissemination Project supports adoption through subsidies that can cover 70% of costs (up to 80% for vulnerable groups such as simple taxpayers and single-person businesses), covering purchase, rental, and software-based models and giving vendors a pathway to bundle terminals with subscriptions and managed services.
Compliance-driven redesign is also creating whitespace in accessibility-ready unmanned terminals and integrated checkout. As of January 28, 2025, the Small Business Market Promotion Corporation requires barrier-free accessibility features for new unmanned terminals and kiosks installed at workplaces with fewer than 100 employees, encouraging replacements and feature upgrades such as voice output and wheelchair access that domestic OEMs and integrators can package into recurring offerings. In parallel, offline payment ecosystem expansion by major platforms and banks, including merchant terminal support programs and integrated offline terminals, continues to support demand for QR and NFC-capable devices and tighter integration between POS software, settlement accounts, and loyalty ecosystems.
Recent Industry Developments
- July 2026: Naver Pay announced that its Npay Connect offline integrated payment terminal exceeded 100,000 merchant locations. The expansion of offline merchant footprint strengthens the terminal ecosystem and improves network effects in the South Korea merchant base.
- July 2026: Rocket Pay offline expansion to brick-and-mortar retail stores. The move broadens Coupang’s payment rails beyond e-commerce, increasing merchant lock-in and data capture.
- July 2026: Merchant terminal purchase subsidy program in partnership with Toss Place. The program accelerates market-wide terminal upgrades by subsidizing new terminals for SMEs and captures settlement volume through banks.
Research Methodology Framework and Report Scope
Market Definition and Coverage
This market is defined as the revenue generated in South Korea from POS terminal solutions used to accept and process in-person payments at merchant locations, including devices, supporting software, and related services that enable checkout.
Scope exclusions: Revenue from purely online payment gateways, consumer-to-consumer transfers, and back-end banking rails that do not involve a merchant POS terminal at the acceptance point are excluded.
Segmentation Overview
- By Mode of Payment Acceptance
- Contact-based
- Contactless
- By POS Type
- Fixed Point-of-Sale Systems
- Mobile / Portable Point-of-Sale Systems
- By Component
- Hardware
- Software
- Services
- By Deployment Mode
- Cloud-based
- On-Premise
- By End-User Industry
- Retail
- Hospitality
- Healthcare
- Transportation and Logistics
- Other End-User Industries
Data Sources, Market Sizing, and Validation
Desk Research
Desk research was used to map the payment acceptance ecosystem in South Korea and to set practical guardrails for the model before speaking to industry participants. We typically pull official series and public trackers such as Bank of Korea statistics, Financial Supervisory Service releases, Korea Customs Service trade data (for relevant device categories), and Korea Communications Commission and Ministry of SMEs and Startups publications that help explain merchant digitization.
To translate those signals into market inputs, additional secondary sources were reviewed, including public company filings, investor presentations, payment ecosystem announcements, and business press coverage of terminal rollouts and merchant adoption. Where needed to connect the dots, paid databases were used for company financials and intelligence, patent databases, and shipment-level import and export views to cross-check device flow directionally. The desk sources listed here are illustrative only, and we also used other public references to collect, validate, and clarify data points.
Primary Interviews and Surveys
Primary work focused on interviews and surveys with payment acceptance stakeholders, including POS hardware and software participants, merchant acquirers and service providers, and large and mid-sized merchants that actively replace or expand terminals. These conversations were used to confirm contactless acceptance adoption, deployment preferences (cloud versus on-premise), and typical refresh cycles by end-use. We then used the same inputs to pressure-test the pricing and volume assumptions used in the model.
Distribution of primary research fieldwork respondents
| Company type | Respondent position |
|---|---|
| Top tier: 35% | CXOs: 16% |
| Mid tier: 49% | Functional/Unit leaders: 25% |
| Smaller Players: 16% | Managers: 59% |
Market-Sizing & Forecasting
Sizing starts with a top-down build that reconstructs the addressable POS terminal revenue pool from payment acceptance expansion in South Korea, and then allocates it across key solution buckets that merchants actually purchase. Once that picture is in place, selective bottom-up approximations are used as a cross-check, including sampled shipment and install patterns, channel feedback on unit movement, and a simple ASP multiplied by estimated volumes for common terminal form factors.
A few inputs that materially shape the model include: merchant location growth and churn by key end-use, the share of locations that accept card and contactless payments, replacement cycles for fixed and mobile terminals, the mix shift between contact-based and contactless acceptance, and blended pricing trends across hardware, software, and services. When some indicators were not available consistently, gaps were handled using proxy series (for example, trade flow direction or merchant digitization programs) and then adjusted back through interview feedback.
Forecasting relies on scenario analysis supported by time-series smoothing for stable variables, since terminal replacement and deployment typically follow steady budget cycles with step-ups during regulatory or technology transitions. Assumptions on adoption pace, price movement, and deployment mix were reviewed with industry participants to keep the forward view practical and repeatable.
Data Validation & Update Cycle
Outputs are validated through multiple checks that compare the model totals against independent demand signals, and then through consistency reviews across years to catch breaks that do not match known market events. Variances are investigated by revisiting key assumptions such as replacement timing, pricing progression, and mix changes between terminal types and deployment approaches. If a gap cannot be explained with available evidence, re-contact is triggered for relevant stakeholders.
Before sign-off, the work goes through a multi-step analyst review so calculation logic, units, and currency conversions stay consistent across the full time series. Reports are refreshed annually, and interim updates are done when material events occur that can change deployments or pricing. Before delivery, a final pass is completed to ensure clients receive the latest updated view.
Mordor Intelligence's South Korea Pos Terminal Market Estimate Compared With Other Published Estimates
Published market sizes for South Korea POS terminals can look far apart even when they are trying to describe the same industry. Differences usually come from what is counted as a POS terminal, whether software and services are included, how pricing is trended, and how frequently assumptions are refreshed.
The table below points to the largest gap driver: some sources lean toward a hardware-only view or a narrower definition of smart payment terminals, which changes the total even before growth is applied. In Mordor Intelligence's model, the value is built to include hardware, software, and services tied to POS terminal deployments across fixed and mobile form factors, which tends to lift totals versus device-only estimates and reduces double counting by keeping online-only rails out of scope.
Benchmark comparison
| Source | Market Size | Gaps in Research Methodology |
|---|---|---|
| Mordor Intelligence | USD 3.63 B (2026) | |
| Regional Consultancy A | USD 2.10 B (2024) | Uses an earlier base year and appears closer to a device-led valuation, which can understate revenue where software, services, and replacement-driven upgrades add meaningful share. |
| Trade Journal B | USD 0.18 B (2025) | Focuses on a narrower retail POS technology spend lens, which can omit broader merchant categories and excludes non-hardware revenue streams that are commonly bundled with terminals. |
Taken together, the spread is mainly explained by scope boundaries and how the revenue stack is assembled, rather than by radically different end-market demand. By tying the estimate to clear purchase components and to adoption and replacement behavior that can be checked through interviews and public signals, the resulting number stays easier to trace and replicate year over year.
Key Questions Answered in the Report
What is the 2026 value of the South Korea POS terminals market?
It stands at USD 3.63 billion, with a forecast to reach USD 5.07 billion by 2031.
Which segment is growing fastest by payment acceptance mode?
Contactless systems are projected to expand at a 7.54% CAGR through 2031.
Why are healthcare providers adopting more POS terminals?
Hospitals and clinics are digitizing billing and insurance claims, driving an expected 8.12% CAGR in healthcare deployments.
How does Zero Pay influence small merchant adoption?
Zero Pay’s zero-fee model lowers transaction costs and encourages SMEs to install QR-enabled terminals.
What is the main security concern for merchants in 2026?
Cyber-fraud, highlighted by the 2025 Lotte Card breach, is forcing upgrades to PCI-PTS 6.x terminals.
Are cloud POS solutions overtaking on-premise systems?
Cloud deployments are rising at a 7.48% CAGR, yet on-premise still holds the majority share due to data-sovereignty preferences.