Bank Kiosk Market Size and Share
Market Overview
| Study Period | 2020 - 2031 |
|---|---|
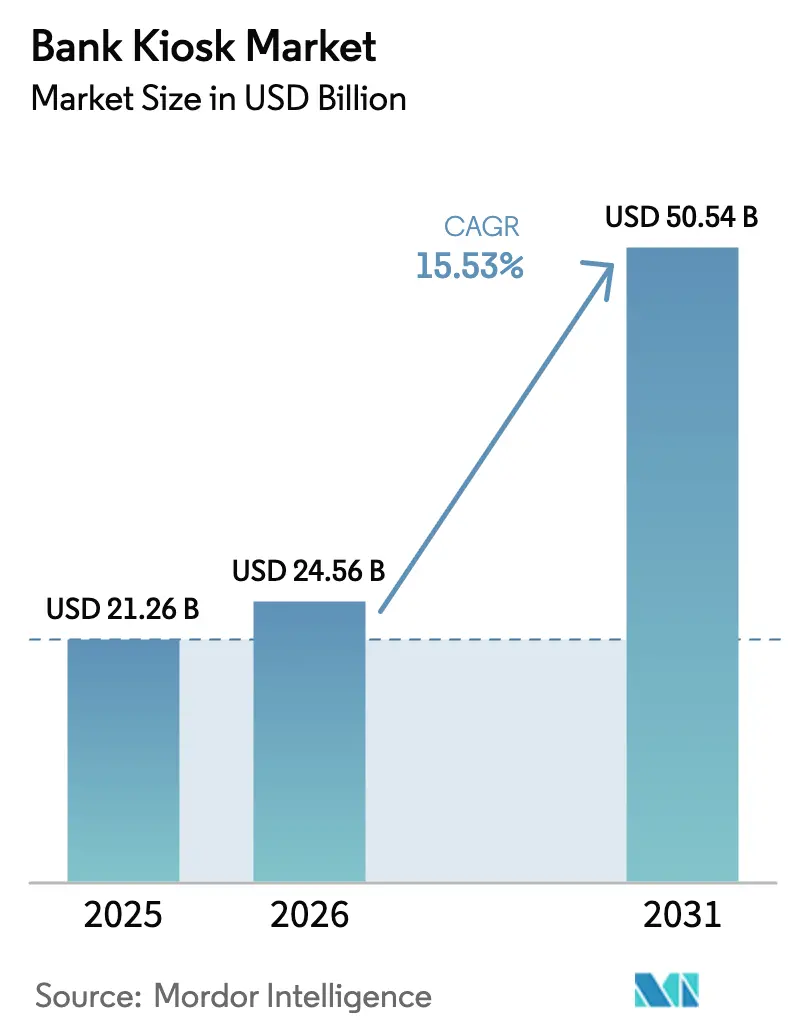
| Market Size (2026) | USD 24.56 Billion |
| Market Size (2031) | USD 50.54 Billion |
| Growth Rate (2026 - 2031) | 15.53% CAGR |
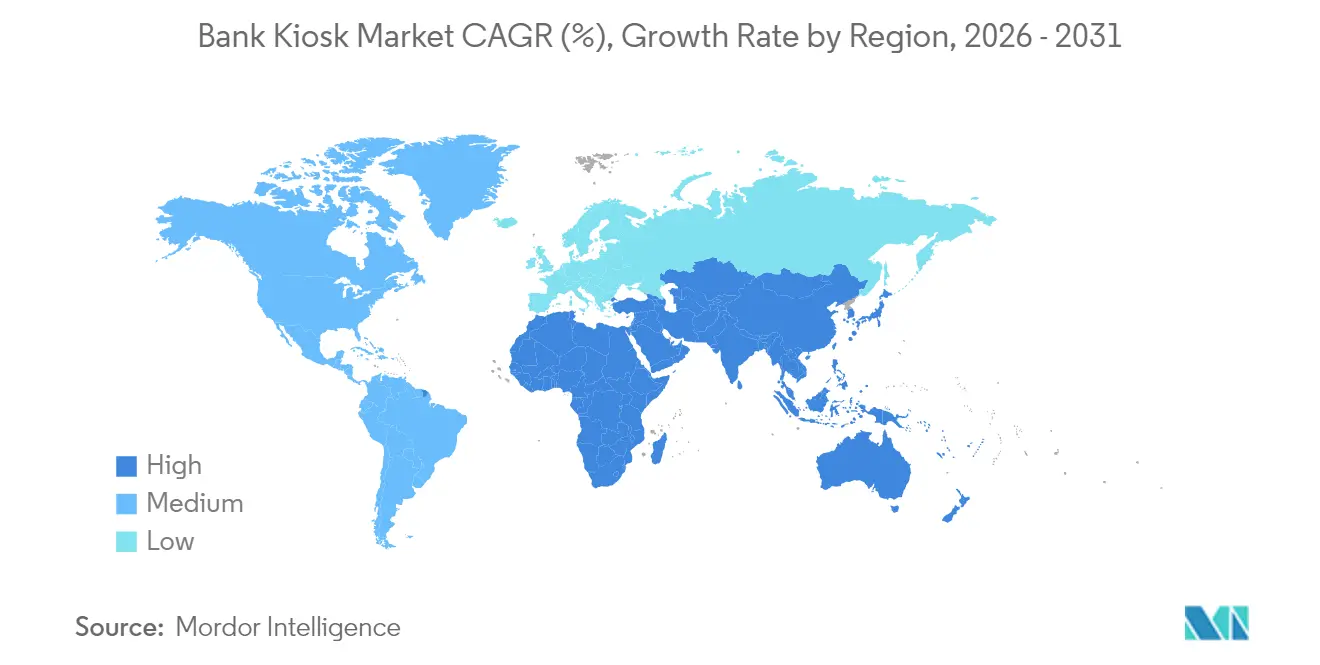
| Fastest Growing Market | Asia Pacific |
| Largest Market | North America |
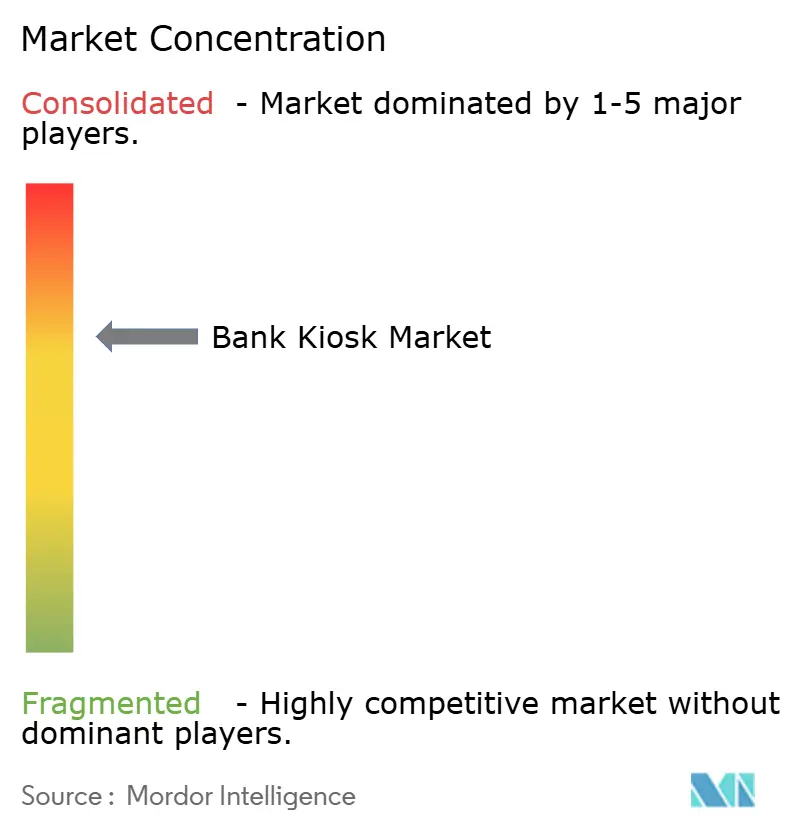
| Market Concentration | Medium |
Major Players *Disclaimer: Major Players sorted in no particular order Image © Mordor Intelligence. Reuse requires attribution under CC BY 4.0. | |
Bank Kiosk Market Analysis by Mordor Intelligence
The bank kiosk market size was valued at USD 21.26 billion in 2025 and estimated to grow from USD 24.56 billion in 2026 to reach USD 50.54 billion by 2031, at a CAGR of 15.53% during the forecast period (2026-2031). Branch-transformation programs, accelerating financial inclusion initiatives, and sustained demand for self-service channels anchor this momentum. Deployments now blend AI-enabled predictive maintenance, biometric authentication, and cloud-native software to boost uptime, reduce fraud, and personalize customer journeys. Multi-function platforms able to perform 90% of teller tasks are lowering per-transaction costs, freeing staff for advisory duties, and opening new service points in previously underserved areas. Intensifying competition from fintech firms and hardware commoditization are driving incumbents to pivot toward software and recurring services, reshaping monetization models across the ecosystem.
Key Report Takeaways
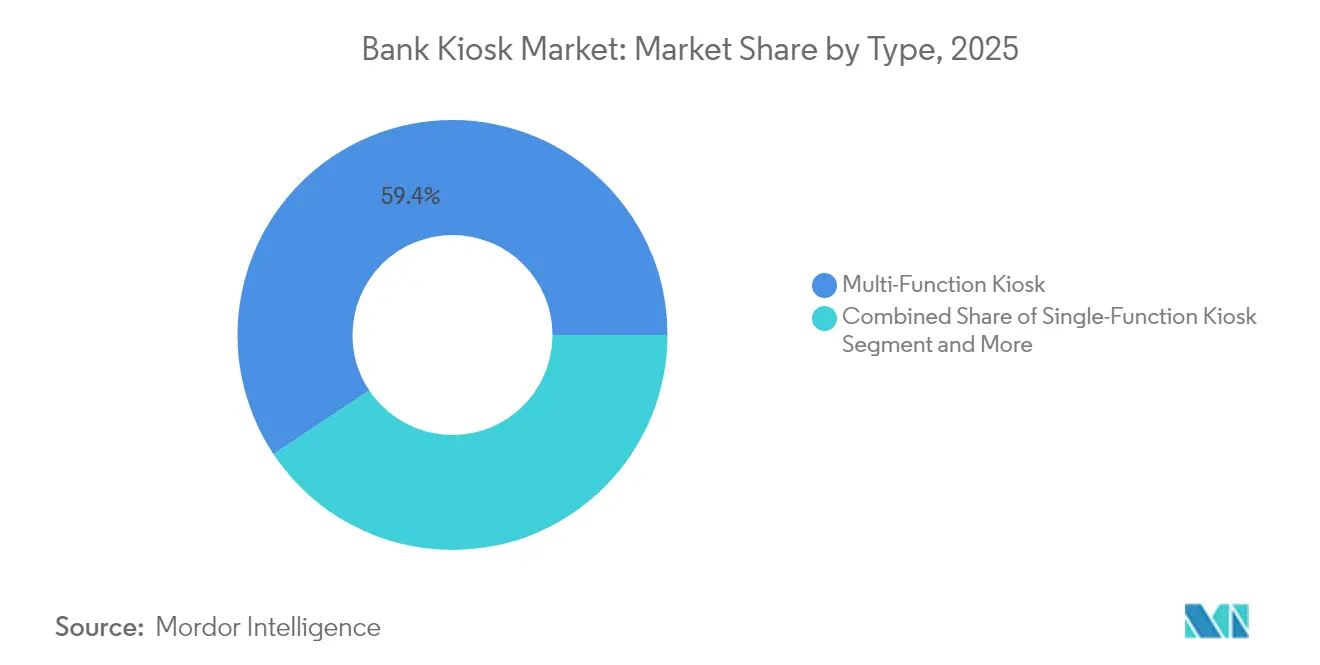
- By type, Multi-Function Kiosks led with 59.35% revenue share of the bank kiosk market in 2025; Virtual/Video Teller Machines are projected to record the fastest 19.47% CAGR through 2031.
- By offering, Hardware accounted for 50.76% of the bank kiosk market size in 2025, while Services are forecast to expand at an 17.84% CAGR to 2031.
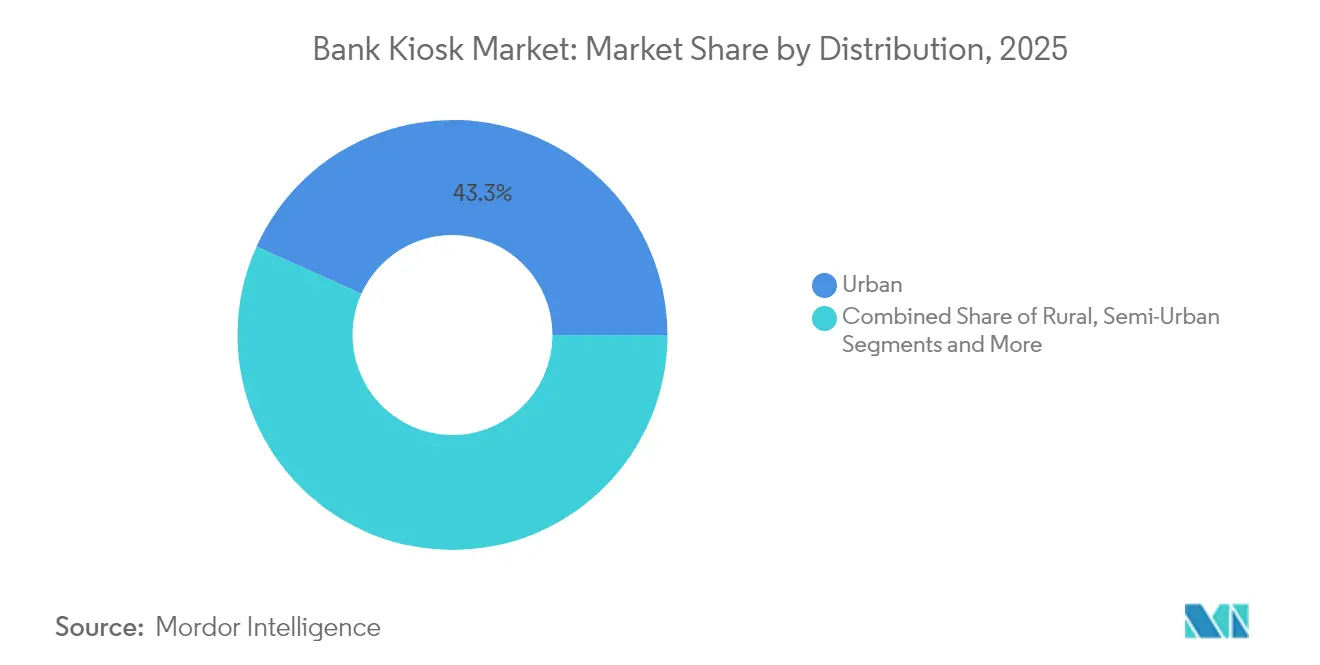
- By distribution, Urban locations held 43.25% of the bank kiosk market share in 2025; Rural deployments are expected to grow at 16.21% CAGR between 2026 and 2031.
- By location, Off-site installations captured 52.88% of the bank kiosk market size in 2025, whereas On-site units are advancing at a 16.02% CAGR through 2031.
- North America commanded 27.95% of global revenue in 2025; Asia-Pacific is the fastest-growing region with a 16.52% CAGR through 2031.
Note: Market size and forecast figures in this report are generated using Mordor Intelligence’s proprietary estimation framework, updated with the latest available data and insights as of 2026.
Global Bank Kiosk Market Trends and Insights
Drivers Impact Analysis*
| Driver | (~) % Impact on CAGR Forecast | Geographic Relevance | Impact Timeline |
|---|---|---|---|
| Rising demand for self-service multi-function kiosks | +4.2% | Global, with highest adoption in North America and Europe | Medium term (2-4 years) |
| Cost reduction and branch optimisation | +3.8% | Global, particularly acute in mature markets with high labor costs | Short term (≤ 2 years) |
| Enhanced customer experience / shorter queues | +2.9% | Urban centers globally, particularly in Asia-Pacific | Medium term (2-4 years) |
| AI-enabled predictive maintenance cuts downtime | +1.7% | North America, Europe, developed Asia markets | Medium term (2-4 years) |
| Financial-inclusion mandates in emerging markets | +2.1% | Asia-Pacific, Africa, parts of Latin America | Long term (≥ 4 years) |
| Branch-as-a-Service kiosks for fintech tie-ups | +1.5% | North America, Europe, urban Asia-Pacific | Long term (≥ 4 years) |
| Source: Mordor Intelligence | |||
Rising Demand for Self-Service Multi-Function Kiosks
Banks continue to replace legacy ATMs with multi-function units able to complete 90% of branch transactions, including cash recycling, account opening, and loan origination. Customer preference has shifted markedly, with 75% rating interactive-teller experiences higher than traditional counter service. Transaction abandonment has fallen by 40% as intuitive interfaces streamline workflows. The driver resonates most in metro areas where digital expectations are highest and branch footprints are shrinking. Cost efficiencies further amplify adoption, cementing the role of multi-function kiosks as core infrastructure in the bank kiosk market.
Cost Reduction and Branch Optimisation
Personal Teller Machines cost 20–30% less than legacy ATMs yet handle nearly all teller operations, enabling annual savings of USD 70,000–100,000 per unit. Institutions implementing hub-and-spoke networks with kiosk-only satellites have lowered network operating costs by up to 25%. Staff redeployment toward advisory roles improves cross-sell rates and revenue per employee. Mature markets with elevated labor expenses see the strongest ROI, reinforcing kiosk investment across the bank kiosk market.
Enhanced Customer Experience and Shorter Queues
Average transaction times have fallen 40–60%, shrinking lines and boosting satisfaction. Remote video tellers now deliver perceived service quality on par with in-branch staff for 69% of users. Extended kiosk operating hours, often 12–24 hours daily, benefit small businesses that bank outside normal windows. Queue-management integrations let customers pre-book slots via mobile, while personalization engines leverage data to present tailored menus, cementing loyalty and driving repeat use in the bank kiosk market.
AI-Enabled Predictive Maintenance Cuts Downtime
Machine-learning algorithms monitoring more than 200 performance parameters now predict failures before they occur, cutting critical downtime by up to 35%. Remote resolution addresses 45% of incidents without site visits, slashing mean-time-to-repair from days to hours. Given that each hour offline equates to USD 250–400 in lost value, uptime gains materially strengthen the business case for scaling kiosk fleets, especially at off-site venues where access is harder.
Restraints Impact Analysis*
| Restraint | (~) % Impact on CAGR Forecast | Geographic Relevance | Impact Timeline |
|---|---|---|---|
| High upfront installation and maintenance costs | -2.3% | Global, particularly impactful in emerging markets | Short term (≤ 2 years) |
| Mobile banking cannibalisation of foot-traffic | -1.9% | Urban centers globally, particularly in markets with high smartphone penetration | Medium term (2-4 years) |
| Regulatory scrutiny of biometric data at kiosks | -1.2% | Europe (GDPR), California (CCPA), emerging global regulations | Medium term (2-4 years) |
| Escalating cyber-attack surface and reputational risk | -1.4% | Global, with heightened impact in markets with stringent data protection laws | Long term (≥ 4 years) |
| Source: Mordor Intelligence | |||
High Upfront Installation and Maintenance Costs
Fully featured Interactive Teller Machines cost USD 60,000–80,000 per unit, with site preparation adding another USD 10,000–15,000. Annual maintenance and licensing consume 20–25% of hardware value, stretching ROI horizons to 24–36 months. Smaller banks and institutions in emerging markets face budget hurdles, though hardware-as-a-service financing is gaining traction, converting capital expenditure into opex and potentially unlocking latent demand in the bank kiosk market.
Mobile Banking Cannibalisation of Foot-Traffic
Smartphone transactions are rising 28% annually, diverting basic tasks like balance inquiries away from physical channels. Each 10% mobile-use uptick correlates with a 3–5% decline in kiosk volumes, pressuring utilization rates among younger, high-value demographics. Vendors are countering by enabling complex workflows—document scanning, high-value cash, and biometric ID—that remain challenging on small screens, while pre-staged mobile transactions finalized at kiosks aim to blend both touchpoints.
*Our forecasts treat driver/restraint impacts as directional, not additive. The impact forecasts reflect baseline growth, mix effects, and variable interactions.
Segment Analysis
By Type: Multi-Function Dominance with Video Teller Momentum
Multi-Function units captured 59.35% of bank kiosk market share in 2025 by consolidating cash handling, check imaging, card issuance, and document workflows. Transaction costs average USD 0.70 versus USD 4.50 for counter service, allowing urban branches to trim operating expenses by up to 40%. In the bank kiosk market size context, these systems anchor most transformation projects, enabling smaller footprints and higher throughput. The segment’s growth is reinforced by modular designs that accommodate biometric modules, digital-receipt printers, and AI-driven personalization, future-proofing investments for banks wary of obsolescence.
Virtual/Video Teller Machines, projected to post a 19.47% CAGR, fuse automation with human expertise through centralized call centers. Banks report that 81% of customers deem remote tellers as knowledgeable as in-person staff, widening acceptance in both complex and advisory transactions. Workforce pooling improves staffing flexibility, and extended hours differentiate service in competitive urban corridors. Single-Function kiosks persist in niche use cases but their relevance is shrinking as integrated solutions dominate the bank kiosk market.


By Offering: Hardware Foundations with Services Upswing
Hardware retained 50.76% of 2025 revenue, underpinning the bank kiosk market with touch displays, cash recyclers, encrypted PIN pads, and multi-modal biometric sensors. Manufacturers emphasize energy efficiency—new lines consume 40% less power—and modularity that extends asset lives beyond seven years. Mandatory security updates, including TR-31 key block mandates effective 2025, are triggering refresh cycles and supporting near-term hardware demand across the bank kiosk market.
Services, advancing at an 17.84% CAGR, reflect the operational complexity of multi-vendor estates. Predictive maintenance contracts guaranteeing 98%+ uptime command premiums of 15-20% over break-fix models. Managed-service agreements cover software patching, cash logistics, and fraud monitoring, shifting risk from banks to vendors and creating sticky, recurring revenue streams. Concurrently, API-first software platforms enable agile deployment of new features, expanding addressable value within the bank kiosk market.
By Distribution: Urban Stronghold and Rural Acceleration
Urban deployments held 43.25% of 2025 revenue, reflecting dense transaction volumes and digital-first customer expectations. City branches are shrinking their floor space by up to 30% while embedding kiosks as the primary transaction channel, elevating advisory engagement ratios. High deployment density yields scale benefits in cash handling and service logistics, reinforcing ROI in metropolitan areas of the bank kiosk market.
Rural installations, growing 16.21% annually, leverage kiosk economics to bridge service gaps where full-service branches are non-viable. Programs such as India’s Digital India and NABARD support subsidies for micro-ATM and kiosk rollouts. Ruggedized hardware and offline transaction queuing address connectivity challenges, expanding financial access. Semi-urban zones sit between these extremes, balancing volume and cost, while metropolitan transport hubs integrate kiosks with ticketing and municipal services, broadening use cases inside the bank kiosk market.
By Location: Off-Site Reach Versus On-Site Reinvention
Off-site kiosks led with 52.88% of 2025 revenue, enabling banks to seed touchpoints in retail stores, airports, and campuses with 1,500–2,000 monthly transactions per unit. Break-even periods as short as 18 months underscore compelling economics. Physical security innovations such as IoT alarms, reinforced vaults, and AI-based anomaly detection are pivotal in sustaining trust at unmanned sites and underpin the off-site component of the bank kiosk market size.
On-site units, expanding at 16.02% CAGR, underpin branch reconfiguration from cashier counters to advisory lounges. When 70–80% of routine transactions migrate to self-service, teller headcount falls 30–40% and customer-relationship time rises. Integrated scheduling tools let users switch seamlessly from self-service to banker consultation, tightening retention. Open-plan kiosk designs replace enclosed booths, aligning with branch aesthetics that favor transparency and collaboration across the evolving bank kiosk market.
Geography Analysis
North America retained a 27.95% revenue share in 2025, propelled by FDIC guidance that Interactive Teller Machines are not domestic branches, cutting compliance hurdles. United States banks account for two-thirds of regional deployments, leveraging kiosks to consolidate footprints while sustaining coverage in suburban and rural zones. Canadian institutions lead in video teller adoption, with 35–40% of complex tasks now completed remotely, highlighting a mature service blend inside the bank kiosk market.
Asia-Pacific is forecast to post a 16.52% CAGR through 2031, spearheaded by large-scale national inclusion campaigns. China commands roughly 40% of regional volume, embedding advanced biometrics and AI-driven analytics into next-gen units to serve vast urban populations. India relies on kiosks to extend formal banking into underbanked villages, underpinning explosive unit growth that reshapes the global bank kiosk market trajectory. Japan and South Korea innovate through integrations with investment, crypto, and transport ecosystems, broadening functional scope.
Europe exhibits divergent patterns: Western states optimize existing branch networks while Eastern markets expand first-generation coverage. Germany and the United Kingdom report that 50–60% of day-to-day transactions have moved to kiosks, freeing staff for higher-value roles. GDPR compliance fuels investment in privacy safeguards such as proximity sensors and privacy filters. The Middle East aligns kiosk rollouts with smart-city programs, while selected African nations experiment with hybrid models that blend mobile pre-staging with kiosk completion, enlarging inclusion within the bank kiosk market.

Competitive Landscape
The bank kiosk market features moderate concentration; the top five suppliers capture roughly 65% of global revenue. NCR, Diebold Nixdorf, and Nautilus Hyosung maintain scale advantages yet increasingly monetise through cloud software, analytics, and managed services as hardware margins compress. Diebold Nixdorf’s DN Vynamic suite exemplifies this pivot, enabling integrated orchestration of transactions, security, and customer journeys while delivering durable annuity streams.
Regional specialists including GRG Banking in China and OKI Electric in Japan harness local regulatory knowledge to tailor feature sets such as multi-language interfaces and government-ID verification. Partnerships between hardware vendors and fintech firms are proliferating, fusing open-API platforms with niche capabilities in blockchain, small-business services, and data analytics. Disruptors focused on cloud-agnostic software challenge vertically integrated incumbents by lowering switching friction for banks, an emerging competitive battleground inside the bank kiosk market.
Artificial intelligence is now the primary differentiator. Vendors compete on predictive maintenance accuracy, fraud detection algorithms, and real-time personalization engines. Sustainability is an additional vector, with newest models cutting power draw by up to 40% and supporting recycled-material casings. As managed-service penetration deepens, the basis of rivalry shifts from unit shipments to lifetime value, reinforcing ecosystem lock-in and redefining competitive strategy across the bank kiosk market.
Bank Kiosk Industry Leaders
NCR Corporation
Diebold Inc
Glory Limited
Nautilus Hyosung Corporation
Korala Associates Ltd (KAL ATM Software)
- *Disclaimer: Major Players sorted in no particular order

Recent Industry Developments
- May 2025: NCR Atleos launched its next-generation SelfServ 80 Series, featuring enhanced cash recycling capabilities and integrated Interactive Teller functionality. The new platform reduces energy consumption by 35% compared to previous models while supporting a broader range of transactions, including instant loan approvals and identity verification services.
- March 2025: Fiserv introduced its Clover banking kiosk platform in Australia, expanding its global footprint with an all-in-one solution that integrates various business management tasks. The system features proprietary hardware and software designed to streamline operations for financial institutions and their small business customers.
- February 2025: Diebold Nixdorf reported strong financial results for Q4 2024, highlighting the success of its DN Series self-service solutions in driving growth. The company emphasized the role of its cloud-based software platforms in creating recurring revenue streams and enhancing customer retention.
- January 2025: Faytech unveiled a 30-inch transparent OLED kiosk at CES 2025, designed for banking applications with a multi-touch interface and integrated payment system. The innovative display technology allows for enhanced customer engagement while maintaining a smaller physical footprint than traditional kiosks.


Research Methodology Framework and Report Scope
Market Definitions and Key Coverage
Our study describes the bank kiosk market as all self-service terminals placed by regulated banks and credit unions that let customers complete account opening, cash and check transactions, card issuance, and video-assisted services without teller intervention. Hardware, embedded software, and the recurring field services that keep these kiosks operational are included; supporting branch-core software licenses that are not physically resident in a kiosk are excluded.
Scope exclusion: Non-bank retail kiosks (ticketing, quick-service food, government service, gaming) fall outside this review.
Segmentation Overview
- By Type
- Single-Function Kiosk
- Multi-Function Kiosk
- Virtual / Video Teller Machine
- By Offering
- Hardware
- Software
- Services
- By Distribution
- Rural
- Semi-Urban
- Urban
- Metropolitan
- By Location
- On-site
- Off-site
- By Geography
- North America
- United States
- Canada
- Mexico
- Europe
- Germany
- United Kingdom
- France
- Italy
- Spain
- Rest of Europe
- Asia-Pacific
- China
- India
- Japan
- South Korea
- Australia and New Zealand
- Rest of Asia-Pacific
- South America
- Brazil
- Argentina
- Rest of South America
- Middle East and Africa
- Middle East
- Saudi Arabia
- United Arab Emirates
- Turkey
- Rest of Middle East
- Africa
- South Africa
- Nigeria
- Rest of Africa
- Middle East
- North America
Detailed Research Methodology and Data Validation
Primary Research
We interviewed kiosk integrators, regional banking associations, and digital-banking chiefs across North America, Europe, Asia Pacific, and the GCC. Their insights on service-call frequencies, parts replacement costs, and pilot success rates allowed us to fine-tune utilization factors, payback periods, and realistic rollout pacing that pure desk work could not capture.
Desk Research
Mordor analysts first scraped and cleaned large publicly available data sets such as the World Bank's financial-inclusion indicators, BIS statistics on ATM density, and IMF exchange-rate series, which set the customer base and price context. We complemented these with policy papers from the FDIC, the European Banking Authority, and the Reserve Bank of India showing regulatory nudges toward branch-lite operations, plus shipment data from Volza and patent trends accessed through Questel to map diffusion of video teller technology. Annual reports, 10-Ks, investor decks, and reputable business press articles then helped validate average selling prices and refresh cycles across regions. This list is illustrative; many additional secondary sources were mined to cross-check figures and resolve data gaps.
Market-Sizing & Forecasting
A top-down model converts bank branch counts and retail-banking footfall into a demand pool, then applies region-specific kiosk penetration rates derived from primary interviews; selective bottom-up cross-checks roll up average selling price multiplied by estimated installed base reported by ten leading manufacturers. Key variables like average kiosk ASP, branch rationalization ratio, video teller uptake, cash-to-digital payment share, and service-contract renewal rate drive the historical series. A multivariate regression, updated annually, links these variables to installed base growth and feeds an ARIMA overlay to smooth cyclical shocks before extending the forecast to 2030.
Data Validation & Update Cycle
Every draft output passes three rounds: automated variance scans against historical ratios, peer review by a senior analyst, and a reconciliation call if deviations exceed preset thresholds. Models refresh each year, while significant events, large regulatory changes or material M&A, trigger an interim update so clients always receive current numbers.
Why Mordor's Bank Kiosk Baseline Commands Reliability
Published figures rarely match because firms diverge on what counts as a "bank kiosk," which costs they bundle, and how often they refresh estimates.
Key gap drivers include: some publishers model only hardware revenue, others bundle all self-service kiosks, and several use static ASPs that ignore rapid price erosion in emerging markets. Mordor's scope mirrors actual bank procurement baskets, our base case reflects mid-range adoption rather than extreme scenarios, and the dataset is refreshed every twelve months.
Benchmark comparison
| Market Size | Anonymized source | Primary gap driver |
|---|---|---|
| USD 21.26 billion (2025) | Mordor Intelligence | - |
| USD 21.97 billion (2025) | Global Consultancy A | Includes certain fintech-run kiosks outside regulated banks; limited primary validation |
| USD 0.94 billion (2023) | Industry Research B | Hardware-only revenue and excludes service contracts, uses static ASPs |
| USD 0.74 billion (2021) | Trade Journal C | Narrow geographic coverage and five-year-old exchange rates |
Taken together, the comparison shows that wider or narrower scopes and dated assumptions swing totals dramatically, whereas Mordor's disciplined variable selection and annual cross-checks deliver a balanced, transparent baseline managers can trust.


Key Questions Answered in the Report
What is the current size of the bank kiosk market?
The bank kiosk market stands at USD 24.56 billion in 2026 and is projected to reach USD 50.54 billion by 2031.
Which segment holds the largest share of the bank kiosk market?
Multi-Function Kiosks lead with 59.35% revenue share in 2025 due to their ability to handle most teller transactions and lower operating costs.
Why are services growing faster than hardware in the bank kiosk market?
Banks increasingly outsource maintenance, software updates, and predictive analytics, driving an 17.84% CAGR for services as they focus on core activities.
Which region is expected to grow fastest through 2031?
Asia-Pacific is forecast to expand at a 16.52% CAGR, propelled by financial inclusion programs and rapid urbanization, especially in China and India.
How do predictive-maintenance features improve kiosk economics?
AI-driven monitoring cuts critical downtime by up to 35% and resolves 45% of issues remotely, protecting transaction revenue and customer satisfaction.
What is the main challenge restraining wider adoption in emerging markets?
High upfront installation costs—USD 60,000–80,000 per unit plus site preparation—stretch ROI periods, though hardware-as-a-service models are easing the burden.
Page last updated on:


