Rendered Poultry Products Market Size and Share
Market Overview
| Study Period | 2020 - 2030 |
|---|---|
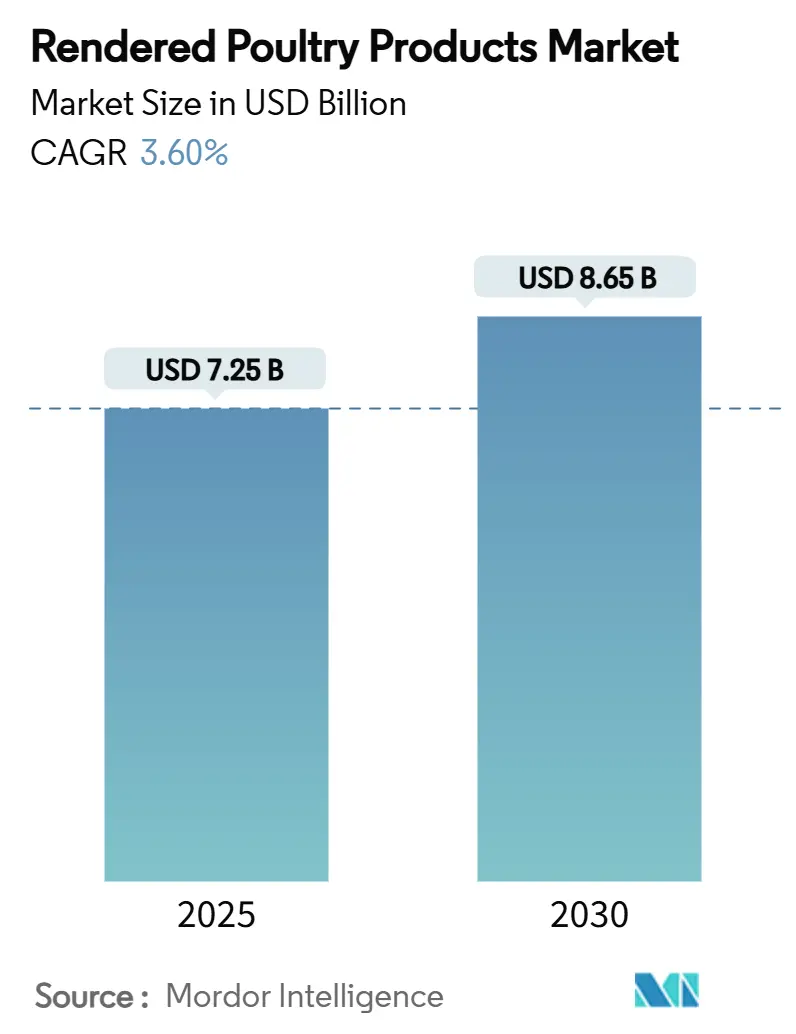
| Market Size (2025) | USD 7.25 Billion |
| Market Size (2030) | USD 8.65 Billion |
| Growth Rate (2025 - 2030) | 3.60% CAGR |
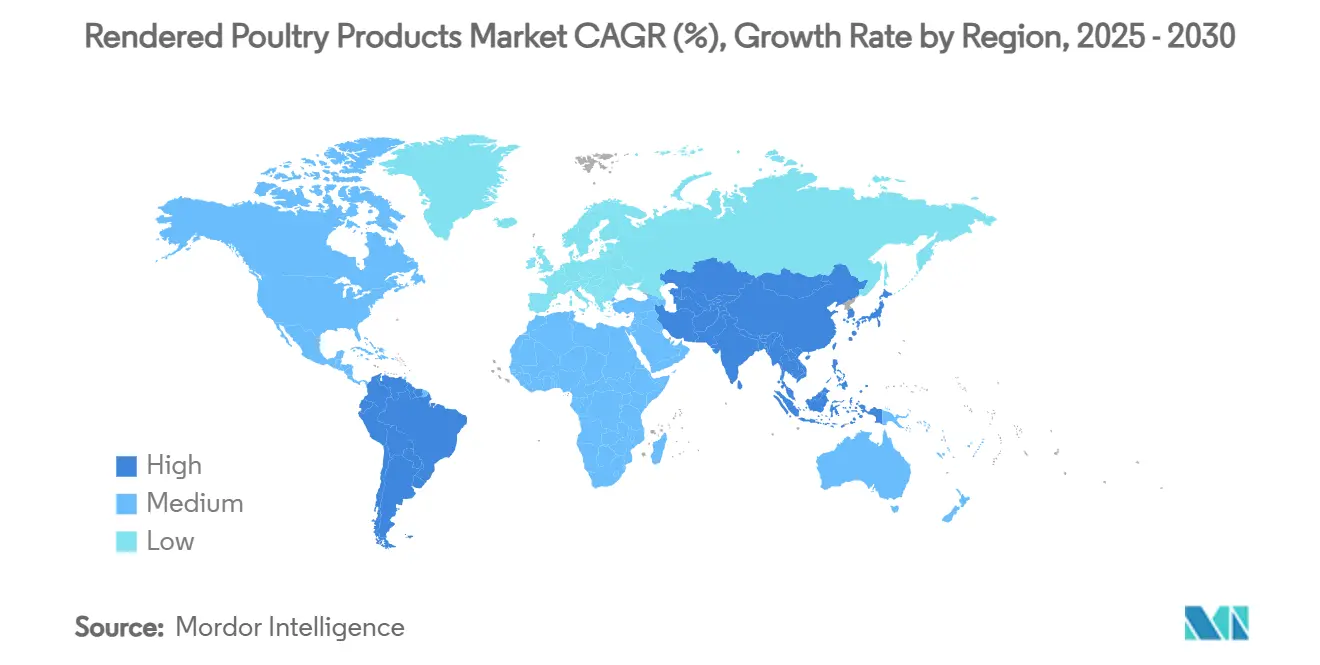
| Fastest Growing Market | Asia Pacific |
| Largest Market | North America |
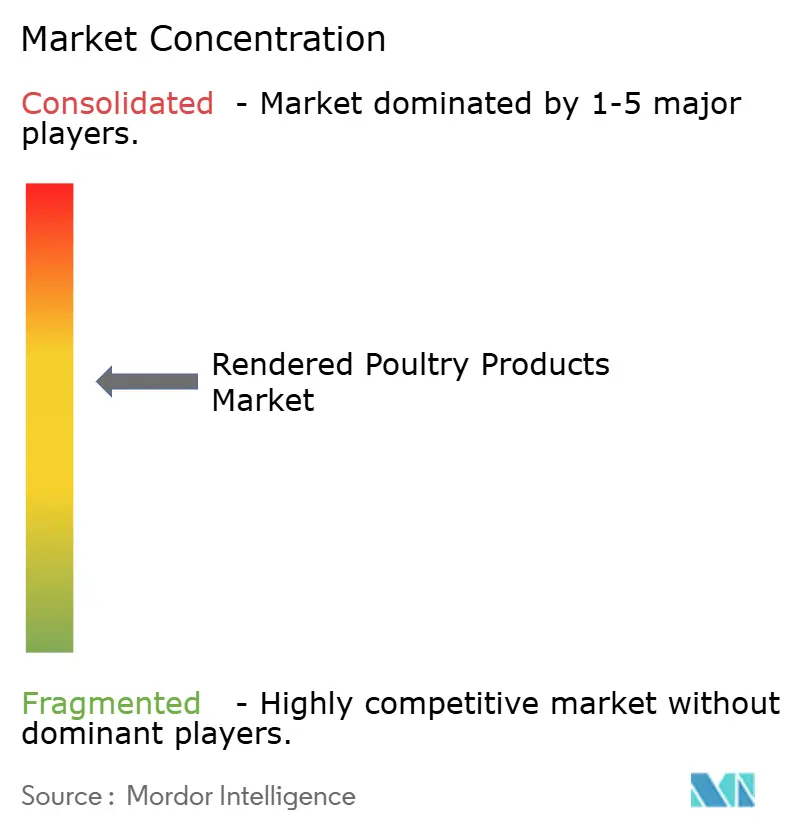
| Market Concentration | Medium |
Major Players *Disclaimer: Major Players sorted in no particular order Image © Mordor Intelligence. Reuse requires attribution under CC BY 4.0. | |
Rendered Poultry Products Market Analysis by Mordor Intelligence
The rendered poultry products market size stood at USD 7.25 billion in 2025 and is projected to reach USD 8.65 billion by 2030, advancing at a 3.6% CAGR. This moderate expansion reflects the maturation of an industry now capturing new demand from pet food manufacturers and premium animal feed formulators. Strong policy support for rising pet humanization and circular-economy regulations collectively reinforces growth momentum. At the same time, capacity additions in emerging economies, investments in traceability systems, and process upgrades that maximize protein yield are reshaping competitive strategies across regions. Price sensitivity in traditional feed markets persists, yet diversification into functional pet food ingredients cushions revenue volatility for integrated producers. Sustainability credentials, regulatory alignment, and technology adoption, therefore, remain decisive success factors in the rendered poultry products market.
Key Report Takeaways
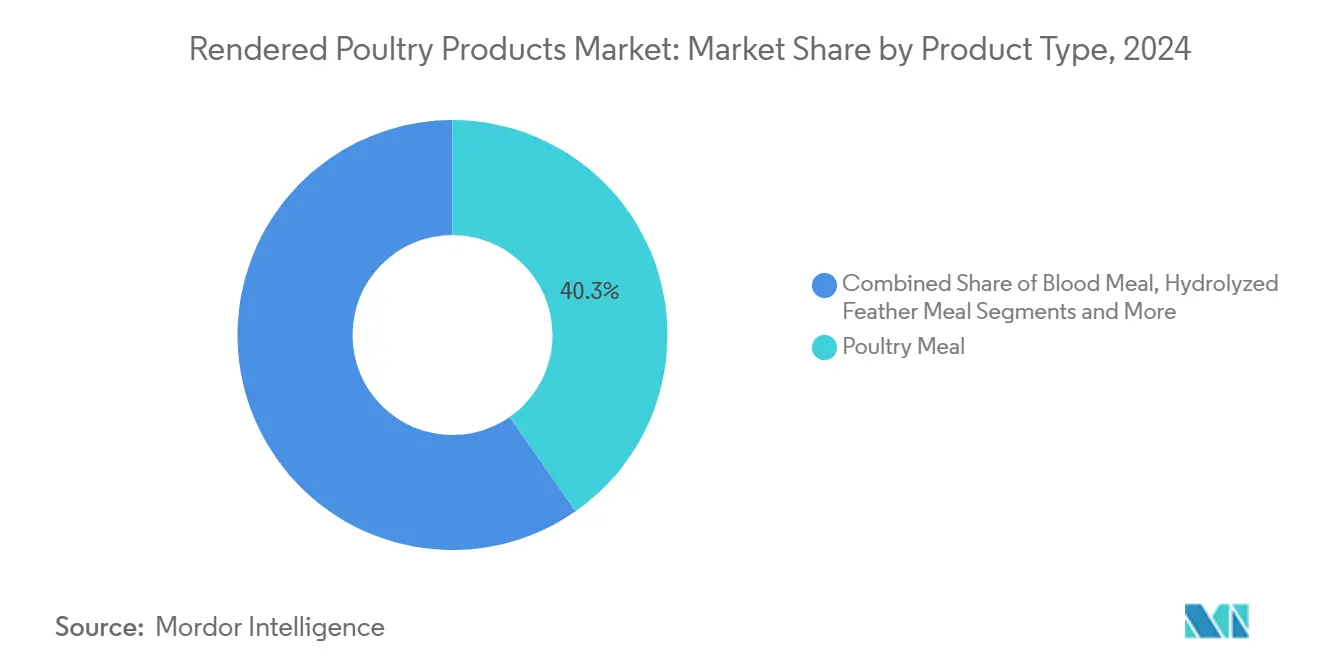
- By product type, poultry meal accounted for 40.3% of the rendered poultry products market share in 2024, while refined poultry fat is projected to advance at a 7.7% CAGR through 2030.
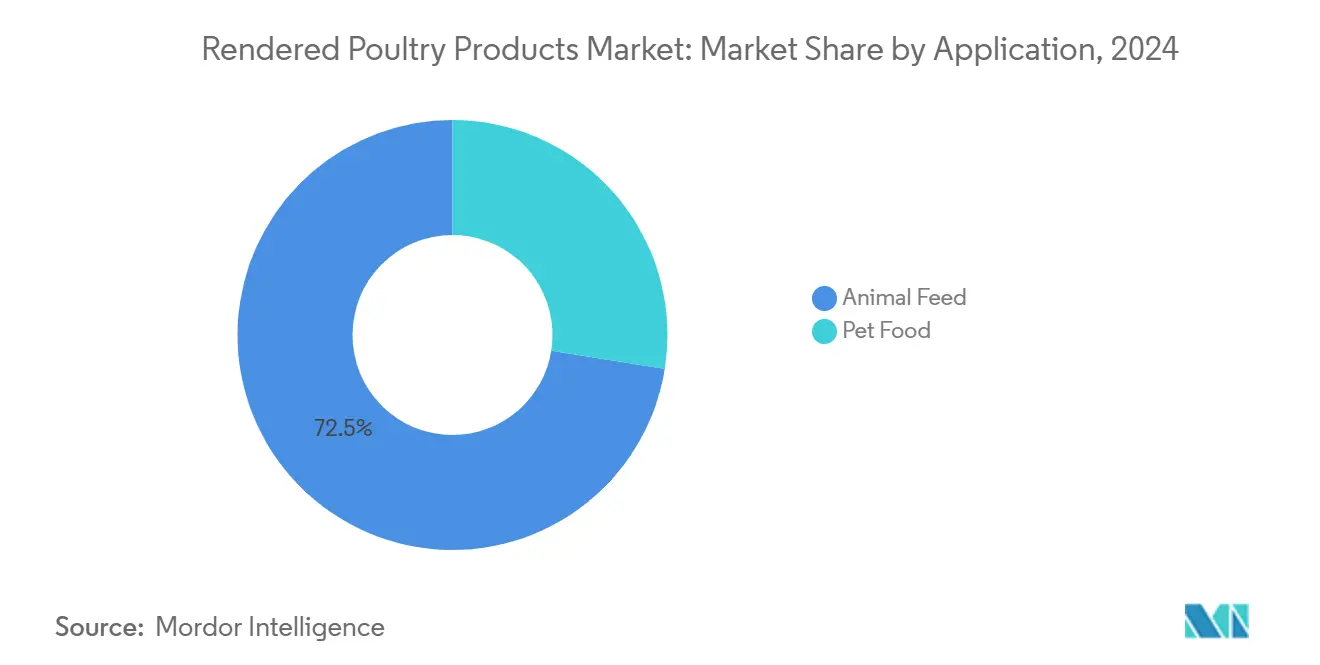
- By application, animal feed accounted for 72.5% of the rendered poultry products market size in 2024, whereas pet food is forecast to expand at a 7.2% CAGR over the same period.
- By process type, dry rendering commanded a 62.0% share in 2024, and wet rendering is set to register a 6.6% CAGR through 2030.
- By geography, North America contributed 36.5% revenue in 2024, and Asia-Pacific is anticipated to grow at a 6.1% CAGR to 2030.
Global Rendered Poultry Products Market Trends and Insights
Drivers Impact Analysis*
| Driver | (~) % Impact on CAGR Forecast | Geographic Relevance | Impact Timeline |
|---|---|---|---|
| Rising demand for high protein aquafeed ingredients | +1.2% | North America and European Union | Medium term (2-4 years) |
| Growth in premium pet food formulations | +0.8% | Global, concentrated in developed markets | Long term (≥ 4 years) |
| Regulatory pressure to curb food waste | +0.6% | Global, led by European Union and North America | Short term (≤ 2 years) |
| Surge in insect-protein and blended feed solutions | +0.4% | Asia-Pacific core, spill-over to global markets | Long term (≥ 4 years) |
| Commercialization of cultured-fat technology | +0.3% | North America and European Union early adoption | Long term (≥ 4 years) |
| Blockchain-enabled traceability demands | +0.2% | Global, premium market segments | Medium term (2-4 years) |
| Source: Mordor Intelligence | |||
Rising Demand for High-Protein Aquafeed Ingredients
Global aquaculture growth is lifting demand for cost-effective, high-protein feed ingredients that match the performance of fishmeal. Rendered poultry meal offers the essential amino acids needed for carnivorous fish and shrimp while delivering more stable prices than marine proteins that swing with catch limits and climate shifts. Converting processing byproducts into feed supports circular economy goals and appeals to sustainability-focused producers. Modern low-temperature rendering and enzymatic treatments create specialized aquafeed grades with higher digestibility and fewer anti-nutritional factors, letting processors command premiums over conventional livestock meals. The 2025 International Rendering Symposium highlighted this opportunity, stressing that aquafeed will outpace traditional livestock feed demand as farmed seafood continues to grow faster than wild-catch output[1]Source: U.S. Poultry and Egg Association, “Rendering Industry’s Key Roles in Animal Agriculture Sustainability to be Highlighted at 2025 International Rendering Symposium,” U.S. Poultry and Egg Association, uspoultry.org.
Growth in Premium Pet Food Formulations
Pet food premiumization drives greater use of traceable, high-quality poultry proteins that support claims around digestibility, joint health, and hypoallergenicity. Manufacturers increasingly specify hydrolyzed meals and concentrated amino acid profiles that command price multiples over commodity feed meals. To meet audit requirements, leading renderers deploy in-line quality sensors, hazard analysis protocols, and blockchain-based identity preservation systems that document origin, processing conditions, and nutrient composition. As discretionary spending on companion animals rises in North America, Europe, and parts of Asia, renderers can guarantee consistency and transparency gain bargaining power with brand-owner customers that rely on differentiated ingredient narratives.
Regulatory Pressure to Curb Food Waste
Mandatory organic waste diversion rules, exemplified by Maryland’s Wasted Food Law, obligate large generators to redirect residuals away from landfills if weekly volumes exceed 1 metric ton[2]Source: Maryland Department of the Environment, “Solid Waste Management – Organics Recycling and Waste Diversion,” mde.maryland.gov. Similar frameworks in the EU, Canada, and select U.S. states reclassify rendering as an essential compliance pathway rather than a discretionary recycling service. These statutes create stable inbound raw material streams, limit feedstock leakage to competing disposal channels, and position compliant renderers for potential subsidies or preferential zoning approvals. As governments tighten landfill levies and expand producer-responsibility schemes, the rendered poultry products market gains structural support.
Surge in Insect-Protein and Blended Feed Solutions
Feed formulators are blending traditional rendered meals with insect meal to capture complementary amino acid profiles and microbiome benefits. Trials integrating black soldier fly larvae up to 10% of broiler diets lifted carcass yield and improved cecal microbial balance while maintaining cost competitiveness. Rather than displacing poultry meal, insects extend protein inventories, smoothing price spikes, and enabling reduced soybean meal inclusion. Renderers are partnering with insect producers to market co-formulated premixes that leverage existing logistics networks and nutritional expertise, broadening addressable revenue streams without cannibalizing core products.
Restraints Impact Analysis*
| Restraint | (~) % Impact on CAGR Forecast | Geographic Relevance | Impact Timeline |
|---|---|---|---|
| Stringent odor-emission regulations near urban areas | −0.7% | Global, concentrated in developed markets | Short term (≤ 2 years) |
| Volatility of global soybean meal prices | −0.5% | Global commodity markets | Medium term (2-4 years) |
| Consumer perception issues around by-product ingredients | −0.4% | Premium market segments globally | Long term (≥ 4 years) |
| Rising logistics costs for cold-chain compliance | −0.3% | Global, temperature-sensitive products | Medium term (2-4 years) |
| Source: Mordor Intelligence | |||
Stringent Odor-Emission Regulations Near Urban Areas
Governments are expanding exclusion zones and mandating odor management plans for rendering sites located near residential districts. Pennsylvania’s Odor Management Program requires new concentrated animal facilities to submit approved mitigation strategies and install best-practice equipment. Compliance often entails biofilters, enclosed conveying, and continuous monitoring that lift capital budgets and raise per-unit processing costs. Smaller operators without access to low-interest financing struggle to keep pace, which could trigger consolidation and localized processing shortfalls during the adjustment window.
Rising Logistics Costs for Cold-Chain Compliance
Many rendered fats and specialty meals travel under controlled temperatures to preserve oxidative stability and pathogen control. The Global Cold Chain Alliance’s updated best-practice guide sets stringent sanitation and temperature auditing expectations that require insulating packaging, IoT monitors, and trained carriers. Fuel price inflation and container shortages elevate freight charges, eroding export margins to distant markets such as Southeast Asia. Operators counteract by co-locating processing and end-use facilities or adopting shelf-stable formulations, yet the near-term drag on profitability remains notable.
*Our forecasts treat driver/restraint impacts as directional, not additive. The impact forecasts reflect baseline growth, mix effects, and variable interactions.
Segment Analysis
By Product Type: Refined Fat Drives Premium Growth
Poultry meal captured 40.3% of the rendered poultry products market size in 2024, making it the single-largest contributor to overall revenue. Strong demand from mainstream feed mills and integrated poultry processors keeps volume stable even when commodity protein prices fluctuate. The segment benefits from well-established supply chains, standardized quality specifications, and favorable amino acid profiles that simplify feed formulation. Crude poultry fat follows in scale, supporting boilers, commercial fryers, and cost-sensitive feed rations where caloric density overrides purity considerations. Hydrolyzed feather meal and blood meal together satisfy specialized aquaculture and fertilizer niches that prize high protein density and keratin-rich amino acids.
Refined poultry fat is projected to grow at the fastest 7.7% CAGR through 2030 as renewable diesel blenders and premium pet food brands reward low-impurity grades with price premiums. Investments in in-line quality sensors and digital traceability platforms allow processors to certify nutrient consistency and origin, helping them lock in multi-year supply agreements with the high-margin nutrition segment. Thermal hydrolysis trials improve nutrient yield from mixed by-products. This blurs traditional boundaries between protein and fat recovery. The result is a tiered portfolio where basic commodities bankroll continuous operations while premium fractions secure upside in volatile markets.


By Process Type: Dry Rendering Retains Scale as Wet Rendering Builds Momentum
Dry rendering held 62.0% of rendered poultry products market share in 2024, reflecting its long operating history, broad raw-material tolerance, and compatibility with the high-volume animal feed channel. The technology relies on direct heat and mechanical pressing to separate proteins from fats, delivering predictable yields that suit mainstream feed mills looking for stable amino acid profiles. Continuous cooker upgrades, improved odor-capture hoods, and automated screw presses have extended the lifecycle of dry plants even as environmental rules tighten. Many integrated poultry processors keep dry systems running around the clock, leveraging proximity to slaughter operations to minimize raw-material spoilage and truck mileage.
Wet rendering is forecast to post a 6.6% CAGR through 2030, driven by processors that target premium pet food and aquafeed grades requiring higher digestibility and lighter color. By suspending by-products in water and using lower temperatures, wet systems limit Maillard reactions, preserve heat-sensitive amino acids, and cut odor emissions. Early adopters combine wet separation with low-temperature drying to maximize protein recovery while meeting stricter neighborhood air-quality limits. Grant programs tied to circular-economy goals and reduced greenhouse-gas footprints help offset upfront costs, shortening payback periods for new installations. As more buyers request traceable, gently processed meals, plants that can toggle between dry and wet modes gain flexibility to service both high-volume commodity and high-margin specialty markets.
By Application: Pet Food Premiumization Drives Growth
Animal feed applications dominated with 72.5% of the poultry products market share in 2024, underscoring the pivotal role rendered proteins play in livestock and aquaculture diets. The segment’s stability stems from cost-efficient amino acid delivery, well-established distribution links, and its ability to buffer nutritionists from soybean meal price swings. Aquafeed manufacturers are increasingly substituting fishmeal with poultry meal to cut ingredient costs and meet sustainability targets, benefiting from specialized low-ash grades that boost digestibility for carnivorous species. These dynamics ensure that animal feed remains the baseline volume driver even as downstream markets diversify.
Pet food is the fastest-growing application and is projected to post a 7.2% CAGR through 2030, expanding its slice of the poultry products market size in North America, Europe, and parts of Asia. Premium brands reward suppliers that deliver batch-level traceability, low-impurity profiles, and functional benefits tied to joint, skin, and gut health. Renderers are installing in-line sensors and blockchain platforms to validate nutrient consistency, helping lock in multi-year contracts with high-margin pet food manufacturers. As households continue to humanize their pets, spending on specialized diets rises steadily, allowing processors to capture higher returns than those available in commodity feed channels.
Geography Analysis
North America generated 36.5% of global revenue in 2024, supported by dense poultry production clusters, extensive rendering collection networks, and a mature premium pet food sector that values domestically sourced, traceable proteins. United States pet owners spend steadily on functional diets, encouraging renderers to invest in in-line quality checks and digital traceability that meet brand-owner audits. Canada’s updated food safety regulations raise microbiological standards, pushing plants to adopt closed-loop systems and continuous sampling. Mexico’s rising poultry output expands raw-material supply, but uneven cold-chain coverage and zoning hurdles slow capacity additions, keeping regional supply tight.
Asia-Pacific is the fastest-growing region at a 6.1% CAGR, driven by a young demographic profile, climbing disposable incomes, and dietary shifts toward animal protein. Rabobank forecasts suggest regional poultry production will rise 4% to 5% annually through 2030, unlocking abundant raw material for rendering[3]Source: Rabobank, “Global Poultry Quarterly Q1-2025,” rabobank.com. China accelerates upgrades to integrate food safety and environmental controls, opening niches for joint ventures that transfer wet-rendering know-how. India liberalizes livestock feed regulations, spurring domestic demand for cost-effective protein concentrates. Southeast Asian nations such as Thailand and Vietnam capture processing investments due to export-focused poultry clusters, while Indonesia and the Philippines explore public-private partnerships to build centralized rendering hubs that reduce biosecurity risks.
Europe maintains steady growth anchored in circular-economy directives that favor valorization of animal by-products into feed and pet nutrition inputs. The Corporate Sustainability Reporting Directive compels downstream buyers to disclose scope-three emissions, rewarding suppliers that document carbon footprints and resource efficiency. Germany and France subsidize odor-reduction retrofits, helping renderers meet strict neighborhood standards without relocating. The United Kingdom invests in R & D aimed at enzymatic processing that raises protein availability and lowers energy use, while Eastern European countries expand collection routes to capture underutilized raw streams. Collectively, these policies underscore the region’s emphasis on documented sustainability and product safety.

Competitive Landscape
The top companies collectively hold a significant share of global revenue, highlighting an oligopolistic structure complemented by regional specialists and cooperative plants associated with poultry slaughterhouses. Darling Ingredients operates numerous processing facilities worldwide and leverages vertical integration to ensure feedstock continuity, supporting substantial revenue across feed ingredients and renewable energy products[4]Source: Darling Ingredients Inc., “Form 10-K 2024,” sec.gov. Tyson Foods combines poultry slaughter, pet food, and fats refining, enabling internal consumption of rendered outputs and minimizing third-party exposure. JBS USA Holdings, Cargill, and Smithfield Foods employ similar integration, using rendering to extract value from primary meat operations and hedge commodity cycles.
Strategy now centers on demonstrating safety, transparency, and nutritional consistency rather than competing purely on cost. Leading firms deploy advanced compositional analyzers, blockchain-based batch records, and third-party certification programs to meet the strict sourcing policies of premium pet food and aquafeed brands. Partnerships with enzymatic-processing startups help tailor protein functionality for species-specific diets, while pilot projects explore low-temperature drying and recycled-water systems that shrink environmental footprints. Mid-tier cooperatives focus on regional dominance, optimizing raw-material collection radii and offering just-in-time deliveries to nearby feed mills.
Merger activity targets bolt-on rendering assets adjacent to expanding poultry complexes, especially in South Asia and South America, where infrastructure gaps still exist. Regulatory agencies view rendering as an environmental service and generally approve deals that improve waste management, though they monitor regional price effects. Market entrants differentiate through niche specialization, supplying customized hydrolyzed meals for hypoallergenic pet diets or high-lysine concentrates for shrimp feed. Overall, competitive success hinges on combining operational scale with agile product innovation to satisfy increasingly discerning animal nutrition customers.
Rendered Poultry Products Industry Leaders
Tyson Foods, Inc.
JBS USA Holdings Inc. (JBS Foods)
Cargill, Incorporated.
Darling Ingredients
West Coast Reduction Ltd.
- *Disclaimer: Major Players sorted in no particular order

Recent Industry Developments
- June 2025: The Kerala government plans to establish chicken waste rendering plants under public sector management to replace the existing public-private partnership (PPP) model units that face community protests and operational challenges. These facilities will process poultry waste, including feathers, into feed-grade powder for pet food and animal nutrition. The initiative receives support from Clean Kerala, Kudumbashree, and Suchitwa Mission.
- April 2025: Indian Poultry Alliance (Allana Group) acquired Kwality Animal Feeds Pvt Ltd for INR 300 crore (USD 36 million). The acquisition included integrated poultry operations with rendering facilities that produce poultry fat and protein meals for feed and pet food manufacturing.
- January 2024: Darling Ingredients Inc. acquired the Miropasz Group for EUR 110 million (USD 119.04 million). The acquisition included three poultry rendering facilities in Poland with a combined annual processing capacity of 250,000 metric tons of poultry by-products.
- January 2024: The USDA Food Safety and Inspection Service set January 1, 2028, as the universal compliance date for new meat and poultry labeling regulations, providing renderers with long-range planning clarity.


Global Rendered Poultry Products Market Report Scope
Rendered Poultry Products are the processed by-products of poultry, including meat, bones, fat, and offal, which are converted through rendering into stable, high-protein meals (like poultry meal, blood meal, feather meal) and fats. These products, which are used in animal feed and pet food, fall under this scope. The Rendered Poultry Products Market Report is segmented by Product Type (Poultry Meal, Blood Meal, Hydrolyzed Feather Meal, Crude Poultry Fat, and Refined Poultry Fat), by Application (Animal Feed and Pet Food), by Process Type (Wet Rendering and Dry Rendering), and by Geography (North America, South America, Europe, Middle East, Asia-Pacific, and Africa). The market forecasts are provided in terms of value (USD).
| Poultry Meal |
| Hydrolyzed Feather Meal |
| Blood Meal |
| Crude Poultry Fat |
| Refined Poultry Fat |
| Animal Feed |
| Pet Food |
| Wet Rendering |
| Dry Rendering |
| North America | United States |
| Canada | |
| Mexico | |
| Rest of North America | |
| South America | Brazil |
| Argentina | |
| Rest of South America | |
| Europe | Germany |
| France | |
| United Kingdom | |
| Russia | |
| Rest of Europe | |
| Asia-Pacific | China |
| India | |
| Japan | |
| Australia | |
| Rest of Asia-Pacific | |
| Middle East | Saudi Arabia |
| United Arab Emirates | |
| Rest of Middle East | |
| Africa | South Africa |
| Egypt | |
| Rest of Africa |
| By Product Type | Poultry Meal | |
| Hydrolyzed Feather Meal | ||
| Blood Meal | ||
| Crude Poultry Fat | ||
| Refined Poultry Fat | ||
| By Application | Animal Feed | |
| Pet Food | ||
| By Process Type | Wet Rendering | |
| Dry Rendering | ||
| By Geography | North America | United States |
| Canada | ||
| Mexico | ||
| Rest of North America | ||
| South America | Brazil | |
| Argentina | ||
| Rest of South America | ||
| Europe | Germany | |
| France | ||
| United Kingdom | ||
| Russia | ||
| Rest of Europe | ||
| Asia-Pacific | China | |
| India | ||
| Japan | ||
| Australia | ||
| Rest of Asia-Pacific | ||
| Middle East | Saudi Arabia | |
| United Arab Emirates | ||
| Rest of Middle East | ||
| Africa | South Africa | |
| Egypt | ||
| Rest of Africa | ||


Key Questions Answered in the Report
What is the projected size of the rendered poultry products market in 2030?
The rendered poultry products market size is forecast to reach USD 8.65 billion by 2030, growing at a 3.6% CAGR.
Why is Asia-Pacific considered the most attractive growth region?
Asia-Pacific is forecasted to post a 6.1% CAGR through 2030 driven by rapid poultry production growth, expanding feed ingredient imports, and investments in rendering infrastructure.
What are the main challenges facing renderers today?
Key restraints include stringent odor-control regulations, soybean meal price volatility, consumer skepticism toward by-products in premium segments, and rising cold-chain logistics costs.
How concentrated is the competitive landscape?
The top five companies command roughly 62% of global revenue, implying a moderately concentrated but still competitive environment.
Page last updated on:


