
Market Overview
| Study Period | 2021 - 2031 |
|---|---|
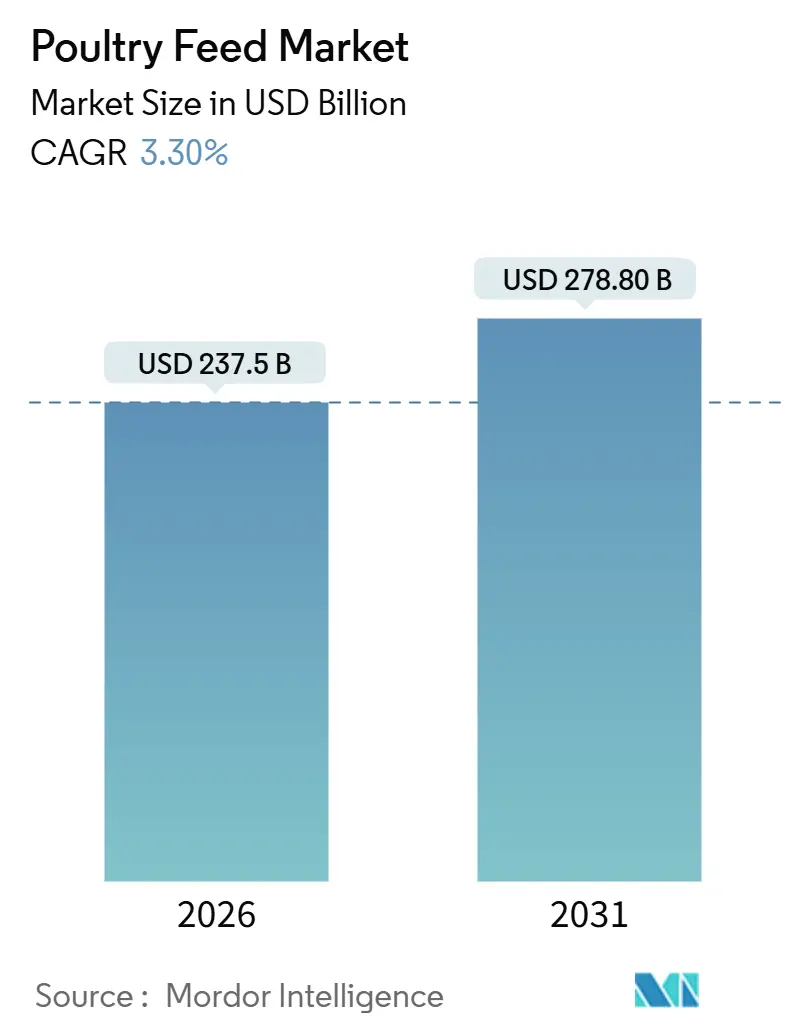
| Market Size (2026) | USD 237.5 Billion |
| Market Size (2031) | USD 278.80 Billion |
| Growth Rate (2026 - 2031) | 3.30% CAGR |
| Fastest Growing Market | Asia Pacific |
| Largest Market | Asia Pacific |
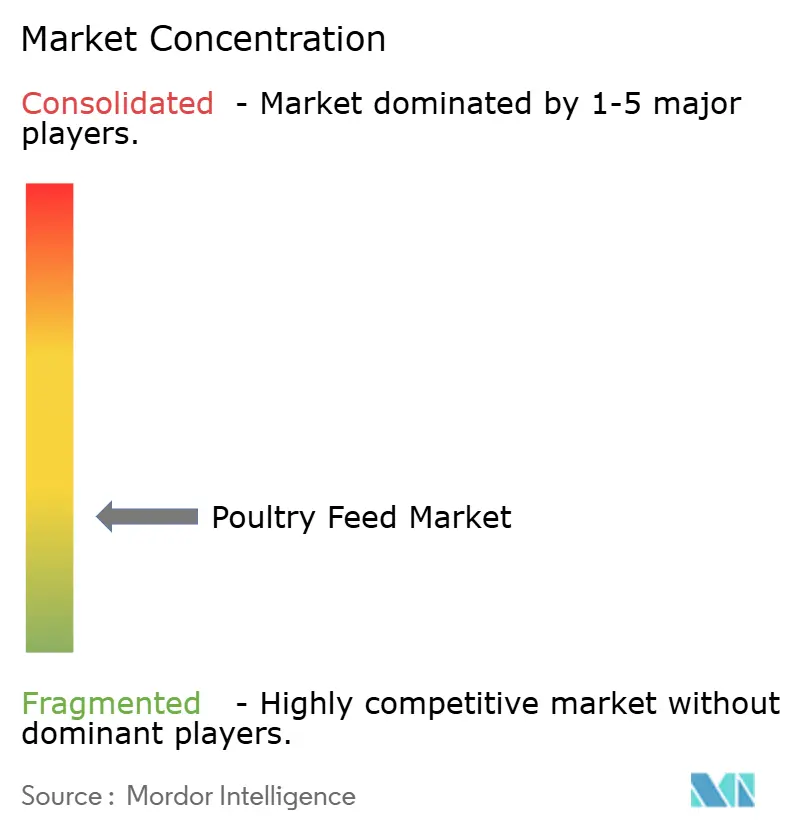
| Market Concentration | Low |
Major Players
*Disclaimer: Major Players sorted in no particular order Image © Mordor Intelligence. Reuse requires attribution under CC BY 4.0. |
|
Poultry Feed Market Analysis by Mordor Intelligence
The poultry feed market size reached USD 237.5 billion in 2026 and is projected to rise to USD 278.8 billion by 2031, reflecting a 3.3% CAGR during the forecast period. Growth continues to be shaped by rising poultry meat demand in emerging economies, ingredient price volatility that squeezes mill margins, and regulatory mandates that eliminate antibiotic growth promoters in favor of enzymes, probiotics, and phytogenics. Formulators are also coping with the need to diversify protein sources as soybean supplies tighten and as insect meal gains regulatory traction. Competitive intensity is increasing because regional millers and vertically integrated processors continue to dominate local supply, even as multinationals invest in automation and precision nutrition. Long-term opportunity lies in Asia-Pacific, Africa, and the Middle East, where rapid urbanization and cold-chain expansion are elevating per-capita chicken consumption.
Key Report Takeaways
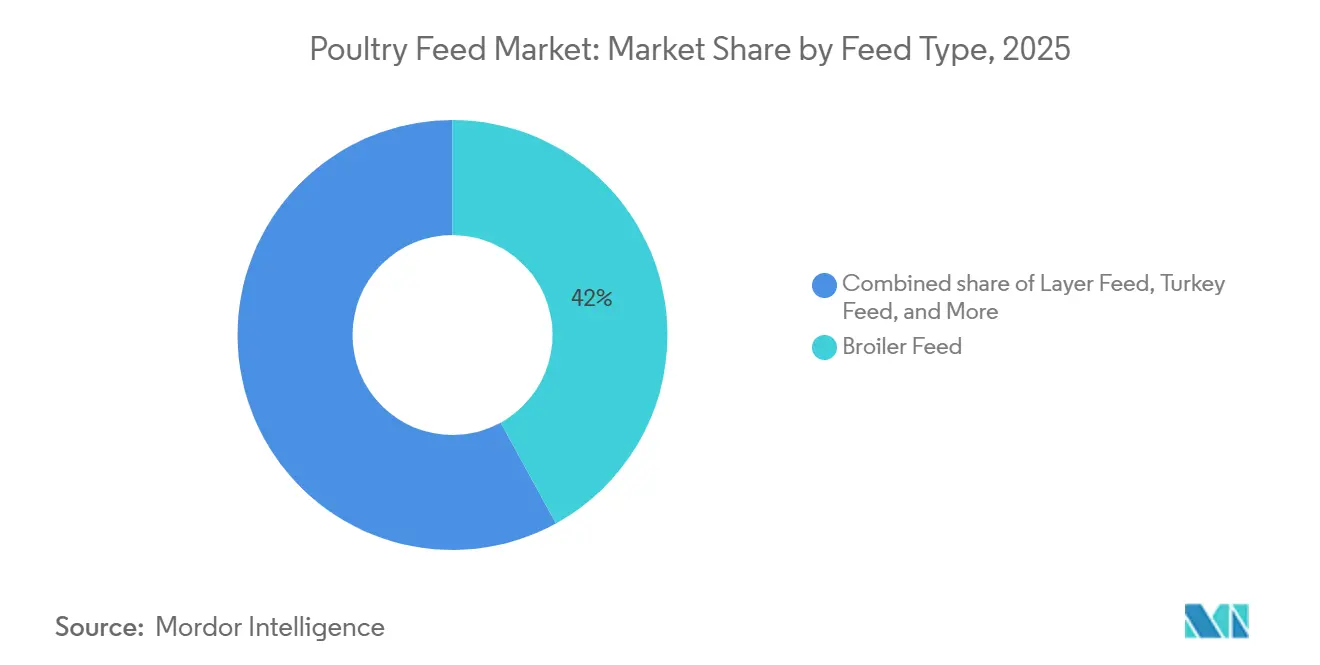
- By feed type, broiler feed led with 42% poultry feed market share in 2025, while turkey feed is forecast to expand at a 6.2% CAGR through 2031.
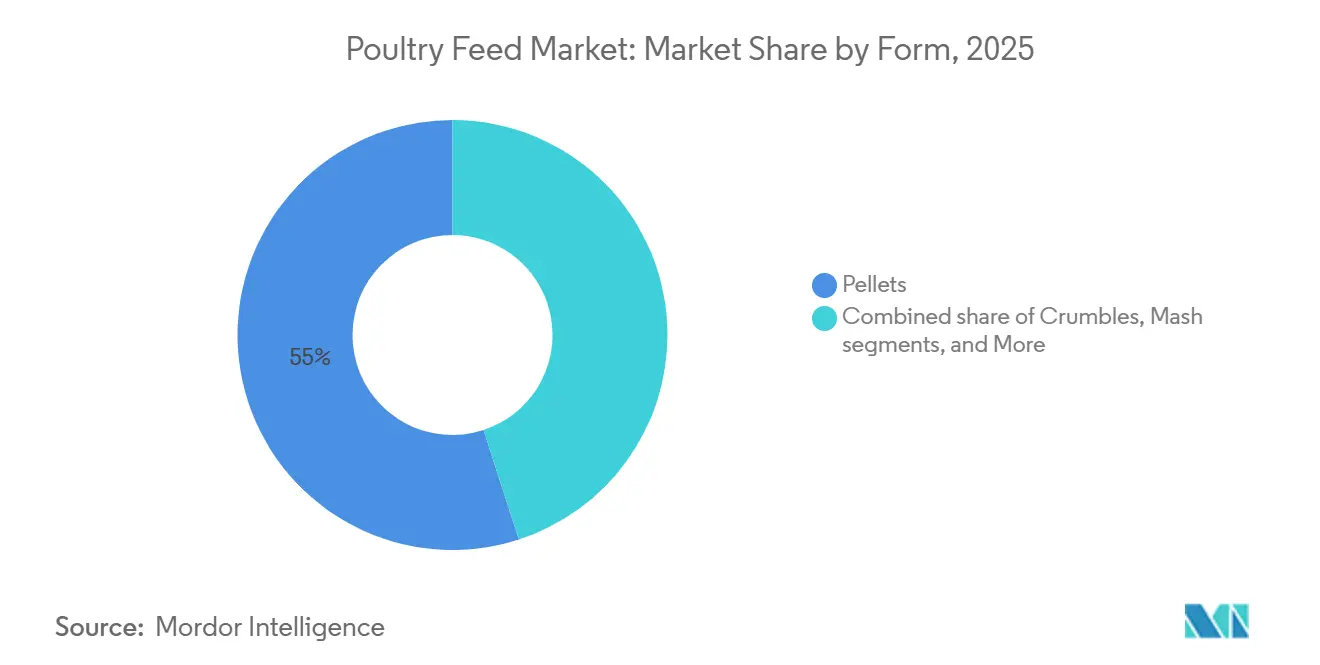
- By form, pellets commanded 55% share of the poultry feed market size in 2025, crumbles are projected to grow at a 5.0% CAGR to 2031.
- By ingredient type, cereals accounted for 36% share of the poultry feed market size in 2025, whereas additives are advancing at an 8.4% CAGR through 2031.
- By geography, Asia-Pacific held 32% revenue share in 2025 and is projected to expand at a 4.6% CAGR through 2031.
Note: Market size and forecast figures in this report are generated using Mordor Intelligence’s proprietary estimation framework, updated with the latest available data and insights as of January 2026.
Global Poultry Feed Market Trends and Insights
Drivers Impact Analysis*
| Driver | (~) % Impact on CAGR Forecast | Geographic Relevance | Impact Timeline |
|---|---|---|---|
| Rising global poultry meat consumption | +1.2% | Global, highest in Asia-Pacific, Africa, Middle East | Medium term (2-4 years) |
| Industrialization of poultry farming in emerging economies | +0.9% | Asia-Pacific core, spill-over to Africa and Middle East | Long term (≥ 4 years) |
| Advancements in feed additives improving feed conversion ratio | +0.7% | North America and European Union lead, adoption spreading to Asia-Pacific | Medium term (2-4 years) |
| Stringent safety regulations pushing adoption of compound feed | +0.5% | European Union, North America, select Asia-Pacific markets | Short term (≤ 2 years) |
| Growing interest in insect protein inclusion to mitigate soy volatility | +0.4% | European Union pilots, Asia-Pacific scaling, Africa emerging | Long term (≥ 4 years) |
| Expansion of on-farm micro-encapsulation technology enabling precision nutrition | +0.3% | North America and European Union early adopters, Asia-Pacific following | Long term (≥ 4 years) |
| Source: Mordor Intelligence | |||
Rising Global Poultry Meat Consumption
The global per-capita poultry meat consumption reached 17.9 kg per person in 2024, with the sharpest gains in Southeast Asia, Sub-Saharan Africa, and the Middle East [1]Source: Food and Agriculture Organization, "Poultry Sector", fao.org. In markets such as Nigeria, Egypt, and Vietnam, compound feed production lags flock growth, encouraging mill construction near integrated poultry complexes for just-in-time delivery. Urban cold-chain expansion is displacing live-bird markets and increasing demand for consistent feed quality to support chilled meat supply. The Organization for Economic Cooperation and Development projects poultry will account for 41% of global meat consumption by 2030. These demand fundamentals underpin sustained expansion of the poultry feed market, even as ingredient costs ebb and flow.
Industrialization of Poultry Farming in Emerging Economies
Integrated farms exceeding 100,000 birds represented 68% of broiler output in China and 54% in India during 2025, up sharply from 2020 levels. Such scale favors compound feed because uniform formulations support biosecurity and predictable performance. The same model is now spreading to South Africa and Nigeria, where integrators are adding automated mills with capacities above 200,000 metric tons. As retailers demand traceability, smallholders that once mixed on-farm rations lose ground. The World Bank anticipates industrial poultry to reach 75% of emerging-market production by 2030, further concentrating demand with professional buyers.
Advancements in Feed Additives Improving Feed Conversion Ratio
Phytase and protease lowered average broiler feed conversion, cutting feed cost per bird by roughly USD 0.02 at current ingredient prices. Probiotics such as Bacillus subtilis reduce gut pathogens and mortality by up to 2 percentage points, while organic acids replace antibiotic growth promoters in Europe and North America. The global feed enzyme segment is forecast to grow 8.1% a year through 2031, far faster than core feed volume, as formulators redirect spending to performance enhancers. These developments reinforce margin upside for suppliers that can validate additive efficacy.
Stringent Safety Regulations Pushing Adoption of Compound Feed
The European Union Feed Hygiene Regulation, effective January 2024, requires Hazard Analysis and Critical Control Points certification, a hurdle beyond the reach of informal mixers [2]Source: European Commission, "Feed Hygiene Regulation", ec.europa.eu. Similar standards in Japan, South Korea, and Australia tighten import controls and enforce pathogen reduction. In the United States, new salmonella rules mandate validated heat or chemical treatments for feed containing animal-derived ingredients. Codex Alimentarius guidelines on residue limits are now harmonized across 85 countries, effectively creating a global safety benchmark. Large compound mills that invested early in automation and traceability now enjoy a structural advantage, lifting the overall quality floor of the poultry feed market.
Restraints Impact Analysis*
| Restraint | (~) % Impact on CAGR Forecast | Geographic Relevance | Impact Timeline |
|---|---|---|---|
| Volatile raw material prices | -0.8% | Global, highest in import-dependent Middle East, North Africa, Southeast Asia | Short term (≤ 2 years) |
| Disease outbreaks | -0.5% | Asia-Pacific, Europe, North America cyclical hotspots | Short term (≤ 2 years) |
| Regulatory scrutiny on antimicrobial resistance restricting antibiotic growth promoters | -0.3% | European Union, North America, expanding to Asia-Pacific | Medium term (2-4 years) |
| Competing alternative proteins dampening long-term demand | -0.2% | United States, Singapore early markets, European Union and Asia-Pacific following | Long term (≥ 4 years) |
| Source: Mordor Intelligence | |||
Volatile Raw Material Prices
Corn traded between USD 4.20 and USD 5.80 per bushel during 2024-2025, while soybean meal swung from USD 380 to USD 520 per metric ton, driven by weather and demand shocks [3]Source: United States Department of Agriculture, “Livestock and Poultry: World Markets and Trade,” usda.gov. Import-dependent markets such as Egypt and the Philippines face amplified costs when local currencies weaken against the dollar. Millers that lock in fixed-price contracts three to six months ahead risk margin squeeze when spot prices spike. Substituting wheat and barley for up to 30% of corn offers some relief, but futures markets for these grains remain thin in Asia. Elevated working-capital needs further pressure balance sheets during volatile periods. The absence of sophisticated hedging tools in Africa and parts of Asia leaves producers exposed, tempering near-term growth in the poultry feed market.
Regulatory Scrutiny on Antimicrobial Resistance Restricting Antibiotic Growth Promoters
The European ban on antibiotic growth promoters, widened in 2022 to cover medically important drugs, has been mirrored by gradual restrictions in North America and China. India is drafting similar rules for 2026. Replacing antibiotics with enzymes, probiotics, and organic acids adds 15-25% to additive cost per metric ton of feed. Smaller mills lacking research capacity struggle to validate alternatives, losing share to multinationals. Farmers accustomed to antibiotics must invest in better housing and biosecurity, raising production costs. While the shift enhances food safety, it tempers growth for producers unable to pass along higher formulation expenses.
*Our forecasts treat driver/restraint impacts as directional, not additive. The impact forecasts reflect baseline growth, mix effects, and variable interactions.
Segment Analysis
By Feed Type: Broiler Feed Dominance Anchors Volume, Turkey Feed Captures Premium Growth
Broiler feed generated 42% of 2025 value as broiler meat production climbed to 110 million metric tons, reinforcing the centrality of broilers to the poultry feed market size. Growth in North America and Europe has plateaued, yet double-digit volume gains in South Asia and Sub-Saharan Africa keep global demand expanding. Turkey feed contributed lower share but is set to grow at a 6.2% CAGR, reflecting higher protein inclusion and rising seasonal demand in the United States and export markets. Layer feed accounted for a significant share, benefiting from steady table-egg demand and bakery usage, while other species such as duck and quail formed a niche. Antibiotic-free reformulation across all sub-segments increases additive intensity, boosting margins for specialty suppliers.
Turkey feed commands higher prices because starter diets require 24-28% crude protein compared with 21-23% for broilers, giving formulators latitude to incorporate insect meal and organic trace minerals. Premiumization trends in developed economies support turkey’s health positioning, while Middle Eastern and Mexican imports enlarge its geographic footprint. Layer and specialty bird formulations also emphasize gut-health additives to enhance egg quality, creating cross-segment synergies. The ongoing shift toward vertically integrated production ensures that large integrators dictate feed specifications, consolidating volume with fewer, technologically advanced mills within the poultry feed market.



By Form: Pellets Lead on Efficiency, Crumbles Gain in Specialty Diets
Pellets captured 55% of 2025 value, favored for 5-8% higher digestibility and reduced wastage versus mash, thereby reinforcing their dominance in the poultry feed market share. Durability now exceeds 92% in modern facilities, cutting fines that contribute to respiratory issues. Asia-Pacific integrators spearhead pellet adoption to offset land and labor constraints. Crumbles held a significant share and are growing at a CAGR of 5.0% annually because the smaller particle size improves early chick intake and lowers mortality in layer pullets.
Mash feed maintained some share, mainly in backyard and organic systems that favor minimal processing. Although mash costs USD 20-30 less per metric ton, higher feed conversion and wastage offset the savings. Extruded and expanded products formed the remaining share and cater to game birds and specialty applications. Flexible pellet-mill dies allow producers to switch between pellets and crumbles, enhancing asset utilization and inventory management. As integrators invest in automated barns, demand for uniform pellet quality will intensify, sustaining pellet leadership within the poultry feed market.
By Ingredient Type: Cereals Anchor Formulations, Additives Command Growth Premium
Cereals, led by corn and wheat, accounted for 36% of ingredient spending in 2025, underscoring their role as the energy backbone of the poultry feed market size. Wheat dominates in Europe and Australia, while corn prevails in the Americas and Asia because of lower landed cost. Nonetheless, climatic volatility encourages trials of sorghum and millet to diversify risk. Oilseed meals, largely soybean, delivered 30% of ingredient value, but sustainability concerns in South American supply chains raise procurement premiums for certified deforestation-free lots.
Additives comprised of significant value and are expanding at 8.4% annually, reflecting enzyme and probiotic inclusion that offsets the antibiotic withdrawal mandated by regulators. Methionine and lysine supplementation lets formulators dial back crude protein, cutting nitrogen excretion and meeting environmental targets. Fish meal fell as algae-based omega-3 sources gain traction. Molasses and miscellaneous binders made up the remaining, playing functional roles in pellet durability and palatability. The rising cost of soybean meal accelerates the search for insect protein and synthetic amino acids, lifting additive share within the poultry feed market.
Geography Analysis
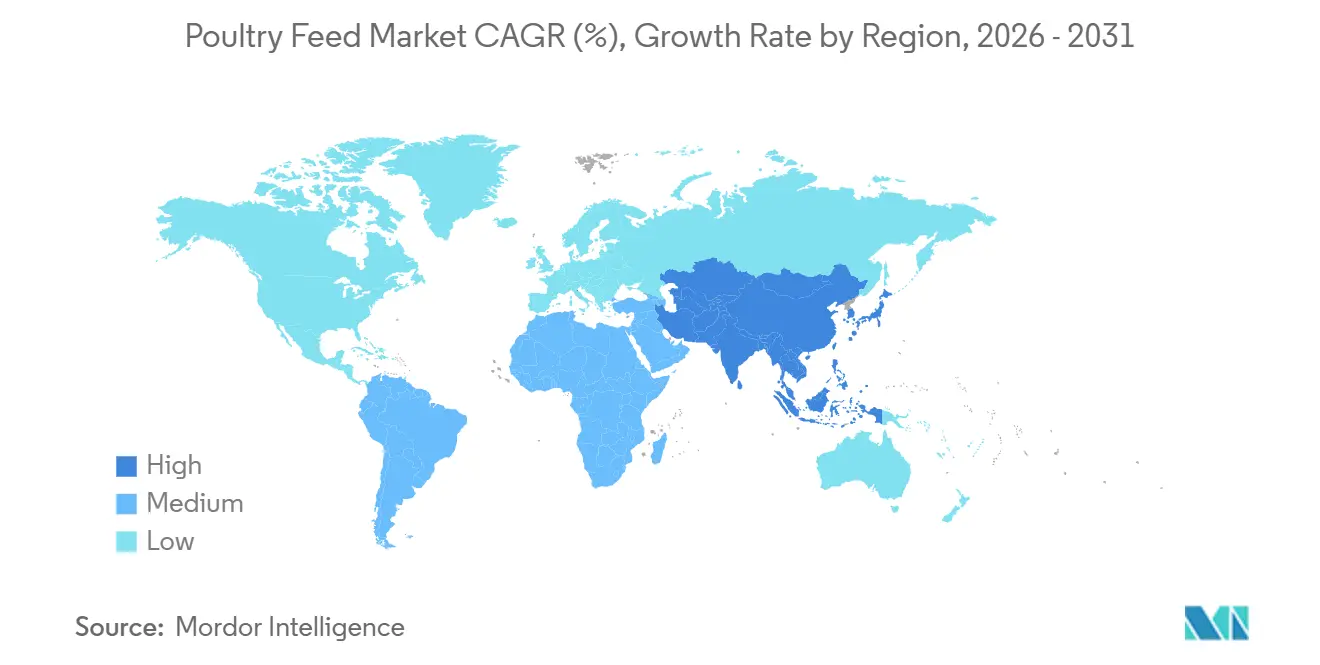
Asia-Pacific generated 32% of poultry feed market revenue in 2025 and is on track for a 4.6% CAGR through 2031, powered by China’s production capacity and India’s rapid shift to organized poultry farming. China’s top ten producers raised their share of national output to 35% in 2025 from 22% in 2020, favoring large compound mills. India consumed 28 million metric tons of feed, yet the sector remains fragmented among 5,000 mills that compete on price, creating scope for consolidation. Japan and South Korea lead regional adoption of antibiotic-free formulations, boosting specialty additive imports, while Thailand, Vietnam, and Indonesia invest in high-capacity mills exceeding 500,000 metric tons.
Africa recorded a significant CAGR, driven by the demand in Nigeria and Egypt's growing poultry sector. Nigeria’s sector is modernizing, but infrastructure gaps in electricity and logistics constrain efficiency. South Africa counters cheap Brazilian imports by upgrading feed conversion and vertical integration. The Middle East is also growing, supported by Saudi and Emirati subsidies for ingredient imports and integrated farming. South America expands but remains exposed to currency swings that affect export profitability.
Europe and North America reflect maturity and stringent environmental caps that limit flock expansion. The European Union Farm to Fork strategy halves antimicrobial use by 2030, driving enzyme utilization. The United States, a major poultry feed producer, pivots to slower-growing genetics and cage-free layers, altering feed specs. Russia advances on import substitution, while Oceania grows by targeting Asian export markets. Diverging growth trajectories confirm that emerging regions will sustain long-term expansion of the poultry feed market.

Regulatory Landscape
Feed regulation is tightening around safety systems, additive authorizations, and trade documentation, which is raising compliance requirements for poultry feed manufacturers and ingredient importers. In Canada, the Feeds Regulations, 2024 (published July 3, 2024) replaced the 1983 rules, modernizing safety, approval, and labeling requirements under the Canadian Food Inspection Agency framework and pushing more formal controls across commercial feed.
In the European Union, the European Commission continues to manage additive approvals under Regulation (EC) No 1831/2003, with multiple 2026 actions that include authorizations for 6-phytase preparations (for poultry and other species) and authorization of guanidinoacetic acid (Evonik Operations GmbH) for various poultry species. Trade-facing rules also remain active, including Commission Implementing Regulation (EU) 2026/472 (effective February 23, 2026), which amended representative prices and additional import duties for poultrymeat and egg products. Indonesia's Ministry of Trade Regulation No. 11/2026 (effective May 8, 2026) also expands import licensing to feed-grade commodities, including soybean meal and wheat, adding administrative steps and timing risk for ingredient procurement.
Competitive Landscape
Two-thirds of poultry feed market revenue is in the hands of regional millers, on-farm mixers, and vertically integrated processors, reflecting high logistics costs for bulky feed. The market remains fragmented, with major manufacturers such as Cargill, Charoen Pokphand Foods, and New Hope Liuhe utilizing captive mills to maintain margins across breeding, nutrition, and processing, thereby mitigating exposure to spot ingredient price volatility. Mid-sized specialists focus on differentiation through proprietary enzyme blends and on-farm consulting services, enabling them to command premium pricing in markets where producers prioritize technical support.
The additive sub-segment is more concentrated with multinationals controlling over 50% of the global enzyme and methionine supply, giving them negotiation leverage with compounders. Technology reshapes competition as precision nutrition platforms adjust formulations in real time based on flock data, and blockchain pilots enhance traceability from grain origin to finished feed. A 2024 patent filing for an algorithm that predicts enzyme inclusion rates underlines how digital tools become new competitive moats.
Smaller regional players counter by forming procurement cooperatives to secure bulk discounts and by white-labeling additives from multinational suppliers. White-space opportunities include antibiotic-free solutions for smallholders in Asia and Africa and scaling insect protein once approvals expand. Over the next five years, capital investment and digital capabilities will separate cost leaders from commoditized producers within the poultry feed market.
Poultry Feed Industry Leaders
-
New Hope Liuhe Co. Ltd
-
Charoen Pokphand Foods Public Co. Ltd
-
Land O’Lakes Inc
-
Guangdong HAID Group Co. Ltd
-
Cargill, Incorporated
- *Disclaimer: Major Players sorted in no particular order

Market Opportunities and Future Outlook
Antibiotic-free production mandates and broader feed safety rules are shifting value toward measurable performance additives and documented quality systems. This creates room for enzyme, probiotic, organic acid, and traceability-linked service offerings, particularly where smaller mills struggle with validation and certification. EU additive approvals in 2026, including new or renewed authorizations for phytase preparations and guanidinoacetic acid, provide more direct pathways for commercial adoption of productivity and nutrient-utilization tools in poultry diets and support higher additive intensity in compound feed formulations.
Supply-chain resilience and alternative protein sourcing are also opening whitespace in regions with higher import exposure to corn and soybean meal volatility, alongside markets pursuing local protein strategies. In July 2026, the European Commission adopted an EU Protein Plan and EU Livestock Strategy targeting higher EU-grown protein crop usage in feed by 2035, supporting reformulation workstreams around local protein crops and circular ingredients. Investments across the poultry value chain further reinforce demand for consistent, high-spec compound feed, including Sunrise Farms' announced CAD 100.5 million poultry processing investment in Woodstock, Ontario (May 2026) and MBRF's BRL 1 billion program in Parana, Brazil (March 2026), both of which increase the need for stable feed supply, documented inputs, and integrator-aligned nutrition programs.
Recent Industry Developments
- April 2026: The International Finance Corporation (IFC) disclosed a proposed loan of up to USD 150 million to New Hope Singapore to expand feed production capacity across Vietnam, Egypt, Bangladesh, Cambodia, and Nepal. The program targets capacity additions and supply-chain localization in emerging poultry and livestock corridors, strengthening New Hope-linked milling footprints where ingredient price and availability risks are elevated.
- October 2025: De Heus India inaugurated a new animal feed manufacturing facility in Rajpura with an investment of about USD 17 million and an initial capacity of 180,000 metric tons per year, expandable to 240,000 metric tons. The plant adds dedicated poultry feed lines with modern process controls, increasing regional availability of compound feed for organized poultry production clusters in North India.
- July 2024: Canada published the Feeds Regulations, 2024 in the Canada Gazette Part II, replacing the 1983 framework and modernizing feed safety, approvals, and labeling. The update raises baseline compliance expectations for commercial feed and premix suppliers selling into Canada and encourages broader adoption of structured quality and traceability systems.


Research Methodology Framework and Report Scope
Market Definition and Coverage
This market covers the value of formulated feed sold for poultry production, including complete feeds and concentrates that are used across commercial bird-rearing systems and small-scale farms. The sizing counts feed used for key poultry categories and the common feed forms used in the industry.
Scope exclusions: On-farm grain used without commercial formulation, live bird sales, and poultry meat and egg sales are not counted in this market value.
Segmentation Overview
-
By Feed Type
- Broiler Feed
- Layer Feed
- Turkey Feed
- Other Poultry Feed
-
By Form
- Pellets
- Crumbles
- Mash
- Others
-
By Ingredient Type
- Cereals
- Oilseed Meal
- Molasses
- Fish Oil and Fish Meal
- Additives
- Other Ingredient Types
-
By Geography
-
North America
- United States
- Canada
- Mexico
- Rest of North America
-
South America
- Brazil
- Argentina
- Chile
- Rest of South America
-
Europe
- Germany
- United Kingdom
- France
- Italy
- Spain
- Russia
- Rest of Europe
-
Asia-Pacific
- China
- India
- Japan
- Australia
- South Korea
- Rest of Asia-Pacific
-
Middle East
- Saudi Arabia
- United Arab Emirates
- Rest of Middle East
-
Africa
- South Africa
- Egypt
- Rest of Africa
-
North America
Data Sources, Market Sizing, and Validation
Desk Research
Desk research was used to build the factual base for poultry production, feed demand drivers, and commodity linkages before the market model was set. We referenced public data sources such as FAOSTAT for poultry numbers and output, USDA for grains and oilseeds balance sheets, and UN Comtrade for trade direction checks on key feed ingredients and premix flows.
To keep inputs realistic for each region, we also reviewed industry and regulatory signals, including European Commission publications on feed and animal health rules, and materials from groups like the International Feed Industry Federation plus national feed bodies. These inputs were then supported with company filings, investor presentations, annual reports, and reputable press coverage, along with selective use of paid subscriptions for company financials and intelligence. Where it helped confirm supply availability, we also used patent databases and shipment-level import and export data. The sources listed here are illustrative, and many other public and paid references were consulted for data collection, validation, and clarification.
Primary Interviews and Surveys
Primary work was completed through expert interviews and structured surveys with feed mill leaders, poultry integrators, additive suppliers, distributors, and domain specialists across the value chain. Because this is a global market, we balanced viewpoints across APAC, EMEA, and the Americas to pressure-test demand signals, pricing behavior, and how formulation shifts (for example, enzyme use or alternative proteins) change value over time.
Distribution of primary research fieldwork respondents
| Company type | Respondent position | Region |
|---|---|---|
| Top tier: 33% | CXOs: 13% | APAC: 44% |
| Mid tier: 47% | Functional/Unit leaders: 33% | EMEA: 32% |
| Smaller Players: 20% | Managers: 54% | Americas: 24% |
Market-Sizing & Forecasting
Market sizing starts with a top-down build where poultry bird inventory and production volumes are translated into feed consumption using region-specific feed conversion patterns and typical feed intake by bird type, and then converted into value using observed pricing ranges for key forms (pellets, crumbles, mash). To keep the totals practical, the outputs are then checked using selective bottom-up approximations, such as rolling up sampled feed mill sales, applying ASP times volume logic for representative product baskets, and validating channel feedback on mix and discounting.
A few inputs that matter in this market were treated as explicit model drivers, including poultry population trends, broiler versus layer mix shifts, corn and soybean meal price movements, the share of additives in formulations, and changes in import dependency for grains and oilseed meals. Forecasting is done using scenario analysis that combines these drivers with expert views on pricing pass-through and production cycles, and then the model is adjusted when a variable trend breaks historical patterns. Where bottom-up visibility is limited in smaller countries, gap handling is done through per-bird feed intensity benchmarks and trade proxy checks, followed by a conservative normalization before regional totals are finalized.
Data Validation & Update Cycle
Validation is handled through multiple checks so that one data stream does not drive the answer on its own. We compare the modeled feed demand and value against independent signals like poultry production changes, feed ingredient price series, and trade patterns, and then investigate any outliers that appear too large for the known supply chain capacity.
Before sign-off, the work goes through analyst reviews that re-check assumptions, currency conversions, and the consistency of regional splits. When a material event happens, such as a sudden disease impact, a major regulatory shift, or a sharp commodity shock, we re-contact sources and re-run the affected parts of the model. Reports are refreshed annually, and a final pre-delivery review is done so the client receives the most recent view available.
Mordor Intelligence's Poultry Feed Market Size Compared With Other Published Estimates
Published market sizes for poultry feed do not always match because each publisher draws the market boundary in its own way and then applies different price and volume assumptions. We see the biggest spread when the year used as the anchor is different, when feed additives are bundled more broadly, or when the conversion from poultry production to feed demand is handled with less direct validation.
Feed ingredient price series, poultry production volumes, and trade direction checks are the evidence points that keep Mordor Intelligence's estimate tied to a defined feed demand pool and to a practical pricing envelope, before the final total is signed off.
Benchmark comparison
| Source | Market Size | Gaps in Research Methodology |
|---|---|---|
| Mordor Intelligence | USD 237.5 B (2026) | |
| Industry Publisher A | USD 232.9 B (2025) | Uses an earlier anchor year and a longer forecast horizon, which can shift the value if feed pricing pass-through and formulation mix are assumed smoother than what commodity cycles typically show. |
| Industry Publisher B | USD 225.2 B (2025) | Counts a broad scope with conventional and organic coverage and a wide additives lens, and the size is anchored to 2025, so differences come mainly from year selection and how additive-rich products are priced and weighted. |
Looking across the three figures, most of the gap is explained by anchor year choice and how pricing and formulation mix are treated, rather than by a totally different demand story. Using transparent demand drivers like poultry output and feed intensity, then cross-checking against ingredient price and trade signals, helps keep the final value within a repeatable and explainable range for planning.


Key Questions Answered in the Report
What is the current value of the global poultry feed market?
The poultry feed market size reached USD 237.5 billion in 2026.
Which region is growing fastest for poultry feed demand?
Asia-Pacific leads growth with a forecast 4.6% CAGR through 2031, driven by rising chicken consumption and rapid farm industrialization.
Which feed form dominates the global market?
Pellets hold 55% of 2025 revenue because of higher digestibility and lower wastage in large-scale operations.
Why are additives gaining share in poultry feed formulations?
Additives such as enzymes and probiotics replace antibiotic growth promoters and improve nutrient utilization, leading to an 8.4% annual growth rate for the segment.
How do raw material price swings affect feed manufacturers?
Volatile corn and soybean prices compress margins, especially in import-dependent regions, prompting mills to seek alternative grains and implement forward-contract strategies.
What technological trends are shaping competitive dynamics?
Precision nutrition platforms, on-farm micro-encapsulation, and blockchain traceability tools are enabling cost optimization and compliance with retailer demands.
Page last updated on:






