Recycled Lead Market Size and Share
Market Overview
| Study Period | 2021 - 2031 |
|---|---|
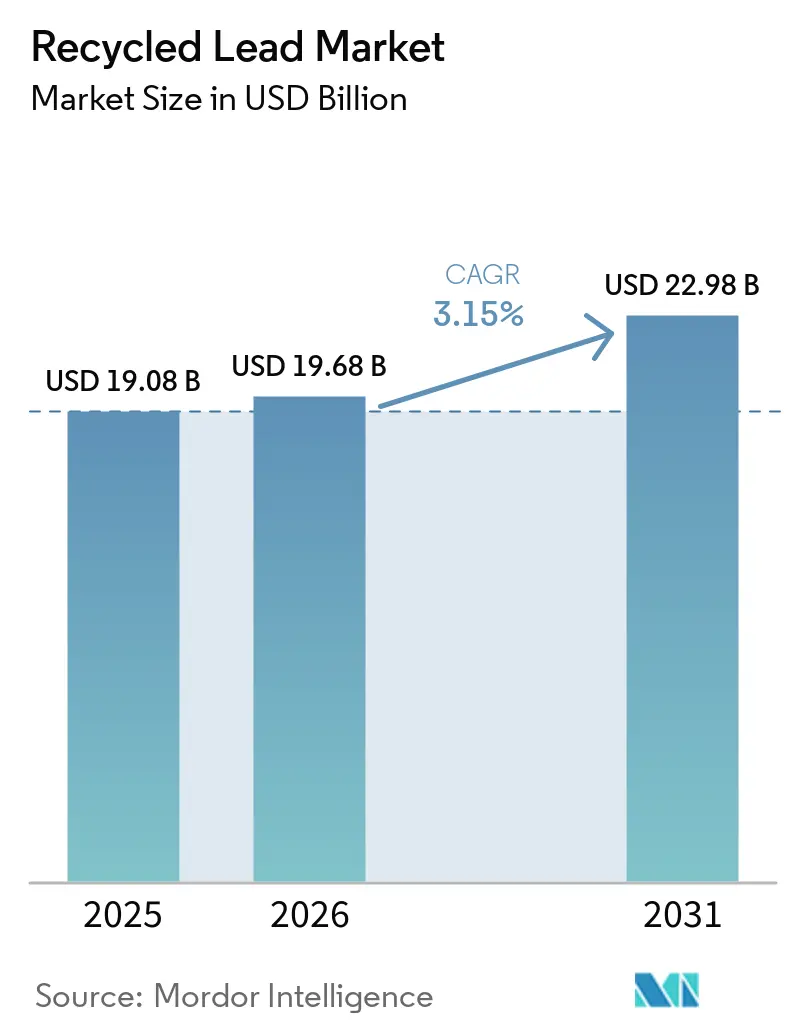
| Market Size (2026) | USD 19.68 Billion |
| Market Size (2031) | USD 22.98 Billion |
| Growth Rate (2026 - 2031) | 3.15% CAGR |
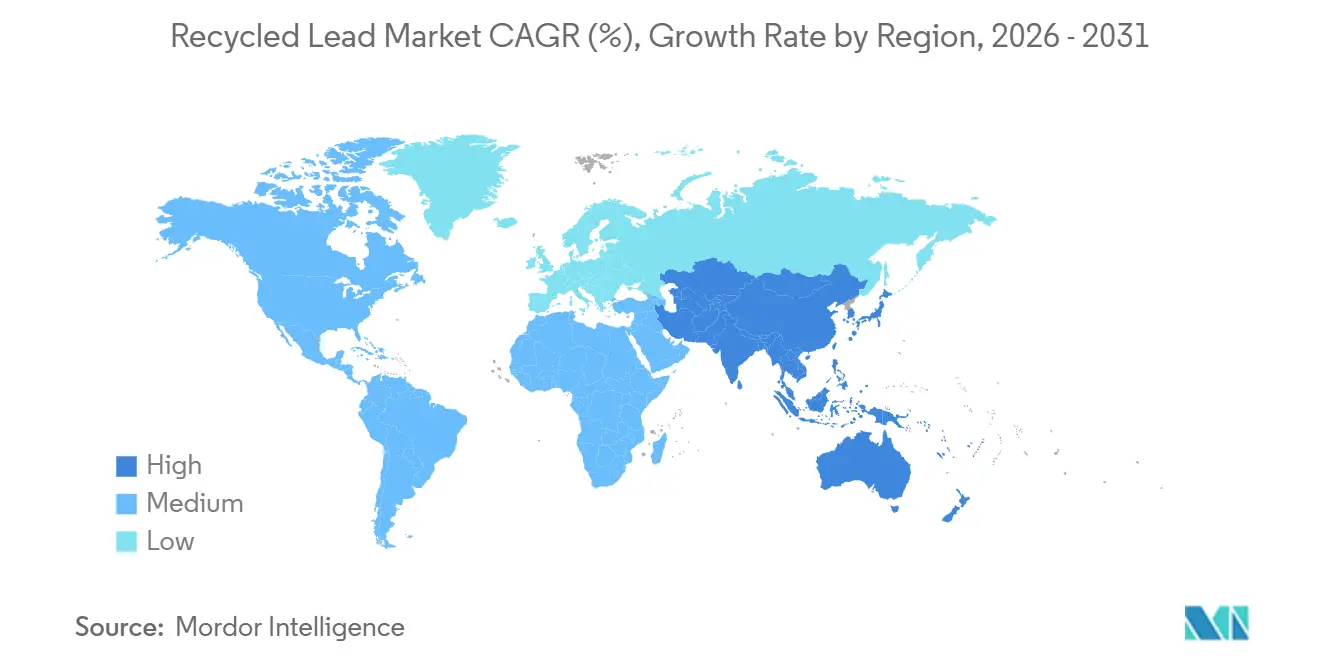
| Fastest Growing Market | Asia Pacific |
| Largest Market | Asia Pacific |
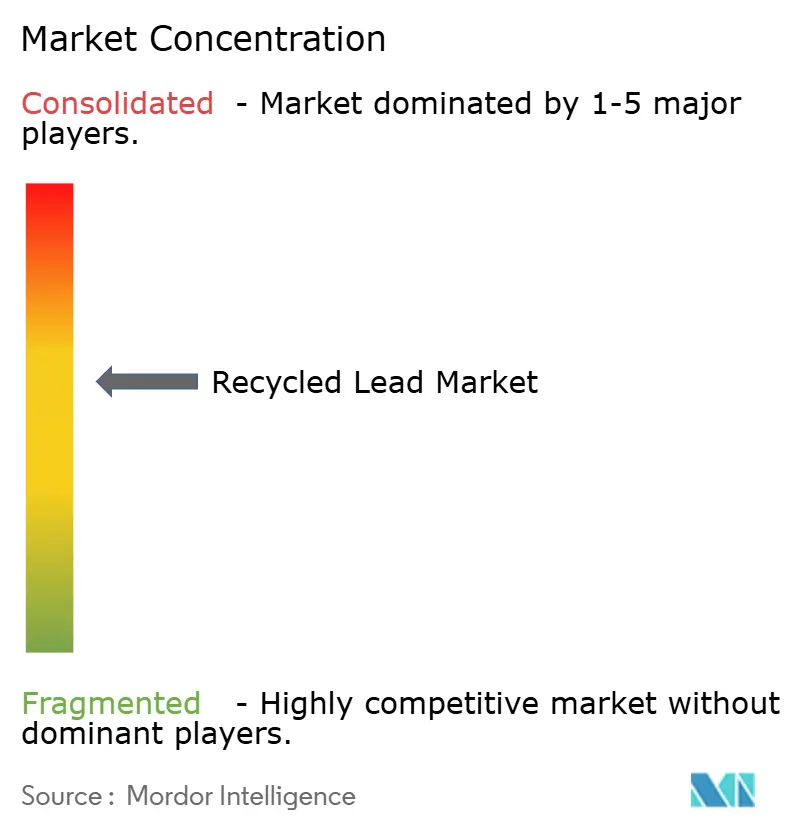
| Market Concentration | Medium |
Major Players *Disclaimer: Major Players sorted in no particular order Image © Mordor Intelligence. Reuse requires attribution under CC BY 4.0. | |
Recycled Lead Market Analysis by Mordor Intelligence
The Recycled Lead Market size is projected to be USD 19.08 billion in 2025, USD 19.68 billion in 2026, and reach USD 22.98 billion by 2031, growing at a CAGR of 3.15% from 2026 to 2031. Demand stems from telecom-tower backup systems, data-center UPS units, and emerging micro-mobility fleets, though longer battery lifespans and the adoption of electric vehicles partially limit volume growth. Battery manufacturers are increasingly entering long-term offtake agreements with certified recyclers to meet stricter recycled-content mandates, which helps stabilize feedstock prices in the recycled lead market. Technological advancements are altering cost structures: hydrometallurgical processes reduce sulfur-dioxide emissions and energy consumption, enabling large smelters to prepare for the European Union’s 2026 Carbon Border Adjustment Mechanism. Informal processors face regulatory challenges and credit limitations, leading to industry consolidation and strengthening the cost advantages of vertically integrated players in the recycled lead market.
Key Report Takeaways
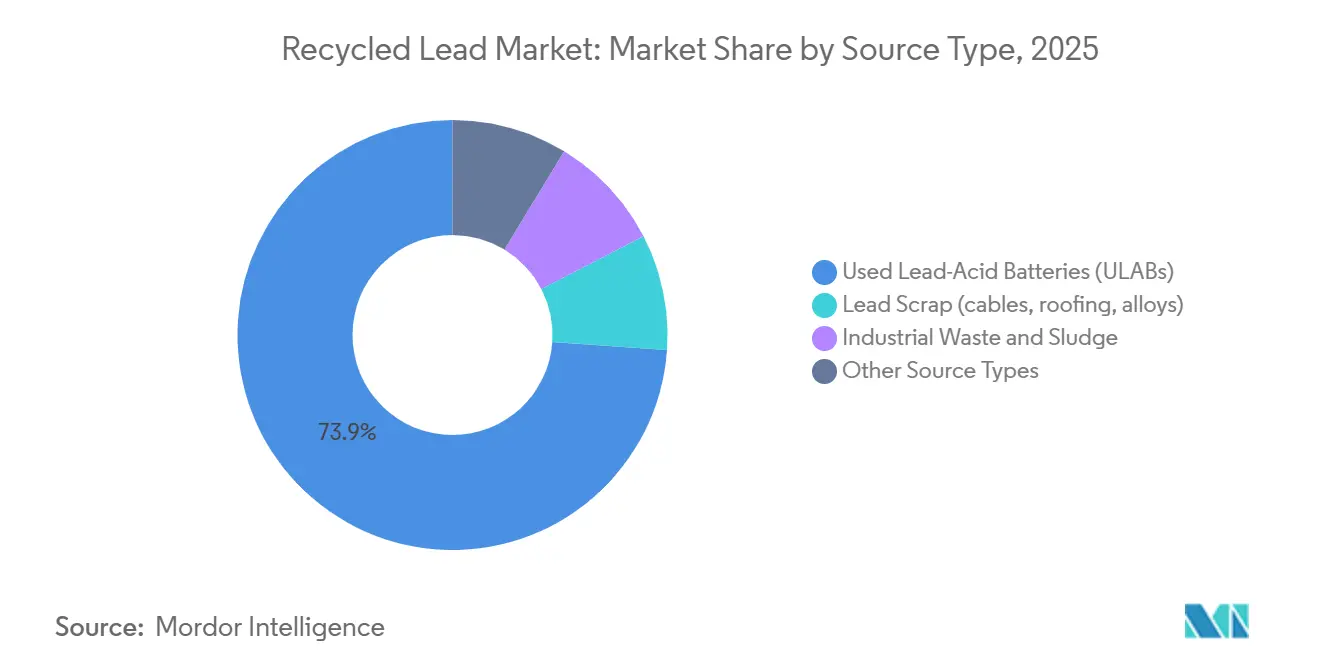
- By source type, used lead-acid batteries (ULABs) captured 73.89% of the recycled lead market share in 2025, while industrial waste and sludge is projected to expand at a 3.58% CAGR through 2031.
- By recycling method, pyrometallurgical held 63.02% of the recycled lead market share in 2025, whereas hydrometallurgical is advancing at a 3.64% CAGR through 2031.
- By form, recycled lead ingots accounted for 40.23% of the recycled lead market share in 2025, while secondary lead oxide is forecast to rise at a 4.09% CAGR through 2031.
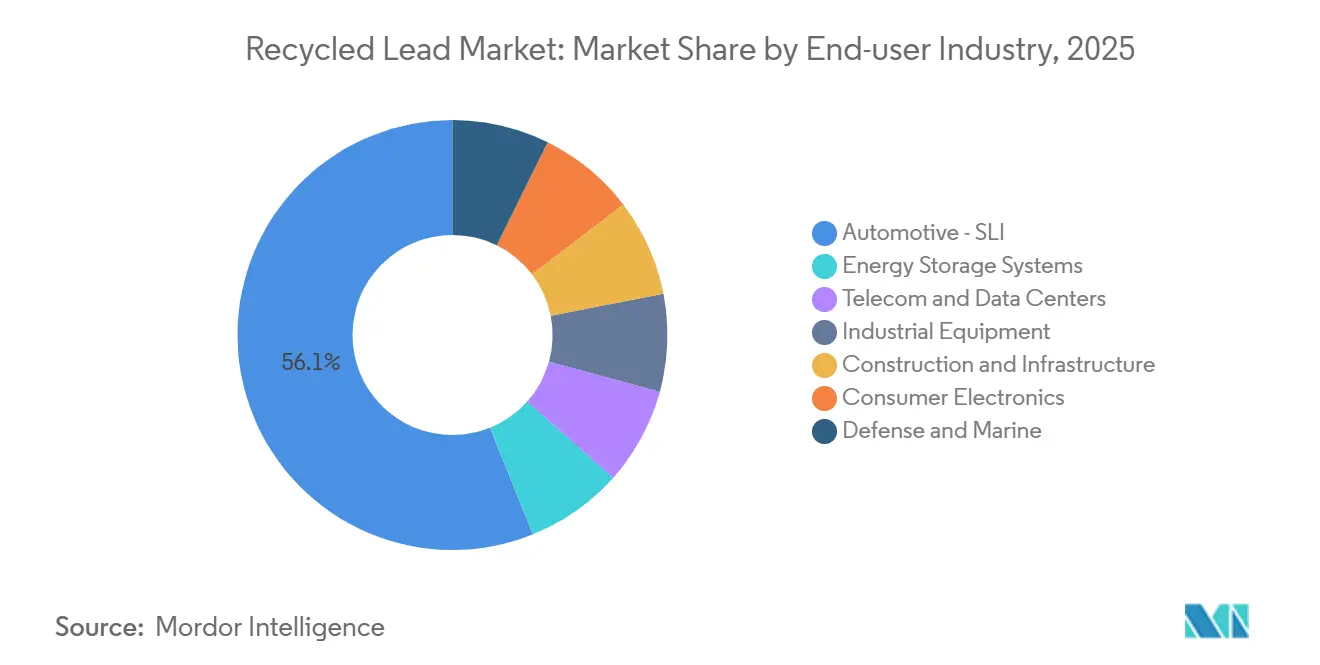
- By end-user industry, automotive – SLI (Starting, Lighting, and Ignition) led with 56.11% of the recycled lead market share in 2025, while energy storage systems are growing at a 4.02% CAGR through 2031.
- By geography, Asia-Pacific commanded 45.33% of the recycled lead market share in 2025 and is slated to grow at a 3.97% CAGR through 2031.
Note: Market size and forecast figures in this report are generated using Mordor Intelligence’s proprietary estimation framework, updated with the latest available data and insights as of January 2026.
Global Recycled Lead Market Trends and Insights
Drivers Impact Analysis*
| Driver | (~) % Impact on CAGR Forecast | Geographic Relevance | Impact Timeline |
|---|---|---|---|
| Growing demand for sustainable and circular-economy practices | +0.9% | Global, with EU and North America leading policy adoption | Medium term (2-4 years) |
| Rising use of lead-acid batteries in automotive and stationary storage | +1.1% | APAC core (India, ASEAN), spill-over to MEA | Short term (≤ 2 years) |
| Stringent EHS regulations mandating lead recovery | +0.6% | EU, North America, China (tier-1 cities) | Long term (≥ 4 years) |
| Cost advantage of secondary vs. primary lead | +0.4% | Global | Medium term (2-4 years) |
| Ramp-up of VRLA battery demand in emerging micro-mobility markets | +0.5% | India, Southeast Asia, select African urban centers | Short term (≤ 2 years) |
| Source: Mordor Intelligence | |||
Growing Demand for Sustainable and Circular-Economy Practices
Circular-economy regulations are transforming procurement strategies among automakers and industrial battery buyers. The European Union mandates manufacturers to achieve 75% collection efficiency by 2025 and 90% lead recovery by 2027, encouraging original equipment manufacturers to establish long-term supply agreements with certified recyclers. In the United States, NESHAP limits for secondary smelters increase compliance costs but improve air quality near urban facilities. Large integrated firms are adopting advanced technologies like scrubbers and electrostatic precipitators, which smaller operators cannot afford, driving consolidation in the recycled lead market. Battery manufacturers view recycled lead as a safeguard against disruptions in primary-mine supply, particularly after Indonesia and Australia restricted lead-ore exports in 2024. As a result, the recycled lead market is gaining strategic importance within the broader battery value chain.
Rising Use of Lead-Acid Batteries in Automotive and Stationary Storage
Global vehicle production surpassed 85 million units in 2024, with each internal-combustion vehicle requiring an SLI battery, maintaining baseline demand for the recycled lead market. Even battery-electric vehicles use 12-volt auxiliary packs for safety systems, ensuring the continued relevance of recycled lead. Telecom towers in India and Africa now exceed 600,000 units and rely on VRLA batteries to address unreliable grid conditions, expanding the scrap stream[1]Department of Telecommunications India, “Telecom Infrastructure Status 2025,” dot.gov.in. Data-center operators reported a 15% increase in reserve-power battery shipments in 2025, highlighting the growth of stationary storage. Recyclers benefit from VRLA scrap, which provides high-purity lead oxide with a 5%-8% price premium, boosting margins within the recycled lead market.
Stringent EHS Regulations That Mandate Lead Recovery
International agreements are aligning toward zero-landfill requirements for lead-acid batteries. The Basel Convention restricts the shipment of hazardous waste to facilities that fail to meet technical guidelines, compelling many countries to process ULABs domestically. China’s 2024 licensing framework requires closed-loop water treatment and real-time emission monitoring, pushing informal recyclers out of tier-1 cities. The European Union plans to lower worker blood-lead limits to 15 µg/100 ml by 2029, necessitating upgrades in ventilation systems and medical programs. Compliance costs, ranging from USD 2 million to USD 5 million per site, enhance the competitive position of established players. Short-term scrap shortages may arise as smaller plants exit, potentially driving up feedstock prices in the recycled lead market.
Cost Advantage of Secondary versus Primary Lead
Secondary lead production costs range from USD 1,200 to USD 1,500 per metric ton, compared to USD 1,800 to USD 2,200 for primary lead refined from ore, as ULABs arrive pre-concentrated. Pyrometallurgical recycling reduces energy consumption by approximately 35% compared to primary smelting, improving margins during stable price periods. However, a 10% decline in London Metal Exchange prices reduced smelter margins by 18% in mid-2025, highlighting the risks of price volatility. Large firms mitigate these risks through hedging or geographic diversification, while smaller recyclers scale back operations, leading to acquisitions that expand the integrated tier of the recycled lead market. These efficiencies translate into operating costs that are 30-50% lower compared to conventional smelting, depending on regional power tariffs. U.S. Geological Survey data show secondary lead supplying nearly 72% of domestic refined consumption in 2024, underscoring economic preference for recycled metal.
Restraints Impact Analysis*
| Restraint | (~) % Impact on CAGR Forecast | Geographic Relevance | Impact Timeline |
|---|---|---|---|
| Environmental and health risks in informal recycling clusters | -0.5% | South Asia, Sub-Saharan Africa, select Latin American regions | Short term (≤ 2 years) |
| Lead-price volatility squeezing smelter margins | -0.3% | Global | Medium term (2-4 years) |
| Shrinking scrap availability due to longer battery life | -0.2% | North America, Europe, developed APAC markets | Long term (≥ 4 years) |
| Source: Mordor Intelligence | |||
Environmental and Health Risks in Informal Recycling Clusters
Workers in unregulated recycling facilities in countries like India and Nigeria often record blood-lead levels exceeding 40 µg/dL, far above the World Health Organization guideline of 5 µg/dL. Effluent from these facilities contaminates irrigation channels, raising community concerns and occasionally leading to plant closures. While the Basel Convention prescribes enclosed furnaces and slag stabilization, enforcement gaps persist, enabling price undercutting that reduces margins for compliant operators. Battery manufacturers are increasingly auditing supply chains to avoid reputational risks. Upgrading informal facilities to ISO 14001 standards would cost USD 0.5–1 million per site, a financial burden many operators cannot bear, temporarily reducing scrap flows into the formal recycled lead market.
Lead-Price Volatility Squeezing Smelter Margins
Between 2024 and 2025, LME lead prices fluctuated between USD 1,950 and USD 2,450 per ton, driven by Chinese inventory cycles. Smelters, which purchase ULABs under 30- to 60-day supply contracts, face revenue losses when spot prices decline during processing. A 10% price drop can eliminate over half of the gross margin for unhedged recyclers. Integrated firms like ECOBAT and Glencore capitalize on price troughs to acquire distressed competitors, further consolidating the recycled lead market. However, price volatility deters new entrants, as it complicates cash flow modeling and investment planning.
*Our forecasts treat driver/restraint impacts as directional, not additive. The impact forecasts reflect baseline growth, mix effects, and variable interactions.
Segment Analysis
By Source Type: Used Lead-Acid Batteries (ULABs) Dominate, Industrial Waste and Sludge Rise
Used lead-acid batteries (ULABs) contributed 73.89% of the recycled lead market share in 2025, highlighting the critical role of end-of-life SLI and VRLA units in ensuring feedstock availability. Industrial waste and sludge is the fastest-growing source type, with a CAGR of 3.58% projected through 2031, driven by stricter regulations on the disposal of electronics and metal-forming residues. Expanding into sludge and factory scrap helps processors stabilize revenues against fluctuations in ULAB inflows, a strategy already being utilized by larger firms.
Industrial waste requires processes like sulfate neutralization and carbonate removal, but its high-purity oxide content is appealing to battery paste manufacturers prioritizing consistency. Aqua Metals’ AquaRefining system, which operates at room temperature, is designed for ULABs and eliminates the need for blast furnaces, reducing capital costs by approximately 30% for greenfield plants. Processors adopting blended feedstock strategies gain flexibility, supporting the long-term stability of the recycled lead market.


By Recycling Method: Pyrometallurgy Method Leads, Hydrometallurgical Method Gain Momentum
The pyrometallurgical method accounted for 63.02% of recycled lead output in 2025, as blast furnaces with capacities ranging from 50,000 to 100,000 tons per year achieve significant economies of scale. The hydrometallurgical method is expected to grow at a CAGR of 3.64% through 2031, benefiting from 40%-50% lower energy consumption and the elimination of sulfur-dioxide emissions.
The European Union’s Carbon Border Adjustment Mechanism, effective from 2026, will impose import fees on carbon-intensive metals, encouraging companies to retrofit furnaces with scrubbers or invest in low-temperature reactors. ACE Green Recycling’s modular electrochemical units, priced under USD 1 million, are designed for small operators in regions like Africa and India, potentially accelerating technology adoption. A bifurcation in technology is anticipated: high-volume plants will continue refining pyrometallurgical emissions, while new entrants are likely to adopt hydrometallurgical methods that align with ESG financing criteria, enhancing competitive diversity in the recycled lead market.
By Form: Recycled Lead Ingots Anchor Revenues, Secondary Lead Oxide Gains Traction
Recycled lead ingots accounted for 40.23% of sales in 2025, driven by demand from automotive grid manufacturers for standardized alloy inputs. Secondary lead oxide is projected to grow at a CAGR of 4.09% through 2031, supported by demand from telecom, data-center, and grid applications that require high-purity paste materials, offering a margin premium.
Manufacturers such as Clarios and EnerSys are integrating backward into oxide milling to ensure quality and traceability. Independent smelters aiming to maintain market share must certify ISO 9001 quality systems and invest in ball-mill oxidation lines. Specialty alloys for applications like radiation shielding and ammunition remain niche but command 8%-12% price premiums, providing profit diversification when ingot margins tighten. Rising purity requirements, driven by battery OEM audits under conflict-mineral rules, favor processors with strong governance frameworks in the recycled lead market.
By End-user Industry: Automotive – SLI Matures, Energy Storage Systems Accelerate
The automotive-SLI (Starting, Lighting, and Ignition) industry contributed 56.11% of revenue in 2025, supported by a global vehicle fleet exceeding 1.4 billion units. Enhanced flooded batteries used in hybrid vehicles contain up to 20% more lead, maintaining tonnage despite the rise of battery electric vehicles (BEVs). Energy storage systems are the fastest-growing segment, with a projected CAGR of 4.02% through 2031, driven by data-center construction and renewable energy storage needs.
Industrial equipment, including forklifts and mining locomotives, provides a stable but slow-growing contribution, with long asset lifespans ensuring predictable scrap availability. Defense and marine segments require rigorous chain-of-custody documentation, enabling premium pricing for certified oxide. Recyclers that balance high-volume SLI scrap with growing energy-storage feedstock can diversify earnings and reduce exposure to automotive market cyclicality. Port ground-support vehicles remain reliable sources of demand, which further supports resilience in the recycled lead market. Conversely, construction and infrastructure uses of extruded lead sheet shrink as building codes restrict heavy-metal content, although medical radiation shielding and underwater cable sheathing still warrant specialty alloys.
Geography Analysis
Asia-Pacific led the recycled lead market with 45.33% share in 2025 and is anticipated to grow at a 3.97% CAGR to 2031. China tightened emission controls in 2024, pushing informal smelters toward consolidation and favoring licensed operators capable of funding scrubbers and real-time monitoring. India’s e-rickshaw ecosystem supplies predictable VRLA scrap to recyclers such as Gravita India, while ASEAN economies offer fiscal perks for new hydrometallurgical capacity. Japan and South Korea target carbon neutrality by 2050, stimulating pilot plants that test low-carbon reactors and supporting regional technology diffusion across the recycled lead market.
In North America, collection efficiency already exceeds 99%, capping incremental volume growth. The U.S. Lead and Copper Rule revisions in 2024 forced facility retrofits that raise fixed costs but improve community air quality[2]U.S. Environmental Protection Agency, “Lead and Copper Rule Revisions 2024,” epa.gov. Canada and Mexico integrate cross-border scrap flows to buff smelter utilization, and several U.S. players are shifting into premium oxide for stationary storage that meets data-center ESG procurement rules. The recycled lead market thus balances mature collection infrastructure with evolving product-mix opportunities.
Europe’s demand is shaped by the EU Battery Regulation that embeds recycled-content thresholds into product approval pathways. Germany, France, and Italy host vertically integrated clusters where ECOBAT and Campine co-locate collection and smelting, securing economies of density. Russia’s export restrictions shift demand to domestic and North African recyclers, diversifying supply.
South America, and Middle-East and Africa combined for a lower share in 2025. Brazil’s 40 million-vehicle fleet supplies significant ULAB volumes, yet informal yards persist outside major metros. Data-center expansion in the United Arab Emirates and Saudi Arabia stimulates VRLA imports that will transition into scrap later this decade, adding a regional growth vector to the recycled lead market.

Competitive Landscape
The recycled lead market is moderately concentrated, with the five largest firms including Glencore, ECOBAT, Clarios, Gravita India, and Exide Industries. Vertical integration dominates strategy. Glencore couples primary mining and secondary smelting, blending concentrates and scrap to optimize furnace throughput. ECOBAT operates proprietary collection networks across Europe and North America, lowering inbound logistics costs that smaller rivals cannot replicate.
Technology innovators challenge incumbents. Aqua Metals holds several U.S. patents on ambient-temperature AquaRefining modules that eliminate blast furnaces, cutting capital outlays while raising metal purity. ACE Green Recycling offers container-sized electrochemical units aimed at small operators in Africa and India, encouraging distributed capacity growth where grid power is unreliable. Incumbents counter by investing in carbon capture and low-NOx burners to meet future policy thresholds.
Geographic arbitrage intensifies competition. Indian and Indonesian recyclers export refined metal to high-cost markets, although Basel Convention regulations and import tariffs constrain volumes. Lead-price volatility compresses margins, motivating larger firms to hedge and smaller ones to seek buyouts, a cycle that incrementally tightens capacity control within the recycled lead market.
Recycled Lead Industry Leaders
Clarios
ECOBAT
EXIDE INDUSTRIES LTD.
Glencore
Gravita India Ltd.
- *Disclaimer: Major Players sorted in no particular order

Recent Industry Developments
- April 2026: The European Commission unconditionally approved Clarios' acquisition of three lead recycling plants from ECOBAT. The acquisition included three secondary lead recycling smelters located in Germany (Braubach and Freiberg) and Austria (Arnoldstein).
- June 2025: Recyclekaro, an India-based lithium-ion battery recycling company, launched a direct-to-consumer platform named ReLoop to simplify the process of recycling e-waste. This initiative contributed to the recycling lead market by promoting efficient recovery and reuse of materials from discarded batteries.


Global Recycled Lead Market Report Scope
Recycled lead is a highly sustainable metal, with over 99% of lead-acid batteries being recycled, primarily due to its economic value. The recycling process involves dismantling old batteries, smelting the lead plates, and refining them into new battery-grade ingots. This method reduces carbon emissions by 72% and consumes 75% less energy compared to mining, meeting nearly half of the global lead demand.
The Recycled Lead Market is segmented into source type, recycling method, form, end-user industry, and geography. By source type, the market is segmented into used lead-acid batteries (ULABs), lead scrap (cables, roofing, alloys), industrial waste and sludge, and other source types. By recycling method, the market is segmented into pyrometallurgical, hydrometallurgical, electrochemical, and other recycling methods. By form, the market is segmented into recycled lead ingots, recycled lead alloys, secondary lead oxide, and other forms. By end-user industry, the market is segmented into automotive – SLI (starting, lighting, and ignition), energy storage systems, telecom and data centers, industrial equipment, construction and infrastructure, consumer electronics, and defense and marine. The report also covers the market size and forecasts for recycled lead in 17 countries across major regions. For each segment, the market sizing and forecasts have been done on the basis of value (USD).
| Used Lead-Acid Batteries (ULABs) |
| Lead Scrap (cables, roofing, alloys) |
| Industrial Waste and Sludge |
| Other Source Types |
| Pyrometallurgical |
| Hydrometallurgical |
| Electrochemical |
| Other Recycling Methods |
| Recycled Lead Ingots |
| Recycled Lead Alloys |
| Secondary Lead Oxide |
| Other Forms |
| Automotive – SLI (Starting, Lighting, and Ignition) |
| Energy Storage Systems |
| Telecom and Data Centers |
| Industrial Equipment |
| Construction and Infrastructure |
| Consumer Electronics |
| Defense and Marine |
| Asia-Pacific | China |
| India | |
| Japan | |
| South Korea | |
| ASEAN Countries | |
| Rest of Asia-Pacific | |
| North America | United States |
| Canada | |
| Mexico | |
| Europe | Germany |
| United Kingdom | |
| France | |
| Italy | |
| Spain | |
| Russia | |
| NORDIC Countries | |
| Rest of Europe | |
| South America | Brazil |
| Argentina | |
| Rest of South America | |
| Middle-East and Africa | Saudi Arabia |
| South Africa | |
| Rest of Middle-East and Africa |
| By Source Type | Used Lead-Acid Batteries (ULABs) | |
| Lead Scrap (cables, roofing, alloys) | ||
| Industrial Waste and Sludge | ||
| Other Source Types | ||
| By Recycling Method | Pyrometallurgical | |
| Hydrometallurgical | ||
| Electrochemical | ||
| Other Recycling Methods | ||
| By Form | Recycled Lead Ingots | |
| Recycled Lead Alloys | ||
| Secondary Lead Oxide | ||
| Other Forms | ||
| By End-user Industry | Automotive – SLI (Starting, Lighting, and Ignition) | |
| Energy Storage Systems | ||
| Telecom and Data Centers | ||
| Industrial Equipment | ||
| Construction and Infrastructure | ||
| Consumer Electronics | ||
| Defense and Marine | ||
| By Geography | Asia-Pacific | China |
| India | ||
| Japan | ||
| South Korea | ||
| ASEAN Countries | ||
| Rest of Asia-Pacific | ||
| North America | United States | |
| Canada | ||
| Mexico | ||
| Europe | Germany | |
| United Kingdom | ||
| France | ||
| Italy | ||
| Spain | ||
| Russia | ||
| NORDIC Countries | ||
| Rest of Europe | ||
| South America | Brazil | |
| Argentina | ||
| Rest of South America | ||
| Middle-East and Africa | Saudi Arabia | |
| South Africa | ||
| Rest of Middle-East and Africa | ||


Key Questions Answered in the Report
What is the size of the recycled lead market?
The recycled lead market stands at USD 19.68 billion in 2026 and is projected to reach USD 22.98 billion by 2031.
Which source type dominated revenue in 2025?
Used lead-acid batteries (ULABs) contributed 73.89% of revenue in 2025.
Why is the hydrometallurgical method expanding fastest through 2031?
The hydrometallurgical method is expanding at a 3.64% CAGR through 2031 as plants demonstrate 40%-50% lower energy use and meet upcoming EU carbon tariffs.
Why is Asia-Pacific the fastest-growing region through 2031?
Stricter Chinese emission rules, India’s e-rickshaw boom, and ASEAN tax incentives together lift Asia-Pacific recycled lead demand at a 3.97% CAGR through 2031.
Page last updated on:


