Copper Market Size and Share
Market Overview
| Study Period | 2020 - 2031 |
|---|---|
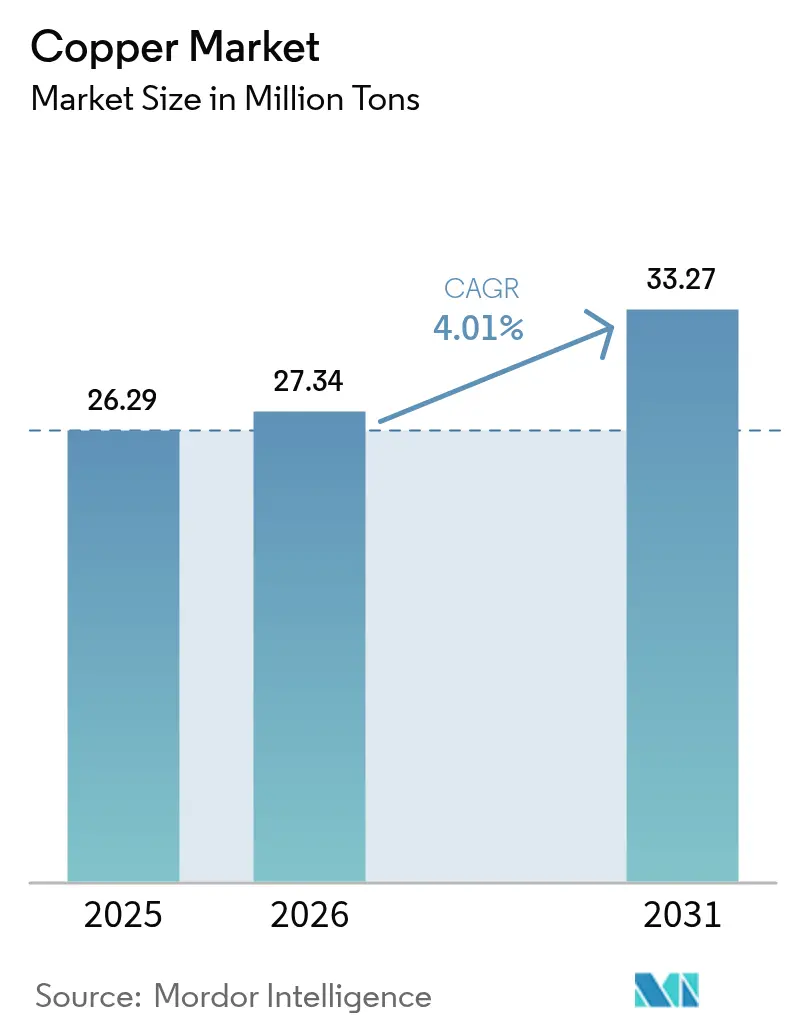
| Market Volume (2026) | 27.34 Million tons |
| Market Volume (2031) | 33.27 Million tons |
| Growth Rate (2026 - 2031) | 4.01% CAGR |
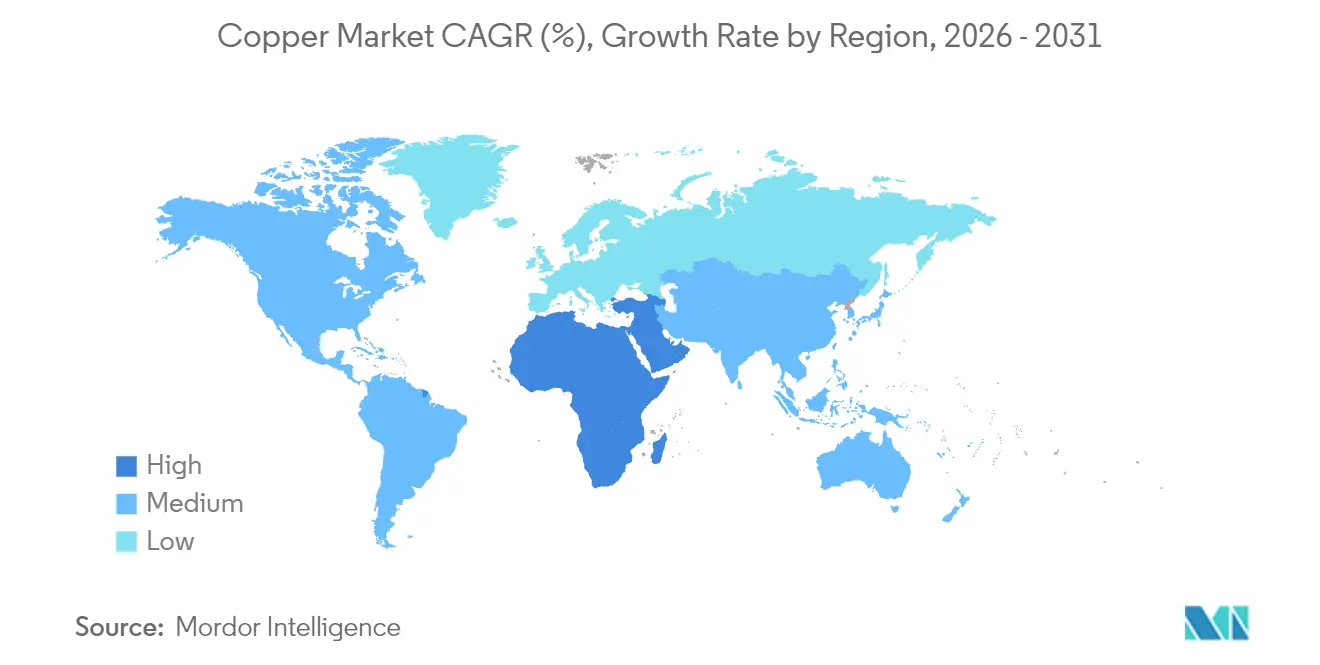
| Fastest Growing Market | Middle East and Africa |
| Largest Market | Asia-Pacific |
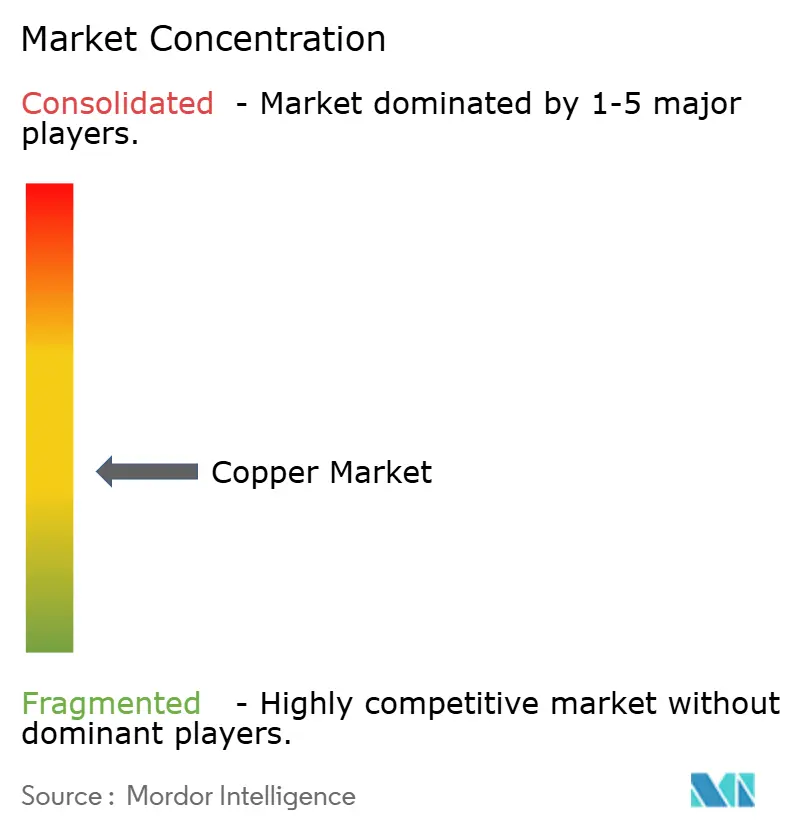
| Market Concentration | Medium |
Major Players *Disclaimer: Major Players sorted in no particular order Image © Mordor Intelligence. Reuse requires attribution under CC BY 4.0. | |
Copper Market Analysis by Mordor Intelligence
Copper Market size in 2026 is estimated at 27.34 million tons, growing from 2025 value of 26.29 million tons with 2031 projections showing 33.27 million tons, growing at 4.01% CAGR over 2026-2031. This expansion is shaped by structural electrification trends, the fivefold copper intensity of renewable-energy projects, and grid-modernization programs that collectively strain an already tight supply pipeline. Heightened demand from electric vehicles, data-center construction, and smart-city rollouts is pushing miners to accelerate brownfield expansions even as ore grades fall. Recycling’s energy-efficiency advantages and lower carbon footprint make secondary supply economically and reputationally attractive to utilities, automakers, and electronics manufacturers seeking resilient procurement options. The copper market also navigates price swings triggered by speculative trading and tariff uncertainty, prompting manufacturers to lock in long-term contracts or diversify toward scrap feedstock when hedging options appear costly.
Key Report Takeaways
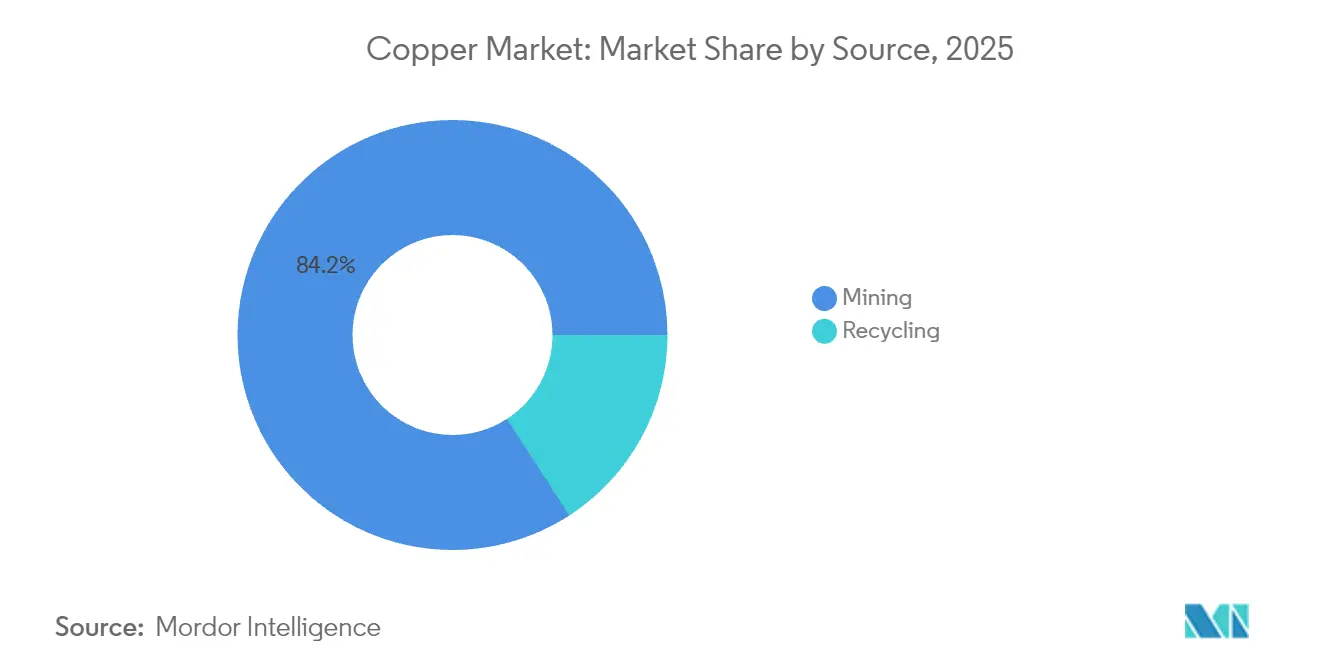
- By source, mining accounted for 84.15% of the Copper market share in 2025, while recycling is projected to post the fastest 5.42% CAGR through 2031.
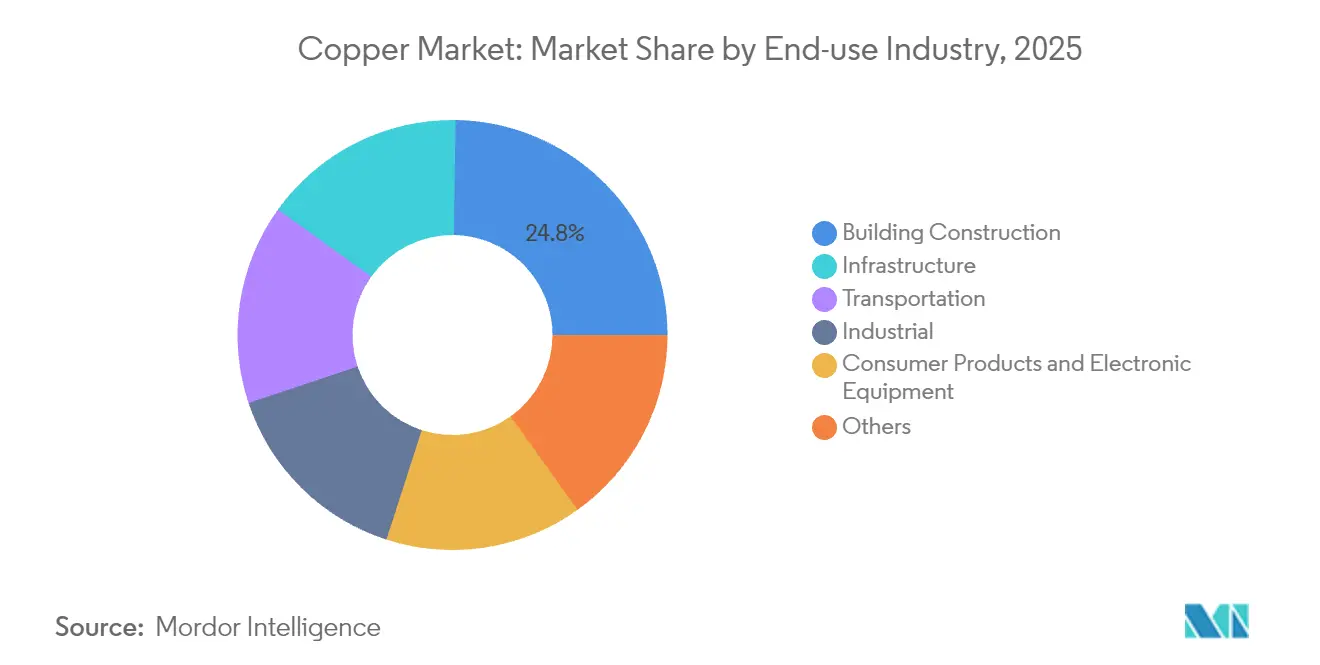
- By end-use industry, building construction led with 24.78% revenue share in 2025; infrastructure applications are advancing at a 4.44% CAGR to 2031.
- By geography, Asia-Pacific dominated with 70.30% of the Copper market share in 2025, whereas the Middle East & Africa segment is forecast to grow at a 5.21% CAGR through 2031.
Note: Market size and forecast figures in this report are generated using Mordor Intelligence’s proprietary estimation framework, updated with the latest available data and insights as of 2026.
Global Copper Market Trends and Insights
Drivers Impact Analysis*
| Driver | (~) % Impact on CAGR Forecast | Geographic Relevance | Impact Timeline |
|---|---|---|---|
| Expanding Demand from Renewable Energy and Grid Electrification | +1.2% | Global, with concentration in China, EU, North America | Medium term (2-4 years) |
| Rapid Growth in EV Copper Intensity | +0.9% | APAC core, spill-over to North America and Europe | Medium term (2-4 years) |
| Urban Infrastructure Expansion in Emerging Markets | +0.7% | Asia-Pacific, Middle East & Africa, Latin America | Long term (≥ 4 years) |
| HVDC Submarine Cables for Offshore Wind | +0.4% | Europe, Asia-Pacific coastal regions | Long term (≥ 4 years) |
| Antimicrobial Copper Adoption in Healthcare | +0.2% | Global, with early adoption in developed markets | Short term (≤ 2 years) |
| Source: Mordor Intelligence | |||
Expanding Demand from Renewable Energy and Grid Electrification
A single megawatt of wind or solar capacity demands roughly five times the copper used in conventional generation, turning renewable build-outs into the strongest structural pull on the copper market. A 3 MW onshore turbine requires 4.7 short tons of copper, while a 1 MW solar array consumes 5.5 short tons. Transmission upgrades magnify the effect because High Voltage Direct Current (HVDC) links draw thousands of tons each, and grid-strengthening programs run in parallel on every continent. China’s State Grid investment plan and Europe’s cross-border offshore-wind backbones exemplify multi-year procurement cycles that add predictable volume to the copper market[1]International Energy Agency, “Electricity Grids and Raw Materials,” iea.org.
Rapid Growth in EV Copper Intensity
Battery-electric cars average 183 lb of copper versus 51 lb in internal-combustion models, making electrified transport a 3.6× intensity lever on the copper market. This vehicle-level demand compounds with charging infrastructure, where a single direct-current fast charger incorporates up to 17 lb of the metal. Automotive original equipment manufacturers (OEMs) are negotiating multi-year offtake contracts to secure supply ahead of production ramps surpassing mine-development timelines.
Urban Infrastructure Expansion in Emerging Markets
Megacity projects across India, Indonesia, and Nigeria incorporate dense copper loads in power cabling, plumbing, and smart sensors. India alone foresees double-digit annual consumption growth supported by a new USD 1.44 billion domestic smelter designed to trim import dependence. Replacement of aging lead service lines in the United States water networks adds concentrated demand surges, highlighting how infrastructure modernization catalyzes near-term copper ordering patterns.
HVDC Submarine Cables for Offshore Wind
Subsea transmission lines linking far-offshore wind arrays with onshore grids can absorb several thousand tons per route, and each floating-wind platform extends cable length requirements. Projects in the North Sea, Taiwan Strait, and Japan’s Pacific coast create regional clusters of copper usage that depend on specialized cable-laying vessels and high-purity cathode inputs, both of which introduce scheduling risk and episodic demand spikes.
Restraints Impact Analysis*
| Restraint | (~) % Impact on CAGR Forecast | Geographic Relevance | Impact Timeline |
|---|---|---|---|
| Stringent Environmental Regulations and Permitting Delays | -0.8% | Global, with particular impact in developed markets | Medium term (2-4 years) |
| Copper Price Volatility Driven by Speculative Trading | -0.6% | Global commodity markets | Short term (≤ 2 years) |
| Competition from Lightweight Alternative Conductors | -0.3% | North America, Europe, Asia-Pacific industrial applications | Long term (≥ 4 years) |
| Source: Mordor Intelligence | |||
Stringent Environmental Regulations and Permitting Delays
Full-cycle mine development stretches past two decades in the Organisation for Economic Co-operation and Development (OECD) jurisdictions because environmental impact assessments, water-management plans, and community-consultation protocols impose extensive pre-construction milestones. Compliance outlays can add USD 50 million or more to project budgets and discourage greenfield proposals, motivating producers to favor brownfield expansions or acquire permitted deposits.
Copper Price Volatility Driven by Speculative Trading
During 2024-2025, benchmark prices surged to USD 5.96 per lb before retreating below USD 4.20, an amplitude amplified by algorithmic trading and tariff-related uncertainty. Such gyrations undermine budgeting for wind-farm developers and electric vehicle (EV) supply chains, prompting users to shorten contract tenors and adopt dynamic price-risk models that assume wider bands.
*Our forecasts treat driver/restraint impacts as directional, not additive. The impact forecasts reflect baseline growth, mix effects, and variable interactions.
Segment Analysis
By Source: Mining Dominance Faces Recycling Renaissance
Mining supplied 84.15% of global volume in 2025, but secondary feedstock is expanding at a 5.42% CAGR that outstrips primary output growth. The Copper market size for recycled material is rising faster than mined supply as the economics of urban mining improve once scrap grades in obsolete electronics exceed ore grades by an order of magnitude. Secondary copper production requires up to 90% less energy, aligning with corporate net-zero mandates and Environmental, Social, and Governance (ESG)-linked financing incentives.
Scaling recycling is not trivial because contamination from aluminum and iron inflates testing costs—semi-finished fabricators spend USD 28,000 per month on quality checks and still reject roughly 25 shipments annually. Despite these operational challenges, scrap supply grew 4.2% in 2024, double the rate of mined output, signaling a durable pivot toward circular-economy inputs for the copper market.


By End-use Industry: Construction Leadership Yields to Infrastructure Momentum
Building construction held 24.78% of 2025 revenue by virtue of established wiring and plumbing demand, yet infrastructure is on track to become the fastest-expanding slice of the Copper market, advancing at 4.44% CAGR through 2031. Renewable-heavy grid upgrades require five times the copper per MW in legacy generation assets.
Transportation demand will intensify as battery-electric vehicles proliferate and high-power chargers roll out along freight corridors. Data-center investment adds another vector: a single hyperscale facility routinely deploys more than 2,000 tons of copper in busbars, cooling, and high-speed interconnects, a trend that will steepen as artificial-intelligence clusters amplify rack-density and power-draw requirements.
Geography Analysis
Asia-Pacific commanded 70.30% of 2025 consumption, propelled by China’s integrated smelting-to-fabrication ecosystem and India’s accelerating grid build-out. China also houses 44% of global refining capacity, giving the region price-setting clout and the ability to stockpile cathode when futures curves turn backwardated.
North America and Europe remain mature but are entering renewal phases. The United States has closed four refineries since 2000, exporting 341,000 t of concentrate for overseas processing in 2023, yet the Inflation Reduction Act has earmarked funds to reshore smelting capacity. Europe’s offshore-wind agenda mandates HVDC cable procurement that supports premium-grade cathode imports, while stringent recycling directives favor secondary smelters that lower Scope 3 emissions for downstream manufacturers.
The Middle East & Africa represents the fastest-growing arena, with a 5.21% CAGR forecast as sovereign-wealth investors channel capital into Zambian, DRC, and Namibian projects. Gulf states are also funding domestic downstream capacity to hedge against oil-revenue volatility, linking African feedstock with local rod and tube mills to create an emergent south-south supply chain for the copper market.
Mordor Intelligence provides coverage of the copper market across other key regional markets. Detailed country-level analysis extends to China incorporating local coverage and market participation, as required.

Competitive Landscape
The Copper Market is moderately fragmented. Strategic partnerships are proliferating to share capital risk; BHP’s smelter-modernization contract with ABB and Anglo American’s USD 5 billion joint venture with Codelco illustrate the co-investment model. Technology adoption differentiates margins as autonomous haulage, predictive-maintenance analytics, and carbon-capture at smelters reduce cost curves and carbon intensity. Market entrants focused on antimicrobial alloys and ultra-high-conductivity products compete on niche performance attributes rather than volume, fragmenting the downstream portion of the copper market even as upstream supply remains capital-intensive.
Copper Industry Leaders
Glencore
BHP
Codelco
Freeport-McMoRan
Grupo Mexico (Southern Copper)
- *Disclaimer: Major Players sorted in no particular order

Recent Industry Developments
- June 2025: Oman inaugurated its first industrial plant to convert legacy copper mining waste into high-purity copper in the Wilayat of Suhar. The plant uses renewable energy and eco-friendly technologies and is developed by Green Tech Mining and Services.
- December 2024: Cyclic Materials Inc., a Canadian recycler specializing in rare earths and metals, signed a deal to supply Glencore with a minimum of 10,000 metric tons of recycled copper. Glencore, in turn, will process and refine this metal at its Horne smelter and Copper Refinery in Quebec, transforming it into copper cathodes.


Global Copper Market Report Scope
Copper is the third-most-consumed metal in the world. It is also known as a highly electrically conductive material. The properties of copper include good electrical conductivity, excellent thermal conductivity, corrosion resistance, high ductility, recyclability, and a non-magnetic nature. The copper market is segmented by end-user industry (automotive and heavy equipment, construction, electrical and electronics, industrial, and other end-user industries). The report also covers the market size and forecast for the market in 15 countries across major regions, in volume (kilo tons).
| Mining |
| Recycling |
| Building Construction |
| Infrastructure |
| Industrial |
| Transportation |
| Consumer Products and Electronic Equipment |
| Others |
| Asia-Pacific | China |
| Japan | |
| India | |
| South Korea | |
| Rest of Asia-Pacific | |
| North America | United States |
| Canada | |
| Mexico | |
| Europe | Germany |
| United Kingdom | |
| France | |
| Italy | |
| Rest of Europe | |
| South America | Brazil |
| Argentina | |
| Rest of South America | |
| Middle East and Africa | Saudi Arabia |
| South Africa | |
| Rest of Middle East and Africa |
| By Source | Mining | |
| Recycling | ||
| By End-use Industry | Building Construction | |
| Infrastructure | ||
| Industrial | ||
| Transportation | ||
| Consumer Products and Electronic Equipment | ||
| Others | ||
| By Geography | Asia-Pacific | China |
| Japan | ||
| India | ||
| South Korea | ||
| Rest of Asia-Pacific | ||
| North America | United States | |
| Canada | ||
| Mexico | ||
| Europe | Germany | |
| United Kingdom | ||
| France | ||
| Italy | ||
| Rest of Europe | ||
| South America | Brazil | |
| Argentina | ||
| Rest of South America | ||
| Middle East and Africa | Saudi Arabia | |
| South Africa | ||
| Rest of Middle East and Africa | ||


Key Questions Answered in the Report
What is the projected demand growth for copper through 2031?
Global volume is expected to rise from 27.34 million tons in 2026 to 33.27 million tons by 2031, pointing to a 4.01% CAGR driven by renewables, EVs, and infrastructure.
How does recycling influence future supply?
Secondary feedstock is growing at a 5.42% CAGR, providing an energy-efficient source that helps narrow the gap between rising demand and constrained mine output.
Which region currently leads consumption?
Asia-Pacific holds 70.30% of 2025 global demand thanks to China’s refining dominance and India’s infrastructure rollouts.
Why are HVDC submarine cables important for copper producers?
Each offshore-wind HVDC link can consume several thousand tons of high-purity copper, creating concentrated, premium-grade demand in Europe and coastal Asia.
What are the main risks to supply expansion?
Stringent permitting processes and price volatility reduce investor appetite for greenfield mines, extending development timelines beyond the window of peak demand growth.
Page last updated on:


