Recycled Copper Market Size and Share
Market Overview
| Study Period | 2021 - 2031 |
|---|---|
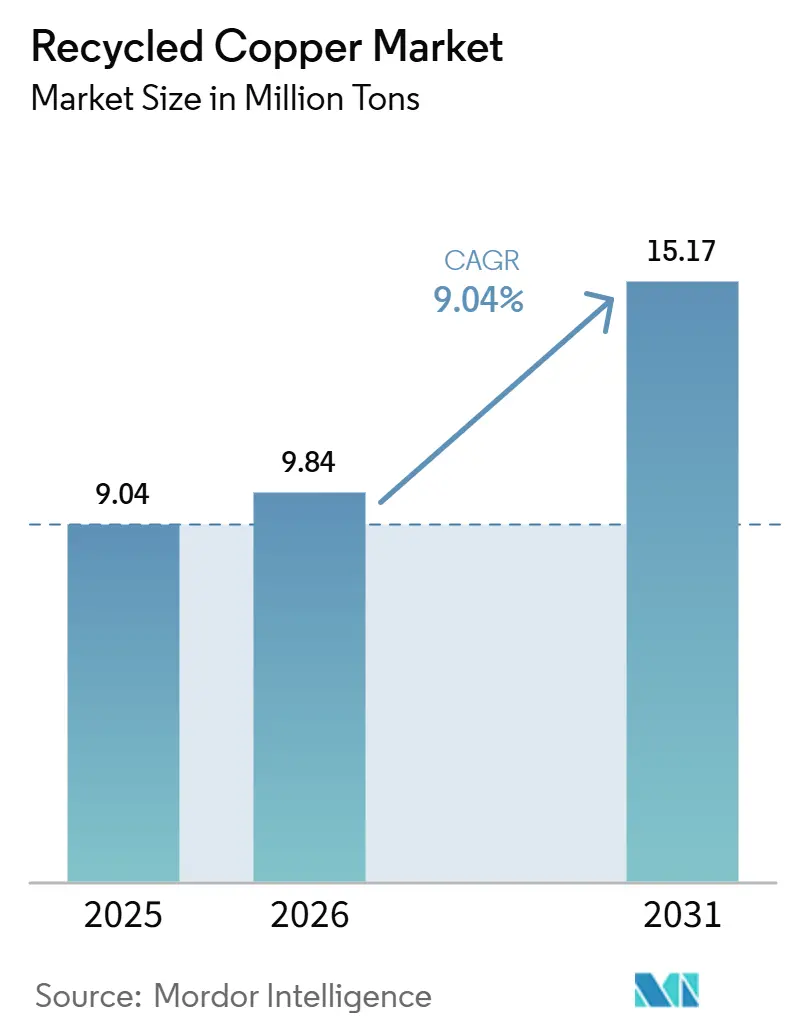
| Market Volume (2026) | 9.84 Million tons |
| Market Volume (2031) | 15.17 Million tons |
| Growth Rate (2026 - 2031) | 9.04% CAGR |
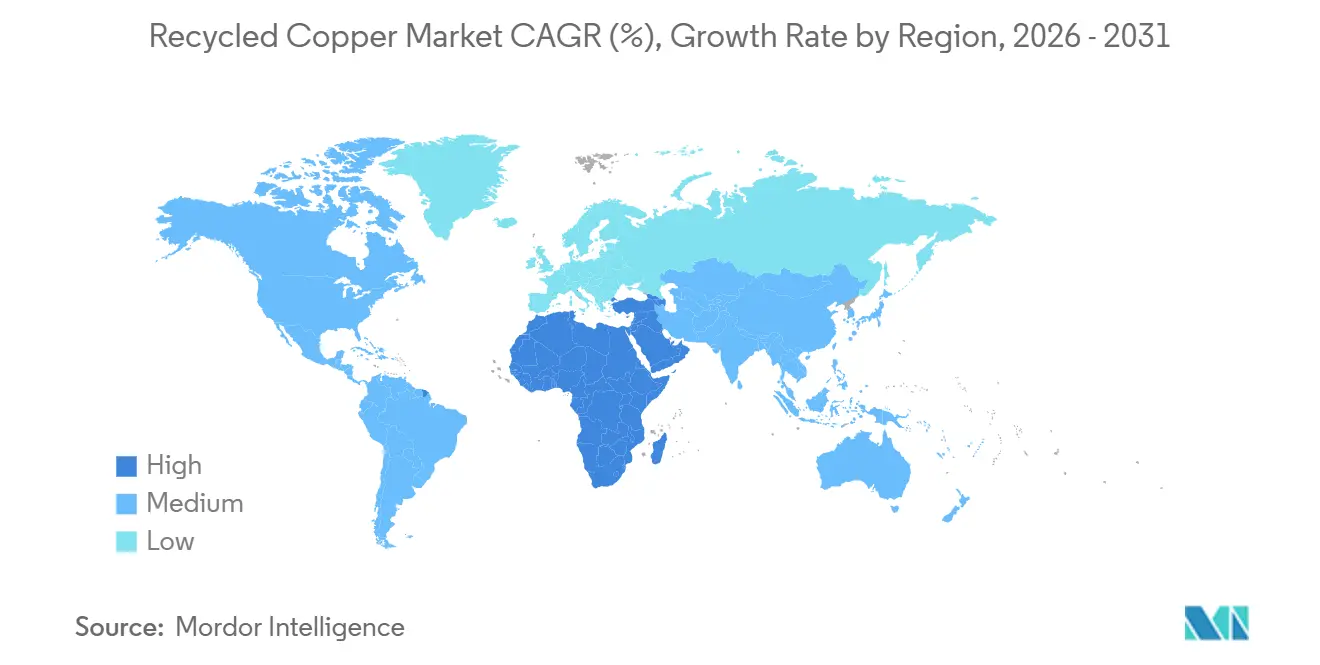
| Fastest Growing Market | Asia Pacific |
| Largest Market | Middle East and Africa |
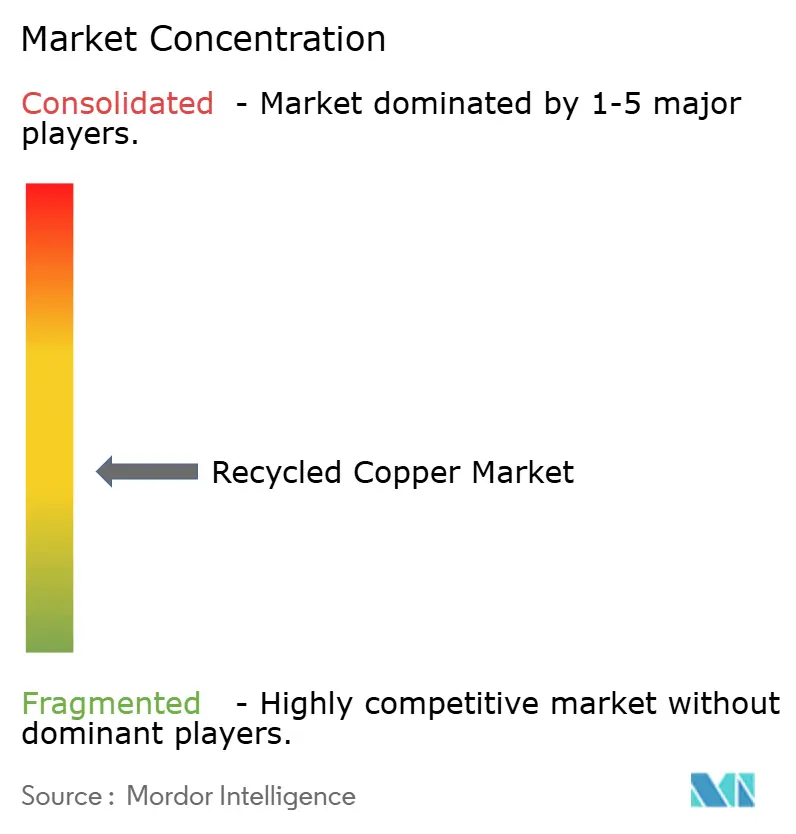
| Market Concentration | Medium |
Major Players *Disclaimer: Major Players sorted in no particular order Image © Mordor Intelligence. Reuse requires attribution under CC BY 4.0. | |
Recycled Copper Market Analysis by Mordor Intelligence
The Recycled Copper Market size is projected to be 9.04 Million tons in 2025, 9.84 Million tons in 2026, and reach 15.17 Million tons by 2031, growing at a CAGR of 9.04% from 2026 to 2031. Elevated electric-vehicle build rates, stricter circular-economy mandates in China and the European Union, and the decline in concentrate treatment charges have collectively shifted smelter procurement toward secondary feed, reducing the historical price gap between scrap and cathode. Asia-Pacific led the recycled copper market with a 39.00% volume share in 2025. However, the Middle-East and Africa are now attracting greenfield investments as Omani and Saudi plants expand rapidly. AI-enabled hyperspectral sorters are improving No. 2-to-No. 1 upgrade ratios, while hydrometallurgical pilot projects achieve high recovery rates without sulfur-dioxide emissions, offering regulatory compliance advantages. Blockchain-based certification platforms are introducing compliance costs of USD 50–80 per ton, which smaller collectors find challenging to absorb, driving market consolidation. Persistent scrap-price volatility, as seen in January 2026 when LME cash copper surged to USD 13,387 per ton before falling 8% by March, remains a significant margin risk for recyclers without hedging strategies.
Key Report Takeaways
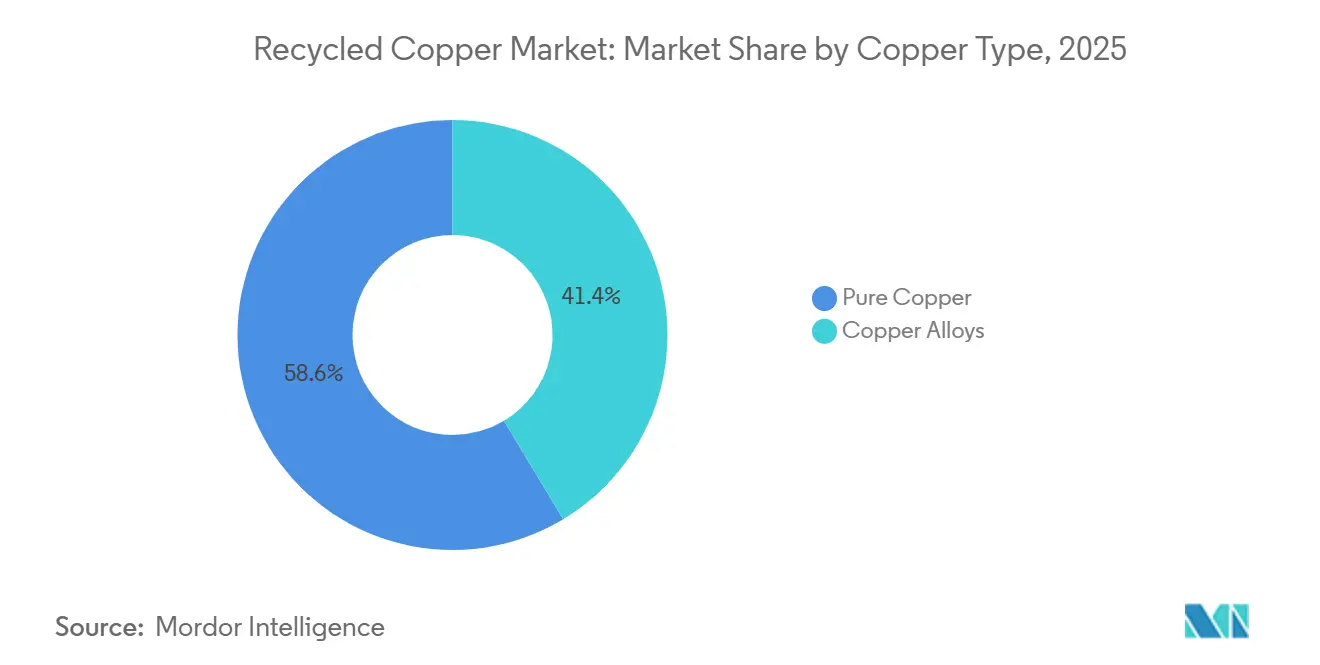
- By copper type, pure copper captured 58.61% of the recycled copper market share in 2025, whereas copper alloys are expected to grow at a 10.12% CAGR through 2031.
- By source, post-consumer scrap accounted for 53.45% of the recycled copper market share in 2025, yet industrial scrap is advancing at a 10.07% CAGR through 2031.
- By process, pyrometallurgical recycling represented 37.87% of the recycled copper market share in 2025, while hydrometallurgy recycling is poised for a 10.04% CAGR through 2031.
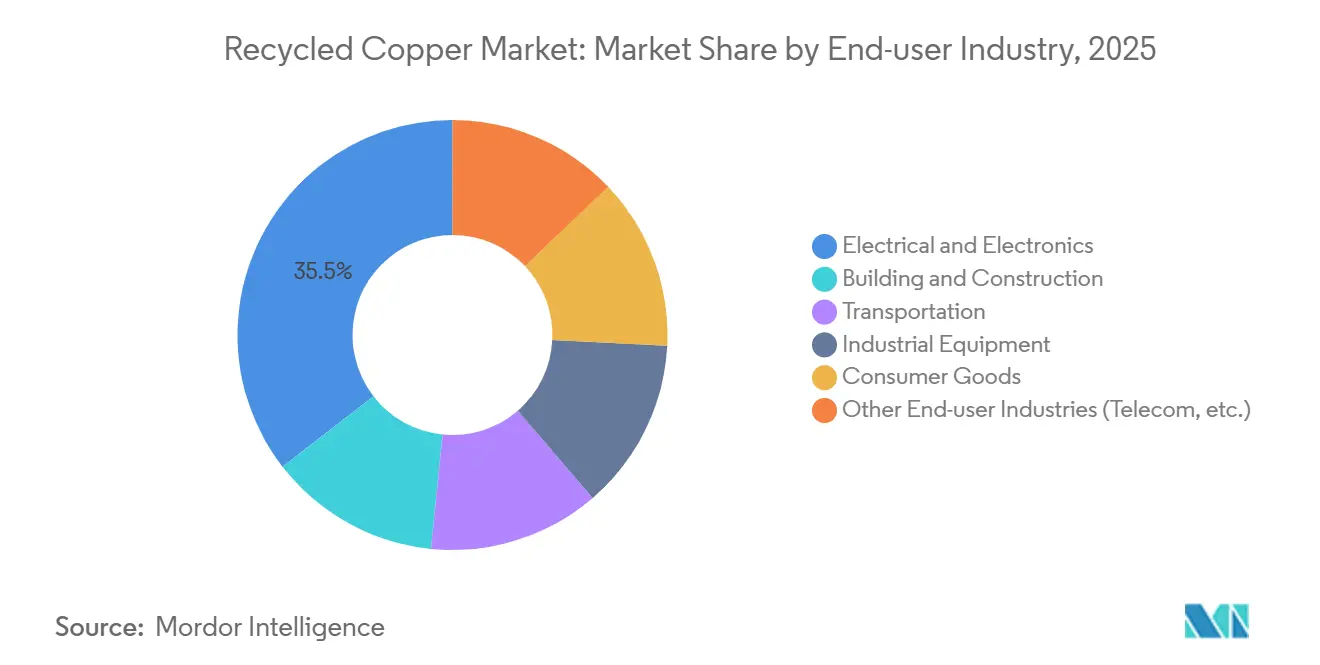
- By end-user industry, electrical and electronics commanded 35.50% of the recycled copper market share in 2025, whereas transportation is on track for a 10.10% CAGR through 2031.
- By geography, Asia-Pacific led with 39.25% of the recycled copper market share in 2025, while Middle-East and Africa is forecast to expand at a 10.09% CAGR through 2031.
Note: Market size and forecast figures in this report are generated using Mordor Intelligence’s proprietary estimation framework, updated with the latest available data and insights as of January 2026.
Global Recycled Copper Market Trends and Insights
Drivers Impact Analysis*
| Driver | (~) % Impact on CAGR Forecast | Geographic Relevance | Impact Timeline |
|---|---|---|---|
| Robust demand from EV-related wiring and battery collectors | +2.1% | Global, with concentration in China, EU, North America | Medium term (2-4 years) |
| Growing circular-economy mandates in the EU and China | +1.8% | EU core, China, spill-over to ASEAN and Middle-East | Long term (≥ 4 years) |
| Copper-price hedging tools accessible to recyclers | +0.9% | Global, particularly North America and EU | Short term (≤ 2 years) |
| OEM-led closed-loop alloy qualification for die-casting | +1.3% | North America, EU, Japan, South Korea | Medium term (2-4 years) |
| AI-enabled scrap sorting boosting high-grade recovery rates | +1.6% | APAC core, North America, EU | Medium term (2-4 years) |
| Source: Mordor Intelligence | |||
Robust Demand from EV-Related Wiring and Battery Collectors
Battery electric vehicles contain 80–91 kg of copper, nearly three times the amount in internal combustion engine vehicles. Battery-pack current collectors yield 99.99%-purity copper foil, which can be mechanically liberated and electro-refined at 60% of the energy cost of primary smelting. China’s production of 9.5 million EVs in 2025 is expected to generate a deferred scrap wave maturing after 2032. However, recyclers are already securing multi-year offtake agreements indexed to LME prices minus fixed discounts, ensuring feedstock availability. Tesla and BYD have disclosed pilot projects that reintegrate recovered collector copper directly into new cell lines, tightening merchant supply. The European Battery Regulation mandates 90% copper recovery from waste batteries by 2027, with non-compliance fines of up to EUR 500,000, driving hydrometallurgical investments in EUROPE[1]European Commission, “Battery Regulation 2023/1542,” europa.eu. Automakers are redesigning harnesses with single-alloy connectors, improving post-shred yields by 12–15 percentage points, and enhancing recycled copper supply.
Growing Circular-Economy Mandates in the EU and China
The EU Waste Shipment Regulation, effective May 2026, bans copper scrap exports labeled as waste to non-OECD destinations starting in 2027. This forces European collectors to enhance domestic processing capabilities or accept lower regional prices. In contrast, China relaxed import purity rules in November 2025 and introduced a recycled-metals futures contract on the Shanghai Futures Exchange, increasing imported scrap to 2.34 million tons in 2025 despite geopolitical tariffs. The REPowerEU initiative targets 25% of critical minerals from recycled content by 2030, with public procurement scorecards awarding premiums of EUR 150–200 per ton for certified scrap. China’s MIIT guidelines require major fabricators to source 30% secondary feed by 2028, fostering joint ventures between state-owned smelters and private scrap aggregators. These synchronized policies are reshaping the competitive landscape of the recycled copper market, pressuring recyclers without an auditable chain-of-custody system.
Copper-Price Hedging Tools Accessible to Recyclers
In June 2025, LME three-month copper averaged USD 9,679 per ton with 12% monthly volatility, exposing unhedged processors to significant working-capital risks. The Shanghai Futures Exchange introduced a dedicated recycled-copper contract with smaller lot sizes and lower margins, enabling Southeast Asian mid-sized companies to hedge basis risk cost-effectively. With concentrate treatment charges dropping to USD 5 per ton in early 2025, primary smelters aggressively bid for scrap, tightening grade-price differentials and emphasizing the importance of derivatives literacy. Goldman Sachs projects a 500,000-tonne structural deficit through 2028, creating an upward bias in forward curves that can be monetized through calendar spreads. Despite the potential for a 2–3 percentage point margin improvement, fewer than 15% of North American recyclers currently utilize paper hedges, leaving opportunities for larger firms to capitalize on this gap.
OEM-Led Closed-Loop Alloy Qualification for Die-Casting
Automakers are validating recycled brass and bronze alloys for high-pressure die-casting without refining to cathode, enabling the direct use of discounted No. 2 scrap and saving USD 800–1,200 per ton in processing costs. General Motors and Stellantis have published specifications allowing up to 95% recycled content in non-structural castings, granting compliant foundries preferred-bid status. The upcoming ISO 22965 standard, expected in late 2026, will standardize chemistry and traceability, reducing project qualification times by up to six weeks. Foundries are adopting inline X-ray fluorescence units to certify inbound loads in real time, reducing rejection rates and enhancing just-in-time delivery models. As EV motor housings and battery enclosures increasingly use copper-alloy die-casts, alloy demand is projected to grow, creating a high-growth segment within the recycled copper market.
Restraints Impact Analysis*
| Restraint | (~) % Impact on CAGR Forecast | Geographic Relevance | Impact Timeline |
|---|---|---|---|
| Scrap-price volatility compressing recycler margins | -1.4% | Global, particularly North America and EU | Short term (≤ 2 years) |
| Quality variation and contamination in mixed copper streams | -0.8% | ASEAN, Middle-East, South America | Medium term (2-4 years) |
| High cost of blockchain-based green-copper certification | -0.6% | EU, North America | Medium term (2-4 years) |
| Source: Mordor Intelligence | |||
Scrap-Price Volatility Compressing Recycler Margins
In January 2026, LME copper reached a record USD 13,387 per ton before falling 8% by March, leaving recyclers who locked in high-priced feed with negative margins. Small processors operating on 60-day purchase terms and 30-day sales terms risk losing 40% of gross margins if prices drop by 10%. Regional disparities exacerbate challenges: export bans keep European prices elevated, while Southeast Asian inspections suppress local values, benefiting logistics-advantaged traders. The recycled copper market thus rewards hedged and diversified operators while penalizing those reliant on spot transactions.
Quality Variation and Contamination in Mixed Copper Streams
Mixed demolition scrap often contains 3–8% ferrous attachments and polymers, reducing smelter yields and incurring penalties of USD 200–400 per ton compared to clean grades[2]Institute of Scrap Recycling Industries, “ISRI Scrap Specifications Circular,” isri.org. Malaysia’s SIRIM regime detains shipments misdeclared by more than 2 percentage points, delaying containers for up to 11 months and straining small exporters. Vietnam’s suspension of temporary-import-for-reexport permits through 2030 redirects low-grade scrap flows to Thailand, which is considering similar restrictions. Environmental regulations further increase costs, as higher sulfur-dioxide emissions from contaminated scrap require EU and Chinese smelters to invest in scrubbers costing USD 30–50 per ton. The lack of harmonized global grading standards widens bid-ask spreads, increasing working-capital requirements across the recycled copper market.
*Our forecasts treat driver/restraint impacts as directional, not additive. The impact forecasts reflect baseline growth, mix effects, and variable interactions.
Segment Analysis
By Copper Type: Alloys Gain as OEMs Pre-Qualify Recycled Brass
Copper alloys are expected to grow at a 10.12% CAGR through 2031, significantly outpacing pure copper, as automakers approve recycled brass and bronze for use in die-casting, radiators, and heat exchangers. Suppliers incorporating No. 2 scrap directly into alloy production save USD 800–1,200 per ton compared to the cathode production method, enhancing their competitiveness. The implementation of ISO 22965 by late 2026 will standardize alloy chemistry, reducing qualification times by up to six weeks and promoting adoption across North America, Europe, and Japan.
Pure copper retained a 58.61% market share in 2025, driven by demand for grid wiring, data-center busbars, and inverters requiring 99.99% conductivity. Closed-loop programs with utilities ensure that decommissioned cables are sent directly to smelters, maintaining purity and stabilizing premiums. Aurubis aims to achieve 50% recycled content in cathodes by 2030, supporting investments in secondary refining. While alloy adoption reduces some volume, pure copper remains critical for high-conductivity applications, ensuring its continued importance in the recycled copper market.


By Source: Industrial Scrap Accelerates with On-Site Granulators
Post-consumer scrap accounted for 53.45% of the 2025 supply, but industrial scrap is projected to grow at a 10.07% CAGR through 2031 as fabricators adopt compact granulators to capture margins previously outsourced. Wire and tube producers using systems from SWEED or CopperMine achieve 99.99% pure granules, commanding USD 1,000–1,400 per ton premiums over mixed scrap, with payback periods of 12 to 18 months.
Post-consumer scrap benefits from large-scale demolition projects and the anticipated retirement of EV batteries. However, its heterogeneous chemistry increases processing costs and certification challenges. Extended Producer Responsibility frameworks in Vietnam and the EU are improving collection, but fragmented dealer networks delay settlement cycles. Industrial scrap, with its consistent chemistry, reduces slag losses and supports hydrometallurgical processing, increasing its share in the recycled copper market.
By Process: Hydrometallurgy Gains on Bio-Leaching Pilots
Pyrometallurgy accounted for 37.87% of 2025 recycling throughput, but hydrometallurgy is forecast to grow at a 10.04% CAGR through 2031, driven by bio-leaching advancements using Acidithiobacillus spp., achieving 90–95% recovery rates on printed circuit boards. Solvent extraction-electrowinning consumes 60% less energy than smelting, reducing Scope 1 emissions and appealing to ESG-conscious customers.
Large furnaces remain dominant for processing mixed-grade scrap due to economies of scale and the co-recovery of precious metals, which offsets costs. Hybrid pyro-hydro processes are emerging, combining smelting to blister and electrowinning to cathode, balancing throughput and purity. Mechanical shredding and AI sorting are increasingly used as universal front-end processes, improving overall metal recovery in the recycled copper market.
By End-user Industry: Transportation Surges on Electrification
The electrical and electronics sector led with 35.50% of 2025 demand, supported by applications in wiring, PCBs, and motors. While growth is tempered by market maturity and selective aluminum substitution, the segment remains a key volume driver.
Transportation is forecast to grow at a 10.10% CAGR through 2031, fueled by rail electrification, marine hybrid propulsion, and aerospace wiring retrofits. Overhead catenary wires, containing 1.2–1.8 tons of copper per kilometer, will serve as prime feedstock at end-of-life. For instance, the Boeing 787 contains 215 km of copper wiring, highlighting the structural pipeline feeding the recycled copper market.

Geography Analysis
Asia-Pacific held 39.25% of the recycled copper market share in 2025, driven by China’s 2.34 million-tonne scrap imports and India’s significant demand-supply gap. China’s recycled-metals futures contract enhances hedging options, while India’s Hindalco is expanding recycling capacity under a USD 10 billion investment plan. ASEAN nations, acting as processing hubs, are tightening impurity inspections, shifting trade flows toward certified operators.
The Middle-East and Africa, the fastest-growing region with a 10.09% CAGR through 2031, is supported by Oman’s USD 106 million plant scaling to 12,000 tons by 2026 and Saudi Arabia’s USD 100 billion mining initiative. Regional grid expansions of 40% by 2035 will create a deferred scrap pipeline, while Chinese and European smelters plan hub facilities to pre-clean mixed scrap for export.
In North America, U.S. tariffs redirect scrap inward, maintaining domestic margins, while Sims Limited upgrades separation lines across the region. Europe faces short-term challenges from rising power costs and the 2027 waste-export ban, but long-term demand for certified feedstock remains strong. South America’s market share is modest, but Brazil’s 12 GW of new renewable energy projects approved in 2025 position it as a future growth area, reflecting geographic rebalancing trends in the recycled copper market.

Competitive Landscape
The recycled copper market is moderately concentrated, with the top five processors handling approximately 42% of global volume in 2025. Primary miners are integrating downstream, such as Glencore’s CAD 500 million retrofit at the Horne smelter, which processes 10,000 tons of secondary copper annually, and Aurubis’ USD 800 million Richmond plant, adding 180,000 tons per year of capacity with a target of 50% recycled cathode by 2030.
Technology is a key differentiator, with AI-powered sorters and blockchain traceability enhancing margins and securing OEM contracts. Certified low-carbon copper commands premiums of EUR 150–200 per ton, encouraging investment, though ledger costs of USD 50–80 per ton challenge smaller collectors, driving consolidation. Innovations from bio-leaching startups and robotics firms like ZenRobotics are introducing disruptive capabilities, while Korea Zinc’s Queensland refinery, operating at 250,000 tpa with renewable energy, supplies automakers focused on Scope 3 emissions reductions. These dynamics indicate intensifying competition and strategic partnerships across the recycled copper industry.
Recycled Copper Industry Leaders
Aurubis AG
Sims Limited
Boliden Group
Jiangxi Copper Company Limited
Chiho Environmental Group Limited
- *Disclaimer: Major Players sorted in no particular order

Recent Industry Developments
- March 2026: Gravita India Ltd. announced the acquisition of Rashtriya Metal Industries for approximately INR 800 crore. This marked a strategic move into the copper recycling and alloy segment.
- September 2025: The Aurubis AG facility in Richmond, Georgia, was the first multimetal recycling plant of its kind in the United States. It began operations with an estimated annual processing capacity of approximately 180,000 metric tons of complex recycling materials, expected to be achieved upon completing its second phase in 2026.


Global Recycled Copper Market Report Scope
Recycled copper is a fully recyclable and sustainable material that maintains its physical and chemical properties indefinitely, enabling reuse without any loss in quality. It is obtained from "old" (end-of-life) scrap and "new" (manufacturing) scrap, offering energy savings of up to 85% compared to primary mining.
The Recycled Copper Market is segmented into copper type, source, process, end-user industry, and geography. By copper type, the market is segmented into pure copper and copper alloys. By source, the market is segmented into post-consumer scrap and industrial scrap. By process, the market is segmented into mechanical recycling, pyrometallurgical recycling, hydrometallurgical recycling, and combined pyro-hydro routes. By end-user industry, the market is segmented into electrical and electronics, building and construction, transportation, industrial equipment, consumer goods, and other end-user industries (telecom, etc.). The report also covers the market size and forecasts for recycled copper in 17 countries across major regions. For each segment, the market sizing and forecasts have been done on the basis of volume (tons).
| Pure Copper |
| Copper Alloys |
| Post-Consumer Scrap |
| Industrial Scrap |
| Mechanical Recycling |
| Pyrometallurgical Recycling |
| Hydrometallurgical Recycling |
| Combined Pyro-Hydro Routes |
| Electrical and Electronics |
| Building and Construction |
| Transportation |
| Industrial Equipment |
| Consumer Goods |
| Other End-user Industries (Telecom, etc.) |
| Asia-Pacific | China |
| Japan | |
| India | |
| South Korea | |
| ASEAN Countries | |
| Rest of Asia-Pacific | |
| North America | United States |
| Canada | |
| Mexico | |
| Europe | Germany |
| United Kingdom | |
| France | |
| Italy | |
| Spain | |
| Russia | |
| NORDIC Countries | |
| Rest of Europe | |
| South America | Brazil |
| Argentina | |
| Rest of South America | |
| Middle-East and Africa | Saudi Arabia |
| South Africa | |
| Rest of Middle-East and Africa |
| By Copper Type | Pure Copper | |
| Copper Alloys | ||
| By Source | Post-Consumer Scrap | |
| Industrial Scrap | ||
| By Process | Mechanical Recycling | |
| Pyrometallurgical Recycling | ||
| Hydrometallurgical Recycling | ||
| Combined Pyro-Hydro Routes | ||
| By End-user Industry | Electrical and Electronics | |
| Building and Construction | ||
| Transportation | ||
| Industrial Equipment | ||
| Consumer Goods | ||
| Other End-user Industries (Telecom, etc.) | ||
| By Geography | Asia-Pacific | China |
| Japan | ||
| India | ||
| South Korea | ||
| ASEAN Countries | ||
| Rest of Asia-Pacific | ||
| North America | United States | |
| Canada | ||
| Mexico | ||
| Europe | Germany | |
| United Kingdom | ||
| France | ||
| Italy | ||
| Spain | ||
| Russia | ||
| NORDIC Countries | ||
| Rest of Europe | ||
| South America | Brazil | |
| Argentina | ||
| Rest of South America | ||
| Middle-East and Africa | Saudi Arabia | |
| South Africa | ||
| Rest of Middle-East and Africa | ||


Key Questions Answered in the Report
What is the size of the recycled copper market?
The recycled copper market stands at 9.84 million tons in 2026 and is projected to reach 15.17 million tons by 2031.
Which region is expected to grow fastest through 2031?
Middle-East and Africa is projected to post the highest growth, with a 10.09% CAGR through 2031, driven by new Omani and Saudi facilities.
Which segment leads demand for copper type in 2025?
Pure copper commands 58.61% of 2025 volume due to electrical and electronics applications that demand 99.99% purity.
Why is the No. 2 scrap grade growing through 2031?
AI-enabled sorting upgrades mixed demolition feed are lifting No. 2 through 2031.
Page last updated on:


