Metal Deactivator Market Size and Share
Market Overview
| Study Period | 2021 - 2031 |
|---|---|
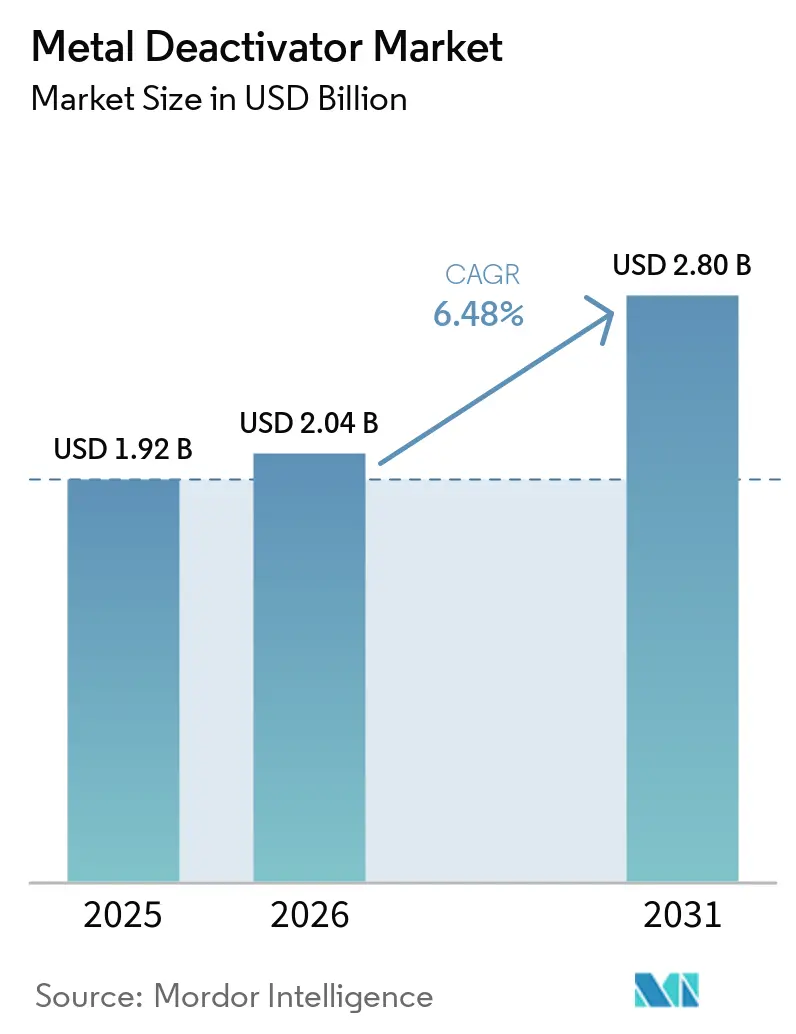
| Market Size (2026) | USD 2.04 Billion |
| Market Size (2031) | USD 2.80 Billion |
| Growth Rate (2026 - 2031) | 6.48% CAGR |
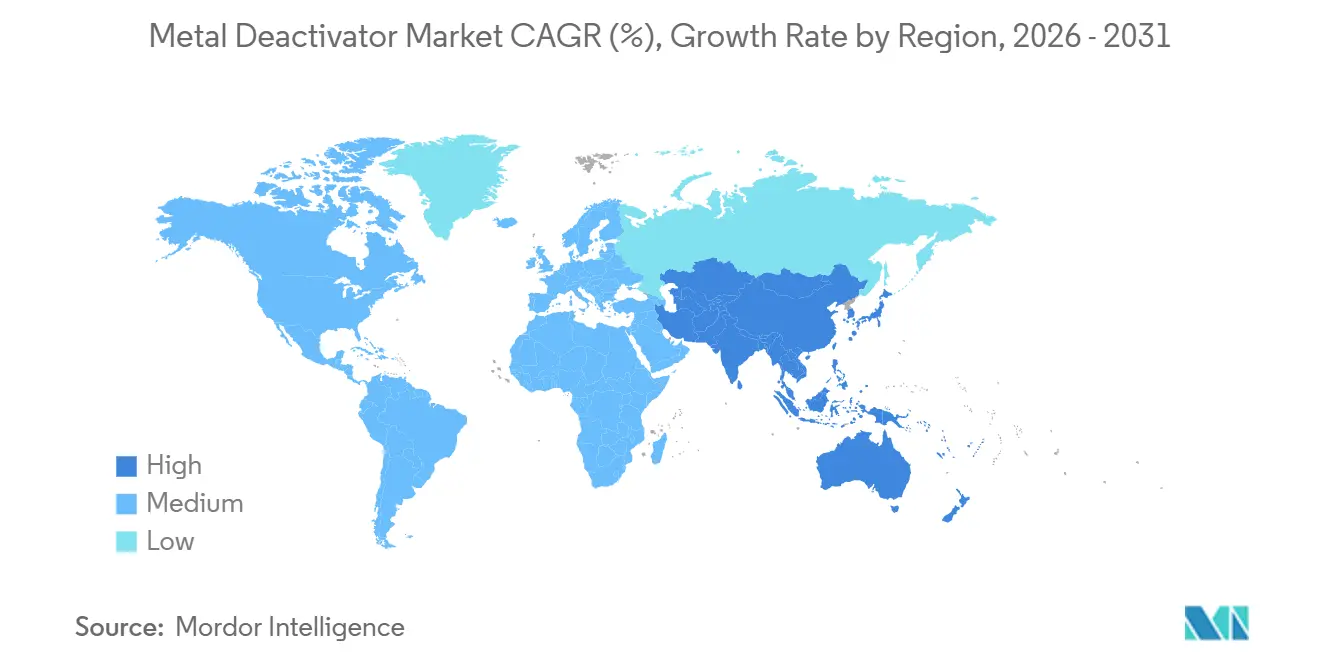
| Fastest Growing Market | Asia Pacific |
| Largest Market | Asia Pacific |
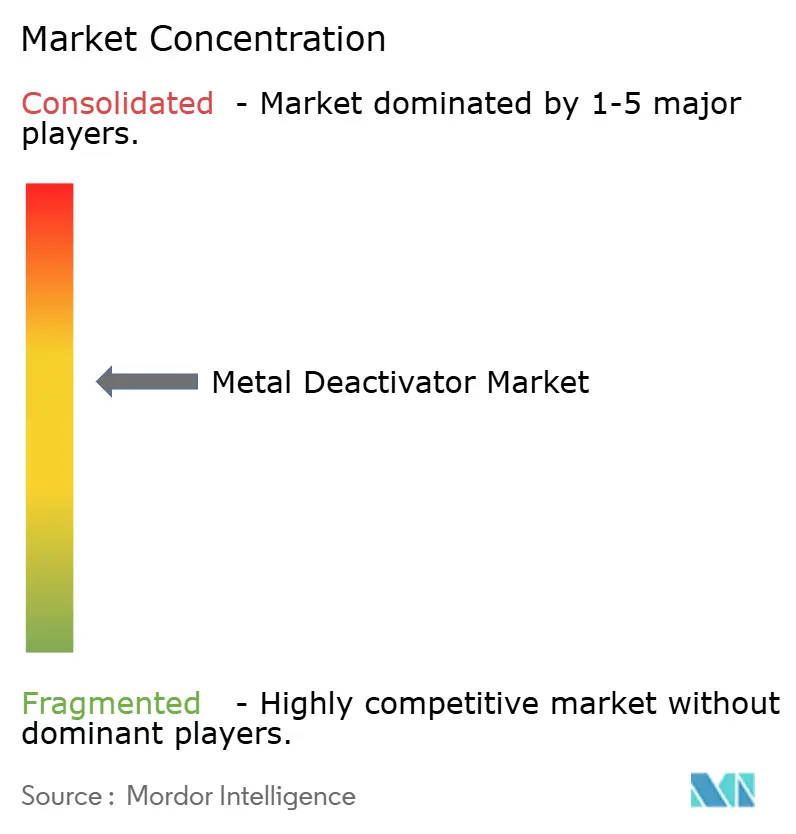
| Market Concentration | Medium |
Major Players *Disclaimer: Major Players sorted in no particular order Image © Mordor Intelligence. Reuse requires attribution under CC BY 4.0. | |
Metal Deactivator Market Analysis by Mordor Intelligence
The Metal Deactivator Market size is expected to increase from USD 1.92 billion in 2025 to USD 2.04 billion in 2026 and reach USD 2.80 billion by 2031, growing at a CAGR of 6.48% over 2026-2031. Robust growth flows from tightening oxidation-stability rules in fuels and lubricants, increasing demand for long-term fluid durability under extreme operating conditions, and the expansion of electric-mobility cooling loops requiring copper passivation. Multifunctional additive packages combining metal deactivators with antioxidants and detergents are becoming the standard choice as OEM drain intervals extend and injector-deposit standards become stricter. Asia-Pacific continues to lead in new capacity additions, while North American and European suppliers utilize regulatory expertise to maintain premium positions. Competitive differentiation is moving away from standalone passivation toward comprehensive deposit-control effectiveness that secures TOP TIER+ gasoline or MIL-PRF-25017 jet-fuel approvals.
Key Report Takeaways
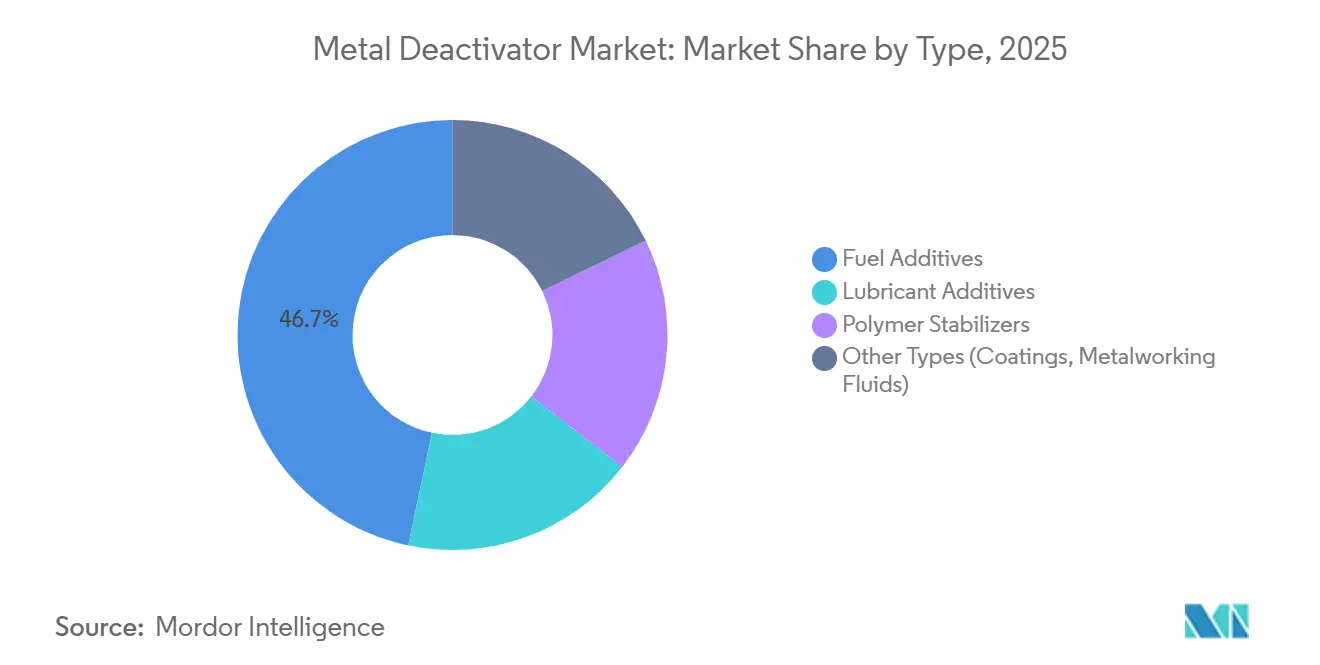
- By type, fuel additives led with 46.71% of the metal deactivator market share in 2025 and are forecast to expand at a 6.84% CAGR through 2031.
- By chemistry, nitrogen-based chelating agents held 35.27% of the metal deactivator market share in 2025 and are projected to grow at a 7.22% CAGR through 2031.
- By application, gasoline accounted for 39.46% of the metal deactivator market share in 2025, whereas jet fuel is set to advance at a 7.38% CAGR through 2031.
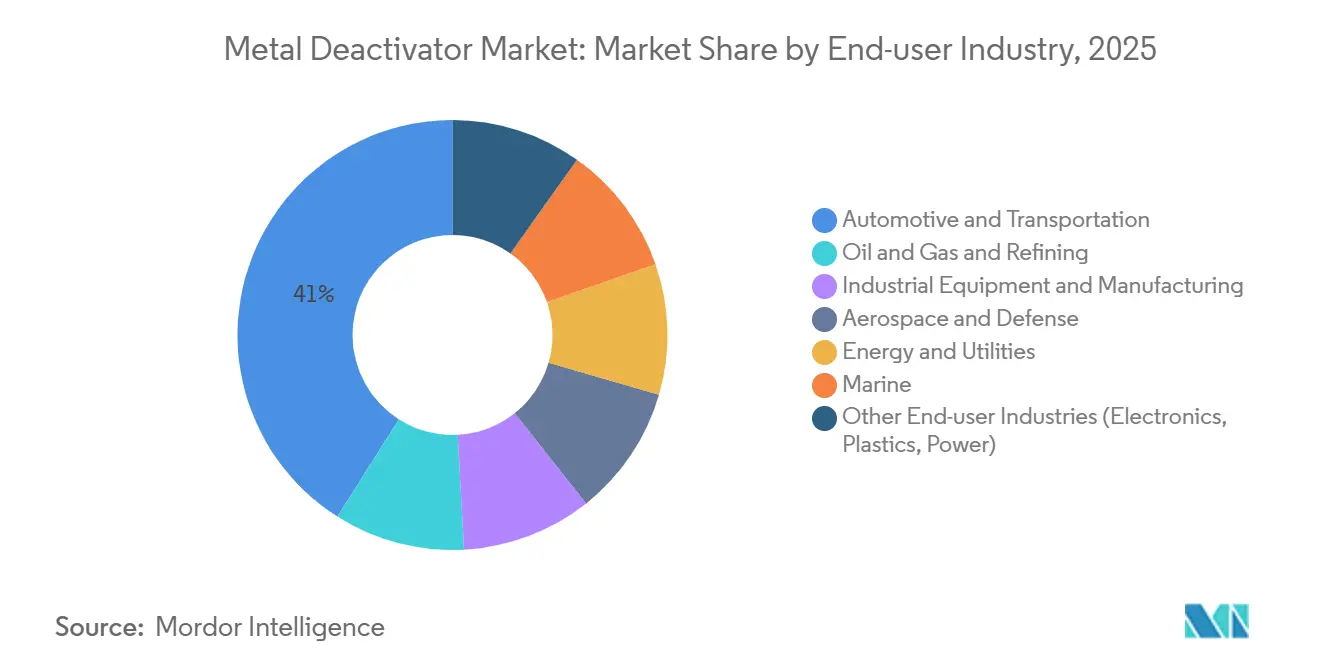
- By end-user industry, automotive and transportation commanded 41.01% of the metal deactivator market share in 2025, while aerospace and defense is poised for the highest 7.47% CAGR through 2031.
- By geography, Asia-Pacific captured 44.67% of the metal deactivator market share in 2025 and will remain the fastest-growing region at a 7.22% CAGR through 2031.
Note: Market size and forecast figures in this report are generated using Mordor Intelligence’s proprietary estimation framework, updated with the latest available data and insights as of January 2026.
Global Metal Deactivator Market Trends and Insights
Drivers Impact Analysis*
| Driver | (~) % Impact on CAGR Forecast | Geographic Relevance | Impact Timeline |
|---|---|---|---|
| Growing demand for long-term fuel and lubricant stability | +1.2% | Global, with concentration in North America and Europe | Medium term (2-4 years) |
| Increase in non-ferrous metal usage in fluid systems | +0.9% | Asia-Pacific core, spillover to North America | Long term (≥ 4 years) |
| Stricter oxidation-stability regulations | +1.5% | North America, Europe, and emerging Asia-Pacific markets | Short term (≤ 2 years) |
| Rising adoption of aviation and marine fuels | +1.1% | Middle-East, North America, Europe | Medium term (2-4 years) |
| Surge in copper-leaching in fast-charging EV cooling loops | +0.7% | Asia-Pacific (China, South Korea), North America | Medium term (2-4 years) |
| High-voltage transformer retro-fill programs | +0.6% | North America, Europe, select Asia-Pacific grids | Long term (≥ 4 years) |
| Source: Mordor Intelligence | |||
Growing Demand for Long-term Fuel and Lubricant Stability
Extended drain intervals in passenger-car and industrial oils require formulators to blend metal deactivators with high-performance antioxidants to prevent copper-catalyzed oxidation, which leads to sludge and varnish formation. Synthetic esters and polyalphaolefins are more vulnerable to transition-metal degradation than mineral bases, making passivation essential for meeting ACEA C5 and API SP standards that certify drain intervals of 10,000 miles or more. The global lubricant additives market, valued at USD 22.4 billion in 2025, supports structural demand for multifunctional packages incorporating metal deactivators to manage oxidation and corrosion. Biodiesel blends retain copper from feedstock processing; laboratory tests show that 300-500 ppm of salicylidene chelators suppress peroxide growth and extend storage life. The growth of bio-based and re-refined base oils, driven by EU Ecolabel criteria, supports the use of nitrogen chelators compatible with polar esters. OEM approvals such as Volvo VDS-5 explicitly assess metal-catalyzed oxidation, linking deactivators to the qualification process for next-generation oils.
Increase in Non-ferrous Metal Usage in Fluid Systems
Copper-nickel heat exchangers in naval vessels, aluminum radiators in electric vehicles, and brass fittings in hydraulic circuits expose fluids to catalytic surfaces that accelerate degradation unless passivated. U.S. Navy data shows copper contamination levels as high as 1,000 ppb in JP-5 fuel aboard aircraft carriers, increasing engine overhaul costs to USD 1 billion annually[1]United States Navy SBIR, “Copper Contamination Mitigation in JP-5 Systems,” navy.mil. Fast-charging EV cooling loops operating above 400 V experience galvanic leaching of copper into dielectric coolants, risking conductivity drift and short circuits without chelation. Peer-reviewed studies confirm that transition metals catalyze jet-fuel oxidation above 250°C, with N, N'-disalicylidene-1,2-propanediamine reducing deposit mass by 80% at trace treatment levels. Transformer oils meeting IEC 60296 standards use benzotriazole derivatives to protect copper windings from sulfide formation, which can erode dielectric strength. The increasing use of copper in renewable-energy gearboxes and solar-thermal storage systems is expanding the metal deactivator market beyond automotive and aviation applications.
Stricter Oxidation-stability Regulations
ASTM D1655-22a, the governing specification for aviation turbine fuels, limits metal deactivator additives to 2.0 mg/L initially and 5.7 mg/L cumulatively, while requiring a Visual Tube Rate below 3 and an Electron Transfer Reaction below 85 nm in ASTM D3241 thermal-oxidation stability tests[2]ASTM International, “Standard Specification for Aviation Turbine Fuels, ASTM D1655-22a,” astm.org. ASTM D8545, revised in January 2025, standardized the test method for quantifying N, N'-disalicylidene-1,2-propanediamine in aviation fuel, enabling stricter quality control at refineries and fuel-distribution terminals. India's Bharat Stage VI norms, effective April 2020 and enforced through 2025, cap diesel sulfur at 10 ppm, requiring refiners to hydrotreat aggressively, which removes natural antioxidants and increases reliance on synthetic metal deactivators to stabilize fuel during storage and distribution. Europe's upcoming Euro 7 emissions regulation, expected to be finalized in 2027, will impose stricter particulate-matter and NOx limits, compelling fuel suppliers to reformulate with deposit-control additives, including metal passivators, to prevent injector fouling in high-pressure direct-injection systems.
Rising Adoption of Aviation and Marine Fuels
Middle-Eastern aviation hubs, such as Dubai, Doha, and Riyadh, are increasing jet-fuel throughput to support passenger growth, driving demand for metal deactivators that ensure thermal stability in high-temperature storage and high-altitude flight conditions where fuel temperatures can exceed 200°C. Shell's jet-fuel additive portfolio identifies metal deactivators as critical for improving thermal stability by mitigating dissolved trace metals, particularly copper, that impair fuel performance in both civil and military aviation. The JP-8+100 fuel additive package, evaluated by Australia's Defense Science and Technology Organization in 2001 and still relevant in 2025 military procurement, includes N, N'-disalicylidene-1,2-propanediamine as a core metal deactivator, achieving an 81-88% reduction in carbonaceous deposits at 250-350°C across various fuel chemistries. Marine fuels post-IMO 2020, particularly very-low-sulfur fuel oil blends, exhibit metal contamination from vanadium, nickel, and iron, which accelerates asphaltene aggregation and combustion-chamber fouling. Metal deactivators are increasingly blended with dispersants to manage these contaminants in large two-stroke diesel engines.
Restraints Impact Analysis*
| Restraint | (~) % Impact on CAGR Forecast | Geographic Relevance | Impact Timeline |
|---|---|---|---|
| Stringent environmental limits on additive chemistries | -0.8% | Europe, North America | Short term (≤ 2 years) |
| Volatile raw-material prices | -0.6% | Global | Medium term (2-4 years) |
| Nano-cerium oxide antioxidants as substitutes | -0.3% | Asia-Pacific, North America | Long term (≥ 4 years) |
| Shift to solid-state batteries curbing dielectric-fluid demand | -0.4% | Global, concentrated in Asia-Pacific and North America | Long term (≥ 4 years) |
| Source: Mordor Intelligence | |||
Stringent Environmental Limits on Additive Chemistries
The European Chemicals Agency added benzotriazole to its PBT watchlist in 2025, initiating endocrine-disruption studies and signaling potential future concentration limits. REACH Annex XVII amendments in the same year restricted 16 CMR substances, including diphenyl(2,4,6-trimethylbenzoyl)phosphine oxide, reducing formulation options for phosphorus-based deactivators. ECHA’s draft Authorization List includes melamine and phosphine-oxide compounds with sunset periods as short as 36 months, necessitating rapid reformulations. The EU Restrictions Roadmap flagged tire antioxidant 6PPD for aquatic toxicity, reflecting regulators’ inclination to group additives under broad bans. Rising compliance costs for testing and labeling discourage smaller blenders, consolidating market power among global additive manufacturers with dedicated regulatory teams.
Volatile Raw-material Prices
Fluctuations in raw-material prices remain a significant challenge. Salicylaldehyde and 1,2-propanediamine, precursors for N, N'-disalicylidene-1,2-propanediamine, are petrochemical derivatives subject to crude-oil price volatility and feedstock availability constraints. Benzotriazole and tolyltriazole production depends on aniline and nitrous acid, both of which faced supply shortages in 2024-2025 due to capacity shutdowns in China and Europe, driving up spot prices and compressing margins for additive manufacturers. Phosphorus-based metal deactivators, such as phosphorodithioates, are affected by feedstock volatility from phosphorus pentasulfide and alcohol intermediates. This issue has been exacerbated by China's environmental regulations on yellow-phosphorus production, which have reduced global supply. Additionally, currency fluctuations and logistics bottlenecks in the Asia-Pacific region introduce further cost uncertainties for formulators sourcing raw materials internationally.
*Our forecasts treat driver/restraint impacts as directional, not additive. The impact forecasts reflect baseline growth, mix effects, and variable interactions.
Segment Analysis
By Type: Fuel Additives Sustain Leadership as Regulations Tighten
Fuel additives accounted for 46.71% of the metal deactivator market size in 2025 and are expected to maintain their dominance with a 6.84% CAGR through 2031. This dominance is attributed to factors such as ultra-low-sulfur diesel requirements, jet-fuel thermal stability limits, and the TOP TIER+ gasoline protocol, which incorporates metal passivation into deposit-control formulations. Lubricant additives benefit from the growing adoption of synthetic oils and the launch of hydrogen engines, which require effective copper inhibition. Polymer stabilizers, though niche, are essential for wire-and-cable insulation to address copper-contact degradation. Other smaller segments include metalworking fluids, where water-borne coolants require copper and aluminum protection to meet OEM corrosion standards.
OEMs are increasingly prioritizing multifunctional chemical packages that combine metal deactivators with detergents and antioxidants to meet certifications such as TOP TIER+ Revision G or MIL-PRF-25017. Examples include BASF’s Keropur gasoline series and Afton’s HiTEC 65522, which integrate nitrogen chelators with deposit inhibitors to address injector fouling and stochastic pre-ignition in GDI engines. Regulatory dosage limits, such as 2.0 mg/L initial and 5.7 mg/L cumulative in jet fuel, are driving innovation toward high-affinity nitrogen chelators that deliver efficacy at lower treat rates, sustaining advancements in the metal deactivator industry.


By Chemistry: Nitrogen-based Chelating Agents Gaining Dominance
Nitrogen-based chelating agents held 35.27% of the metal deactivator market share in 2025 and are projected to grow at a 7.22% CAGR through 2031. Compounds like N, N'-disalicylidene-1,2-propanediamine meet ASTM D1655-22a jet-fuel standards at low concentrations of 2–5 ppm, while benzotriazole derivatives dominate transformer-oil passivation. Their compatibility with bio-esters and Environmentally Acceptable Lubricants supports demand, particularly as EU ports enforce OSPAR guidelines. Sulfur-based compounds remain relevant in heavy-duty diesel applications requiring extreme-pressure performance, but their long-term potential is limited by tightening sulfur regulations under Euro 7 and Bharat Stage VI standards. Phosphorus-based agents face significant challenges due to EU restrictions on certain phosphine oxides under CMR classifications.
Research is advancing hybrid systems that combine benzotriazole with borated dispersants, offering dual benefits of metal passivation and antioxidancy while reducing aquatoxicity. Studies from 2026 highlight nitrogen-doped nano-cerium oxide, which provides a 40-fold increase in radical-scavenging capacity, suggesting a potential future pathway where oxidation control surpasses chelation needs. The market for nitrogen-based metal deactivators is expected to expand further, supported by OEM preferences for ester-based fluids in EV drivetrains.
By Application: Jet Fuel Becomes Fastest-Growing Use Case
Gasoline accounted for 39.46% of global consumption in 2025, but jet fuel is projected to grow at the fastest rate, with a 7.38% CAGR through 2031, driven by the expansion of Middle-Eastern aviation hubs and defense fleets. The jet fuel segment benefits from U.S. Navy initiatives to reduce copper contamination below 10 ppb on carriers, increasing demand for solid-supported polyamine filters and high-affinity chelators. Diesel remains a significant segment due to the loss of natural antioxidants during ultra-low-sulfur fuel hydrotreating, which necessitates copper passivation to prevent gum formation. Transformer oil and turbine oil applications are growing steadily, supported by grid retro-fill projects and peaker-plant installations requiring long-term oxidation stability. Polymer stabilizers for wire insulation and EV charging cables are gaining traction as copper contact accelerates polyolefin degradation.
Fast-charging EV coolants represent an emerging application, where copper leaching increases fluid conductivity, prompting OEMs to specify metal deactivators in dielectric fluids that also meet flammability and low-viscosity requirements. Overall, targeted application engineering ensures diversification in the metal deactivator market, reducing reliance on any single fluid class.
By End-user Industry: Aerospace and Defense Posts the Highest Growth
The automotive and transportation industry dominated the market with a 41.01% share in 2025, supported by the global light-vehicle fleet and fuel-additive treat rates. However, aerospace and defense are expected to grow the fastest, with a 7.47% CAGR through 2031, driven by MIL-PRF-25017 jet-fuel specifications that limit copper content and mandate passivation. OEM turbine manufacturers increasingly link warranty coverage to additive compliance, boosting adoption. The oil and gas industry uses deactivators for pipeline corrosion control and refinery blending, while industrial equipment relies on copper inhibition to extend compressor-oil life. Energy utilities modernizing aging transformers sustain demand for benzotriazole, and marine operators blending very-low-sulfur fuel with residual oils require metal deactivators to mitigate vanadium and nickel catalysts in two-stroke engines.
As hydrogen internal combustion engines gain traction, companies like Afton are positioning products such as HiTEC 12582 to address water management and corrosion challenges unique to hydrogen combustion. Diversified downstream applications help mitigate risks associated with declining fossil fuel volumes.
Geography Analysis
Asia-Pacific accounted for 44.67% of 2025 revenue and is forecast to maintain the fastest 7.22% CAGR through 2031. China’s 936-million-ton-per-annum refining capacity, coupled with ASEAN’s double-digit aviation growth, keeps the metal deactivator market size in the region expanding briskly. India’s Bharat Stage VI diesel sulfur cap at 10 ppm strips natural antioxidants, pushing refiners to adopt metal passivation in storage and distribution. South Korea’s dense fast-charging network faces copper leaching in EV cooling loops, accelerating demand for dielectric coolants with chelators. Local additive production under Make-in-India and Chinese localization programs shifts supply dynamics, giving regional formulators margin room while global majors protect OEM approvals.
North America is anchored by stringent EPA Tier 3 gasoline standards that elevate treat rates and by the Department of Defense's focus on copper contamination in JP-5 fuels. The metal deactivator market share in aviation fuels climbs as carrier groups retrofit piping and implement additive filtration to cut maintenance costs. Electric-vehicle OEMs specify copper passivation in battery thermal fluids to avert conductivity drift, adding incremental demand. Mature regulatory pathways and near-term Euro-7-type proposals in Canada create predictable but elevated compliance costs.
Europe faces the tightest regulatory squeeze. REACH scrutiny of benzotriazole and new Annex XVII CMR listings lower formulation latitude, nudging users toward alternative nitrogen chemistries. Transformer retro-fill projects in Germany and France maintain steady benzotriazole pull, but potential PBT designation threatens long-run volumes. The Netherlands’ freshwater EQS of 97 µg/L for benzotriazole foreshadows wastewater-discharge permits that may spur closed-loop systems or substance substitution. Overall, European demand steadies on advanced automotive and aerospace applications even as compliance barriers rise.
Other regions contribute niche but strategic value. The Middle-East scales jet-fuel throughput in Dubai, Doha, and Riyadh, elevating passivator demand in hot-storage conditions. South America benefits from biodiesel mandates and offshore platforms employing metal-deactivator-treated drilling fluids. Africa’s uptake remains moderate, centered on South African mining hydraulics and aging transformer fleets.

Competitive Landscape
The metal deactivator market is moderately concentrated, with the top five players, including BASF, Innospec, Lubrizol, Afton Chemical, and Infineum. These incumbents wield OEM-approval networks, vertically integrated antioxidant and dispersant lines, and regulatory-affairs expertise that present high switching costs for blenders. Strategic launches in 2025, including BASF Keropur and Afton HiTEC 65522, underscore competition on holistic deposit-control rather than isolated passivation performance. Patent filings on benzotriazole-borated dispersants and nano-cerium stabilizers reveal hedging strategies against possible REACH bans on aromatic amines.
Regional challengers such as Dorf Ketal and King Industries compete on tailored formulations and agile supply within Asia-Pacific but lack global OEM placements. Innovation also surfaces from academic-industry consortia developing nitrogen-doped nano-cerium particles that offer outsized radical-scavenging at low treat rates, a potential disruptive substitute in applications prioritizing oxidative stability over chelation. Military programs, notably the U.S. Navy SBIR, explore shipboard filtration systems embedding solid-supported polyamines to achieve sub-10 ppb copper without breaching ASTM D3241 limits, hinting at non-chemical competitive threats.
Market entrants face twin barriers of REACH data packages and ASTM or MIL test batteries costing up to USD 2 million per product line. Consequently, consolidation or collaboration remains the prevalent path to market, with majors acquiring niche technology providers to fold into multifunctional packages that enhance Metal deactivator market share across lubricants, fuels, and dielectric fluids.
Metal Deactivator Industry Leaders
BASF
Afton Chemical
Infineum International Limited
Innospec
Lubrizol
- *Disclaimer: Major Players sorted in no particular order

Recent Industry Developments
- March 2026: Bodo Möller Chemie GmbH signed a supply contract to provide advanced adhesive technology systems to multiple Airbus facilities worldwide. This agreement highlighted the growing demand for adhesive solutions, which often incorporate metal deactivators to enhance performance in aerospace applications.
- May 2025: ProFluid, LLC partnered with Yasho Industries Limited to become the exclusive distributor and sales agent for Yasho’s specialized lubricant, grease, and metalworking additives in North America. Through its division, Vertical Chemical Solutions (VCS), ProFluid will distribute Yasho Industries Limited's products, such as metal deactivators and corrosion inhibitors, expanding supply options for regional manufacturers.


Global Metal Deactivator Market Report Scope
Metal deactivators are additives designed to neutralize the catalytic effects of trace metals such as copper, iron, and vanadium in fuels, lubricants, and plastics. They function by inhibiting oxidation, corrosion, and sludge formation through chelating metal ions or forming protective films on metal surfaces, thereby extending the product's lifespan.
The Metal Deactivators Market is segmented into type, chemistry, application, end-user industry, and geography. By type, the market is segmented into fuel additives, lubricant additives, polymer stabilizers, and other types (coatings, metalworking fluids). By chemistry, the market is segmented into nitrogen-based chelating agents, sulfur-based compounds, phosphorus-based compounds, amine derivatives, and other metal passivating agents. By application, the market is segmented into gasoline, diesel, jet fuel, turbine and compressor oils, transformer and insulating oils, polymer and plastic stabilizers, and other applications (coolants, greases, coatings). By end-user industry, the market is segmented into automotive and transportation, oil and gas and refining, industrial equipment and manufacturing, aerospace and defense, energy and utilities, marine, and other end-user industries (electronics, plastics, power). The report also covers the market size and forecasts for metal deactivators in 17 countries across major regions. For each segment, the market sizing and forecasts have been done on the basis of value (USD).
| Fuel Additives |
| Lubricant Additives |
| Polymer Stabilizers |
| Other Types (Coatings, Metalworking Fluids) |
| Nitrogen-based Chelating Agents |
| Sulfur-based Compounds |
| Phosphorus-based Compounds |
| Amine Derivatives |
| Other Metal Passivating Agents |
| Gasoline |
| Diesel |
| Jet Fuel |
| Turbine and Compressor Oils |
| Transformer and Insulating Oils |
| Polymer and Plastic Stabilizers |
| Other Applications (Coolants, Greases, Coatings) |
| Automotive and Transportation |
| Oil and Gas and Refining |
| Industrial Equipment and Manufacturing |
| Aerospace and Defense |
| Energy and Utilities |
| Marine |
| Other End-user Industries (Electronics, Plastics, Power) |
| Asia-Pacific | China |
| India | |
| Japan | |
| South Korea | |
| ASEAN Countries | |
| Rest of Asia-Pacific | |
| North America | United States |
| Canada | |
| Mexico | |
| Europe | Germany |
| United Kingdom | |
| France | |
| Italy | |
| Spain | |
| Russia | |
| NORDIC Countries | |
| Rest of Europe | |
| South America | Brazil |
| Argentina | |
| Rest of South America | |
| Middle-East and Africa | Saudi Arabia |
| South Africa | |
| Rest of Middle-East and Africa |
| By Type | Fuel Additives | |
| Lubricant Additives | ||
| Polymer Stabilizers | ||
| Other Types (Coatings, Metalworking Fluids) | ||
| By Chemistry | Nitrogen-based Chelating Agents | |
| Sulfur-based Compounds | ||
| Phosphorus-based Compounds | ||
| Amine Derivatives | ||
| Other Metal Passivating Agents | ||
| By Application | Gasoline | |
| Diesel | ||
| Jet Fuel | ||
| Turbine and Compressor Oils | ||
| Transformer and Insulating Oils | ||
| Polymer and Plastic Stabilizers | ||
| Other Applications (Coolants, Greases, Coatings) | ||
| By End-user Industry | Automotive and Transportation | |
| Oil and Gas and Refining | ||
| Industrial Equipment and Manufacturing | ||
| Aerospace and Defense | ||
| Energy and Utilities | ||
| Marine | ||
| Other End-user Industries (Electronics, Plastics, Power) | ||
| By Geography | Asia-Pacific | China |
| India | ||
| Japan | ||
| South Korea | ||
| ASEAN Countries | ||
| Rest of Asia-Pacific | ||
| North America | United States | |
| Canada | ||
| Mexico | ||
| Europe | Germany | |
| United Kingdom | ||
| France | ||
| Italy | ||
| Spain | ||
| Russia | ||
| NORDIC Countries | ||
| Rest of Europe | ||
| South America | Brazil | |
| Argentina | ||
| Rest of South America | ||
| Middle-East and Africa | Saudi Arabia | |
| South Africa | ||
| Rest of Middle-East and Africa | ||


Key Questions Answered in the Report
What is the size of the metal deactivator market?
The metal deactivator market stands at USD 2.04 billion in 2026 and is forecast to reach USD 2.80 billion by 2031.
Which type holds the largest metal deactivator market share in 2025?
Fuel additives command 46.71% of 2025 revenue due to ultra-low-sulfur diesel and aviation stability mandates.
Why are nitrogen-based chelating agents gaining momentum through 2031?
They show strong compatibility with bio-based lubricants and meet jet-fuel thermal stability at low treat rates, driving a 7.22% CAGR to 2031.
Which application will grow fastest through 2031?
Jet fuel is expected to post a 7.38% CAGR through 2031 as aviation hubs and military fleets tackle copper-induced deposit issues.
Page last updated on:


