Water Recycle and Reuse Market Size and Share
Market Overview
| Study Period | 2021 - 2031 |
|---|---|
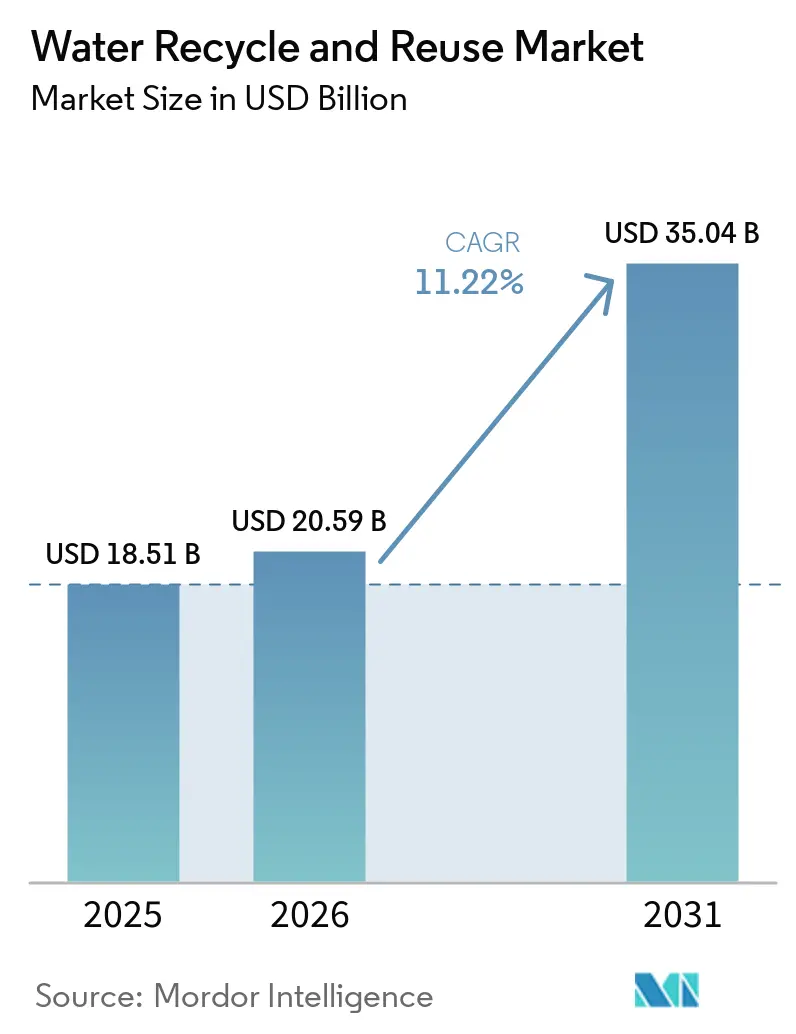
| Market Size (2026) | USD 20.59 Billion |
| Market Size (2031) | USD 35.04 Billion |
| Growth Rate (2026 - 2031) | 11.22% CAGR |
| Fastest Growing Market | Asia-Pacific |
| Largest Market | Asia-Pacific |
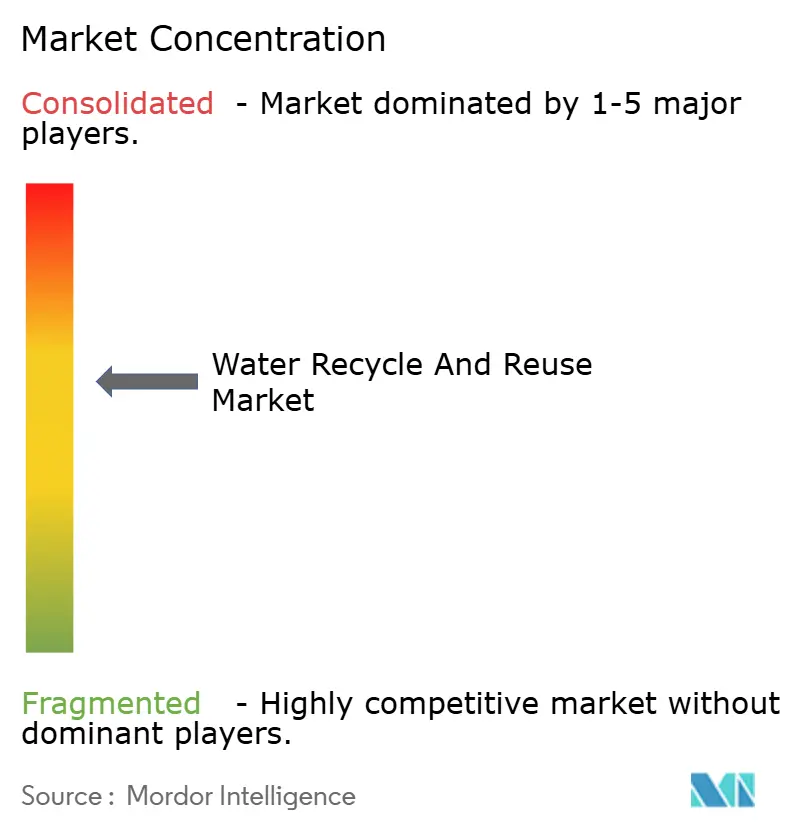
| Market Concentration | Medium |
Major Players *Disclaimer: Major Players sorted in no particular order Image © Mordor Intelligence. Reuse requires attribution under CC BY 4.0. | |
Water Recycle and Reuse Market Analysis by Mordor Intelligence
The Water Recycle And Reuse Market size is expected to grow from USD 18.51 billion in 2025 to USD 20.59 billion in 2026 and is forecast to reach USD 35.04 billion by 2031 at 11.22% CAGR over 2026-2031. This robust growth is driven by three interconnected factors: stringent wastewater discharge regulations across major regions, a surge in corporate commitments to circular water initiatives, and an escalating demand for ultra-pure recycled feedstock, particularly in semiconductor and green hydrogen sectors. While membrane filtration accounted for 45.28% of global revenue in 2025, biological treatment emerged as the fastest-growing technology. This is largely due to membrane bioreactor (MBR) retrofits, which reduce footprints and energy consumption in aging municipal plants. In 2025, municipal wastewater constituted just over half of the total influent, but industrial effluent is on the rise, especially as electronics and data center operators chase zero-liquid-discharge goals. The Asia-Pacific region led the spending spree with a 45.22% share in 2025, bolstered by mandates in China and India pushing for 20-60% water reuse by 2030. While non-potable applications continue to dominate, direct potable reuse is witnessing a surge in adoption. This shift follows the approval of pathogen-log-reduction protocols by regulators in California and Colorado, allowing advanced-treated effluent to skip traditional environmental buffers.
Key Report Takeaways
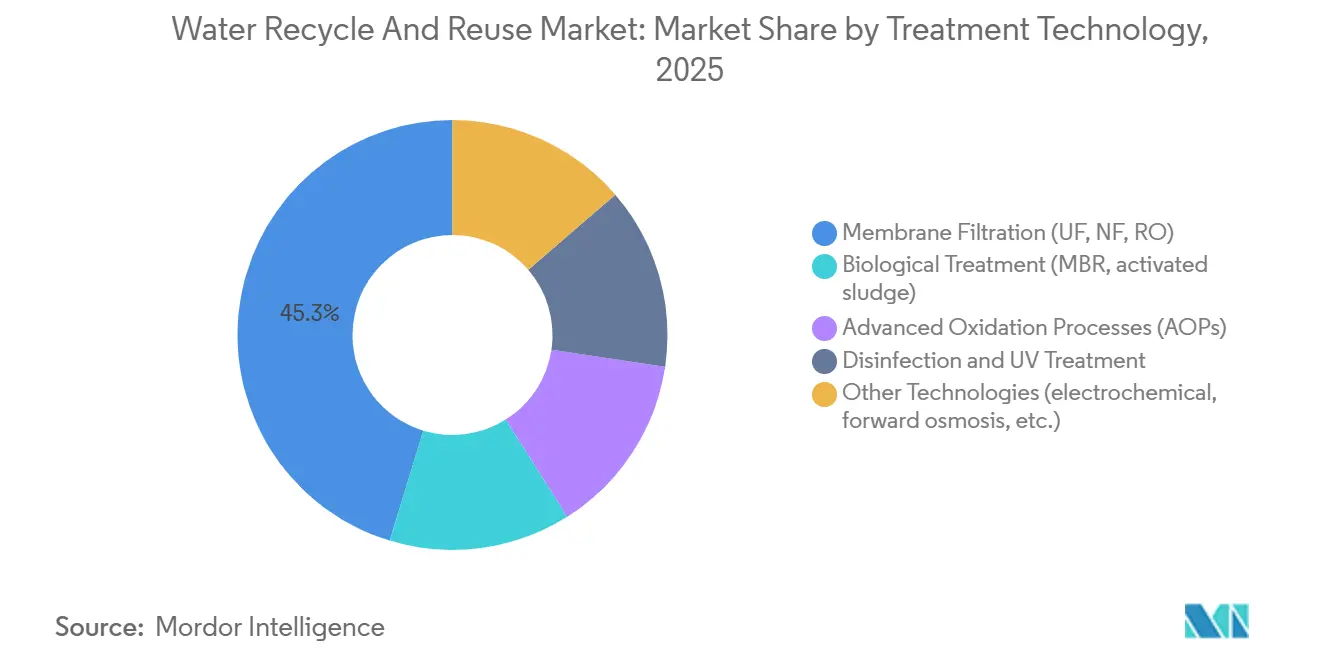
- By treatment technology, membrane filtration led with a 45.28% revenue share in 2025; biological treatment is projected to post a 12.11% CAGR from 2026 to 2031.
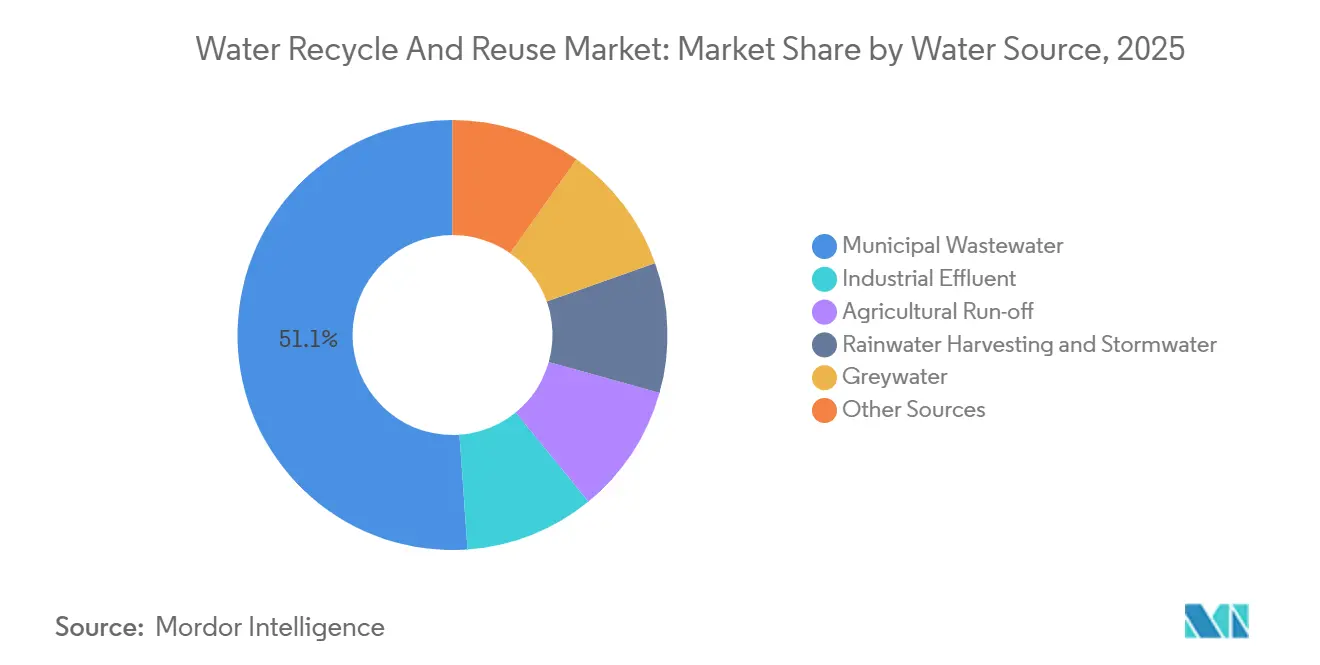
- By water source, municipal wastewater held 51.11% of the water recycle and reuse market share in 2025, while industrial effluent will expand at a 12.72% CAGR from 2026 to 2031.
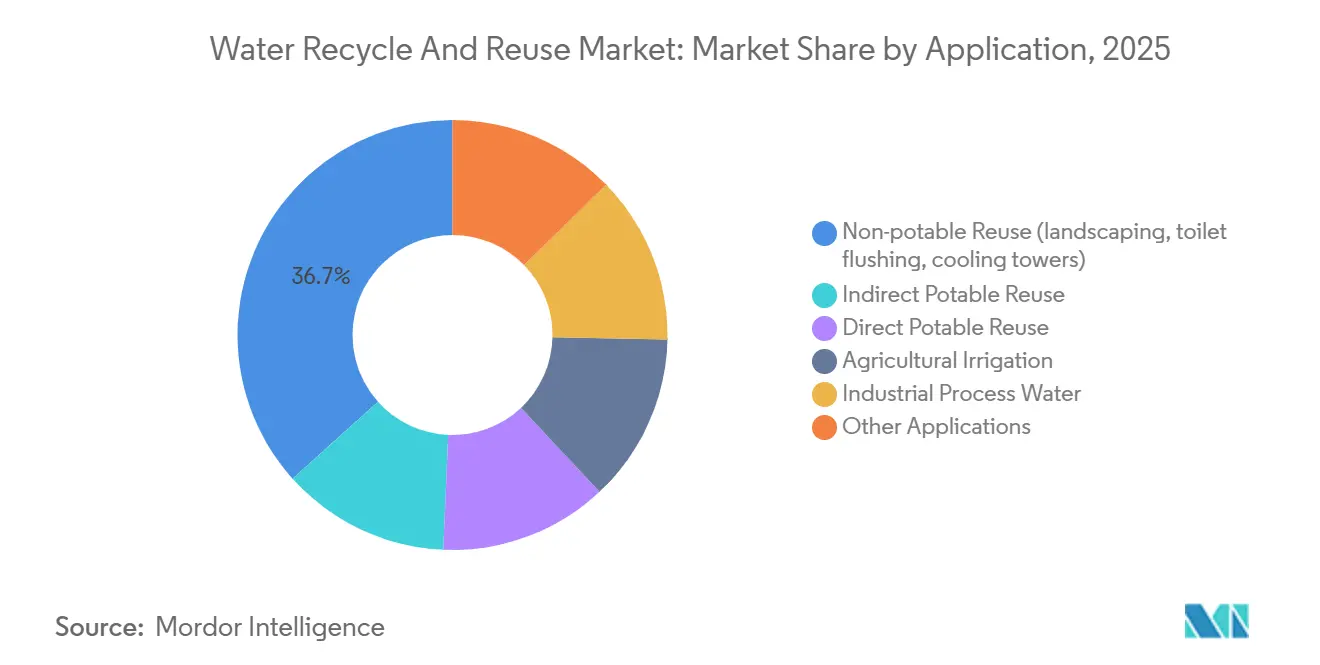
- By application, non-potable reuse commanded 36.65% of 2025 demand, while direct potable reuse is forecast to advance at a 13.11% CAGR from 2026 to 2031.
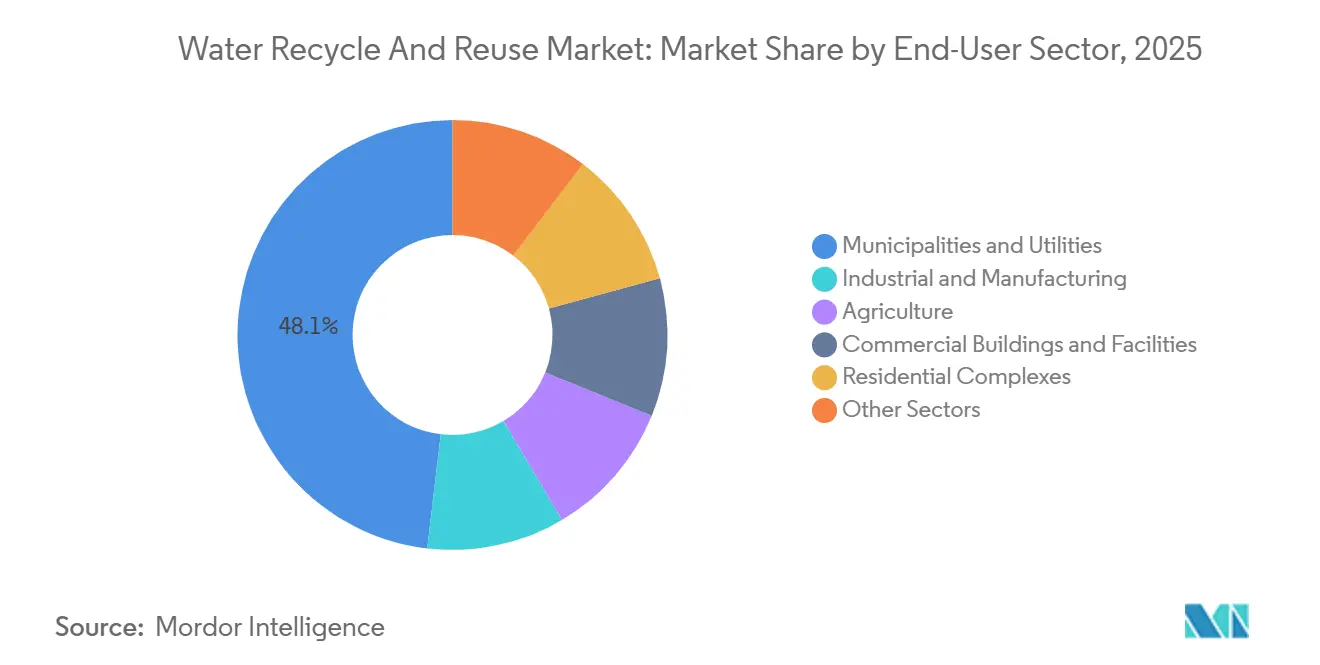
- By end-user sector, municipalities and utilities accounted for 48.12% of 2025 revenue; industrial and manufacturing users represent the fastest growth at a 12.93% CAGR from 2026 to 2031.
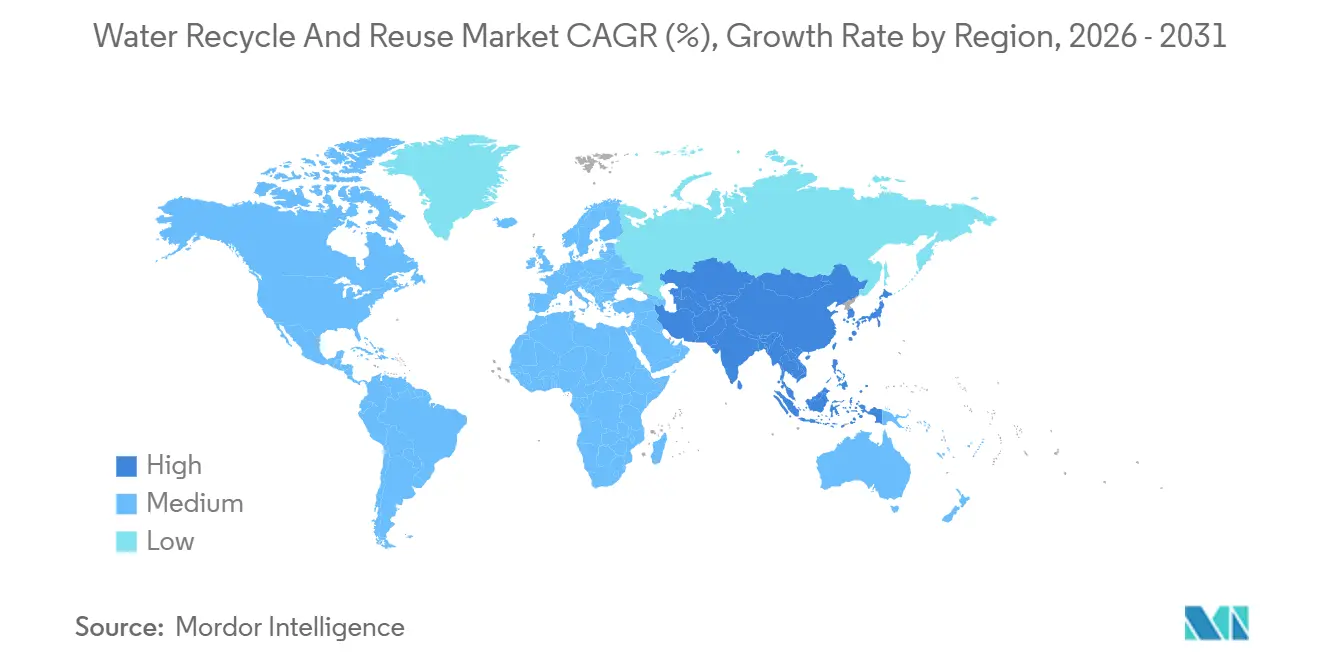
- By geography, Asia-Pacific captured 45.22% of 2025 spending and is expected to grow at a 13.38% CAGR from 2026 to 2031.
Note: Market size and forecast figures in this report are generated using Mordor Intelligence’s proprietary estimation framework, updated with the latest available data and insights as of January 2026.
Global Water Recycle and Reuse Market Trends and Insights
Drivers Impact Analysis*
| Driver | ( ~ ) % Impact on CAGR Forecast | Geographic Relevance | Impact Timeline |
|---|---|---|---|
| Stricter discharge and reuse mandates | +2.8% | Global, early enforcement in EU, California, India | Medium term (2-4 years) |
| Corporate circular-water and ESG commitments | +2.1% | North America, Europe | Short term (≤ 2 years) |
| Growth of tertiary membrane-based retrofits | +1.9% | North America, Asia-Pacific | Medium term (2-4 years) |
| Demand for ultra-pure recycled water in green hydrogen | +1.6% | APAC core, Middle East, South America | Long term (≥ 4 years) |
| AI-driven OPEX optimization in decentralized plants | +1.4% | North America, Europe, select APAC metros | Short term (≤ 2 years) |
| Source: Mordor Intelligence | |||
Stricter Discharge and Reuse Mandates
California's 2024 rule on direct potable reuse permits advanced-treated effluent into distribution mains, provided a 12-log virus removal is demonstrated[1]California State Water Resources Control Board, “Direct Potable Reuse Regulations,” waterboards.ca.gov. This change can cut project timelines by up to two years and lessen capital intensity by 20%. In India, Uttar Pradesh mandates a 60% reuse of municipal wastewater by 2030, leading to MBR tenders valued at an estimated USD 300 million. The European Union ties disbursements from its cohesion fund to minimum reuse benchmarks, prompting quicker retrofits in Spain and Italy. New U.S. caps on PFAS in drinking water, set at 4 ppt, compel utilities to augment reverse-osmosis trains with granular activated carbon. This adjustment raises operating costs by USD 0.15-0.25 per m³. While compliance is expected to peak in the medium term, with municipalities needing to complete engineering studies and secure financing, some smaller utilities might push their deadlines to 2029.
Corporate Circular-Water and ESG Commitments
Fortune 500 companies are responding to investor pressures, often exceeding regulatory compliance requirements. By 2030, Coca-Cola HBC plans to achieve a net-positive water footprint at its European plants, aiming for a 115% return of production volumes through on-site reuse and aquifer recharge[2]Coca-Cola Hellenic, “Net-Positive Water Commitment,” coca-colahellenic.com. PepsiCo reported that 23 of its facilities currently recycle over 80% of their process water, using advanced semiconductor-grade reverse osmosis even during beverage blending. In 2024, Intel’s Arizona fabs returned 94% of their freshwater withdrawals by employing multi-barrier treatment trains. Levi Strauss supported retrofits in textile mills, which reduced water use per garment by 96%, reflecting the influence of brand-driven initiatives. Most of these commitments are concentrated in OECD markets, where ESG-linked credit lines provide financial incentives in the short term. However, replication in emerging markets remains limited due to weaker disclosure regulations.
Growth of Tertiary Membrane-Based Retrofits
Utilities are incorporating ultrafiltration and nanofiltration modules into legacy activated-sludge systems to comply with pathogen and nutrient limits without requiring additional land. United Utilities has awarded DuPont a GBP 40 million contract to retrofit a 50 MLD plant, aiming to reduce total suspended solids to below 1 mg/L and facilitate indirect potable reuse. Veolia’s station in Vitória, Brazil, combines MBR with reverse osmosis to support a petrochemical complex. This approach achieves a 94% recirculation rate, conserving 12 million m³ of freshwater annually. The U.S. Department of Defense has included membranes as baseline tertiary steps in their standards, driving demand across 400 domestic bases. Technological advancements, such as graphene-oxide coatings, are increasing flux by 40%, while metal-organic frameworks are extending membrane life to seven years, improving life-cycle economics. Adoption is primarily occurring in regions where aging infrastructure coincides with population growth, while smaller utilities facing capital constraints may delay implementation until 2028.
Demand for Ultra-Pure Recycled Water in Green-Hydrogen
Electrolyzers require feedwater with a conductivity of under 1 µS/cm. Reclaimed effluent can meet this requirement after undergoing reverse osmosis and electrodeionization polishing. Modeling from Princeton estimates the cost at USD 0.80-1.20 per m³, which is approximately 30% lower than desalination in coastal areas. Saudi Arabia’s USD 5 billion NEOM complex plans to source all its process water from treated municipal discharge. This approach reflects the increasing focus on water recycling while reducing reliance on the Red Sea's desalination capacity, allowing it to be allocated for drinking water. Australia’s Hydrogen Headstart program assesses proposals based on closed-loop water use, driving the establishment of on-site tertiary plants. In Chile’s Atacama region, projects integrate photovoltaic (PV) power with mobile membrane units to treat wastewater from mining camps for electrolyzer use. The scaling of hydrogen initiatives, particularly in the Middle East and Asia-Pacific, is projected to influence adoption trends after 2028.
Restraints Impact Analysis*
| Restraint | ( ~ ) % Impact on CAGR Forecast | Geographic Relevance | Impact Timeline |
|---|---|---|---|
| Integration issues with aging municipal networks | -1.2% | North America, Europe | Medium term (2-4 years) |
| Inconsistent potable-reuse quality regulations | -0.9% | U.S. states, EU member nations | Short term (≤ 2 years) |
| Cybersecurity risks in IoT-enabled reuse systems | -0.7% | North America, Europe, APAC metros | Short term (≤ 2 years) |
| Source: Mordor Intelligence | |||
Integration Issues with Aging Municipal Networks
Utilities retrofitting tertiary systems onto 1960s-era infrastructure are encountering corroded mains, undersized pumps, and outdated control logic, resulting in budget increases of 25-40%. In Spain and Italy, limitations in legacy SCADA platforms to support AI analytics are driving investments in parallel sensor networks, with costs ranging from EUR 200,000 to 500,000 (~USD 232,988 to 582,470) per network. Corrosion-related leaks are also introducing pathogens after advanced treatment, affecting public trust. These issues are primarily observed in North America and Europe, where the average network age exceeds 50 years. As renewal funding is implemented gradually, these challenges are likely to continue in the medium term.
Inconsistent Potable-Reuse Quality Regulations
California requires a 12-log virus removal for direct potable reuse, while Texas adheres to a 10-log standard. This difference drives the need for engineers to develop state-specific designs that are not transferable. In the EU, potable-reuse regulations are determined by member states, resulting in varied approaches: Spain allows indirect reuse with a six-month buffer, whereas Germany prohibits any potable reuse until federal legislation is enacted. These regulatory differences contribute to a 15-20% increase in design fees and extend the permitting timeline to three years. Model guidance from the EPA in 2024 is expected to influence alignment by 2027.
*Our forecasts treat driver/restraint impacts as directional, not additive. The impact forecasts reflect baseline growth, mix effects, and variable interactions.
Segment Analysis
By Treatment Technology: Membrane Dominance Meets Biological Revival
In 2025, membrane filtration accounted for 45.28% of the revenue, highlighting its role in applications ranging from ultrafiltration pretreatment and nanofiltration for hardness removal to reverse-osmosis polishing. Biological treatment is projected to grow at a 12.11% CAGR, driven by municipalities incorporating compact MBR cassettes into existing basins, which reduces footprints and lowers energy consumption by 20-30%. The market for membranes in water recycling and reuse is expected to expand as semiconductor fabs increase demand for specialty reverse-osmosis elements like DuPont’s Fortilife XC160UHP, which achieves a 99.8% boron rejection rate. Advanced oxidation processes are addressing trace pharmaceuticals in petrochemical effluents, while UV disinfection continues to serve as a cost-effective safety measure, priced at USD 0.02-0.05 per m³. The combined market share of forward osmosis, capacitive deionization, and electrochemical systems remains below 8%, but an increase in patent filings indicates potential for future competition.
Biological treatments are advancing with hybrid anaerobic-aerobic systems that enable biogas recovery for co-generation while complying with stricter nutrient regulations. The implementation of ISO 24521 guidelines is simplifying irrigation-reuse quality standards, supporting cross-border sales for membrane suppliers. Toray's 2025 acquisition of a Chinese RO integrator is expected to enhance local production capacity, targeting tier-2 municipal tenders where cost considerations influence decisions. Developments such as nanomaterial coatings, which improve flux by 40% and extend change-out intervals from five to seven years, are shifting procurement decisions toward life-cycle cost efficiency. As utilities adopt digital twins to optimize membrane cleaning, chemical dosing is decreasing, which is further driving growth in the water recycling and reuse market among cost-sensitive operators.


By Water Source: Municipal Anchor, Industrial Acceleration
In 2025, municipal wastewater accounted for 51.11% of the influent, supported by the benefits of centralized collection and public funding, which improve economies of scale. Industrial effluent is projected to grow at a 12.72% CAGR through 2031, driven by investments from semiconductor fabs, chemical plants, and hyperscale data centers in zero-liquid-discharge infrastructure to address freshwater risks. While the market size for water recycling and reuse from industrial effluent remains smaller than municipal sources, factors such as rising tariffs and ESG audits are encouraging adoption. Agricultural runoff is receiving increased attention, with decentralized membrane units being used to treat drainage for fertigation loops, particularly in water-stressed basins.
Rainwater and stormwater contribute less than 6% but are considered important for urban heat-island mitigation. For example, Singapore’s ABC Waters uses bioretention and polishing techniques to channel water into non-potable loops. Intel’s Arizona campus recycles 94% of its water withdrawals, demonstrating that industrial influent can meet potable standards when high-purity streams are segregated. In California, nitrate limits on recycled agricultural runoff are prompting growers to install denitrification reactors, increasing capital expenditure by USD 800-1,200 per hectare.
By Application: Non-Potable Dominates, Direct Potable Surges
In 2025, non-potable reuse represented 36.65% of the demand, driven by its simpler treatment requirements and the presence of dual-piping systems in commercial and industrial parks. Direct potable reuse is expected to grow at a rate of 13.11% annually, supported by regulatory approvals in California and Colorado for advanced-treated effluent to enter distribution mains, reducing delivery timelines by two years. Indirect potable reuse continues to hold a significant share, as public preference leans toward environmental buffers, although increasing storage costs are narrowing the difference.
In 2025, agricultural irrigation accounted for a sizeable share of recycled water volumes, with notable activity in regions such as Israel, Spain, and California. Industrial processes, including boiler feed and chip rinsing, are experiencing growth in demand. This trend is linked to manufacturers incorporating water scarcity considerations into site selection, which is increasing the market share of high-purity applications in water recycling and reuse. Despite assurances from the WHO regarding the safety of Class A treated produce, resistance to such irrigated products persists in certain parts of the EU.
By End-User Sector: Municipal Core, Industry Upshift
Municipalities contributed 48.12% of 2025's revenue, influenced by population growth and requirements for nutrient removal. The industrial and manufacturing sectors, supported by chipmakers, refineries, and food processors facing discharge fees exceeding USD 2.00 per m³, are projected to grow annually by 12.93%. The market for water recycling and reuse among industrial users is expected to expand, aided by public-private partnerships that reduce risks through long-term contracts. For example, Veolia’s Vitória plant has a 20-year agreement to supply petrochemicals.
The agriculture segment holds the largest volumetric share but accounts for a lower portion of the market's value due to low tariffs. On-site greywater systems in commercial buildings reduce potable water demand by up to 50%, with returns achieved in four to six years. In the residential segment, early adoption is observed in Bangalore, Singapore, and Perth, where state rebates cover half of the capital expenditure. However, overall adoption remains limited, below 3% of new constructions.
Geography Analysis
In 2025, the Asia-Pacific region accounted for 45.22% of global spending, with projections indicating a 13.38% CAGR through 2031. This growth is attributed to China's focus on achieving 30% municipal reuse and India's mandate of 60% in several states. Singapore's NEWater currently meets 40% of the nation's demand during dry spells. Additionally, K-water's USD 400 million smart-grid initiative is expected to reduce non-revenue losses to 5% by 2028. Japan's Tokyo Metropolitan is retrofitting 15 plants with energy-recovery turbines, reflecting efficiency upgrades in developed markets.
In the United States, California's approval of direct potable reuse is projected to unlock USD 2 billion in municipal projects by 2028. Arizona encourages fabs to enhance closed-loop systems by crediting recycled volumes against withdrawal permits. In Mexico, a tertiary-treatment rate of 38% highlights opportunities for retrofitting. Meanwhile, Canada's western provinces are exploring stormwater reuse to address wildfire resilience, although data availability remains limited.
Spain, supported by EU cohesion funds, recycles 15% of its effluent for citrus and vegetable cultivation. Germany's ban on potable reuse creates uncertainty for growth until legislative harmonization, which is anticipated after 2028. France is promoting industrial reuse by offering tax incentives to plants that reduce freshwater abstraction by 50%. Utilities in the United Kingdom are piloting MBR-based indirect reuse to address summer water supply challenges.
The Middle East and Africa together are experiencing notable growth. The UAE is targeting 95% reuse by 2036, while Saudi Arabia is working toward full recycling by 2040 as part of its Vision 2030 diversification strategy. South Africa is evaluating decentralized greywater units for informal settlements, although financing challenges are slowing progress. South America remains below 6%, with Brazil's São Paulo industrial corridor requiring zero-liquid discharge at new chemical facilities.

Competitive Landscape
The water recycle and reuse market demonstrates a moderately consolidated structure. The top five players, Veolia, Xylem, Ecolab Inc, DuPont, and Pentair, hold a sizeable share while leaving room for regional specialists. These companies are increasingly focusing on vertical integration by combining services such as membranes, chemicals, and digital analytics. For example, Veolia's acquisition of a Brazilian industrial-reuse portfolio, which achieves 94% recirculation at a petrochemical site, highlights the application of circular-water expertise beyond traditional concessions. Similarly, DuPont's planned January 2025 launch of the Fortilife XC160UHP reverse-osmosis element reflects a move toward application-specific membranes with proprietary dimensions and a 99.8% boron rejection rate.
Competition in technology focuses on flux rates, fouling resistance, and energy efficiency. Graphene-oxide films, which increase flux by 40% and extend replacement intervals, reduce total ownership costs and influence decisions toward next-generation modules. Additionally, AI-driven optimizations are reducing the advantages of scale. For instance, Xylem's Vue technology lowers chemical dosing by 18-25%, encouraging companies to acquire or collaborate with software startups. Patent filings in forward osmosis and capacitive deionization increased by 60% between 2023 and 2025, indicating potential for disruption in managing high-salinity waste streams.
Strategic activities are intensifying. In January 2026, Xylem completed a USD 7.5 billion acquisition of Evoqua, creating a USD 7 billion revenue leader across municipal and industrial sectors. Pentair is investing USD 150 million to expand its Minnesota membrane production by 30%, aiming to reduce lead times to ten weeks. Toray localized Chinese RO assembly through a 2025 acquisition to improve cost competitiveness in tier-2 cities. Smaller entrants are targeting overlooked opportunities by deploying mobile containerized MBR units for mining camps and disaster relief. With ongoing technological advancements and the top players holding less than 30% of the market share, competitive dynamics are expected to remain fluid through 2031.
Water Recycle and Reuse Industry Leaders
Ecolab Inc.
Pentair
Veolia
Xylem
DuPont
- *Disclaimer: Major Players sorted in no particular order

Recent Industry Developments
- January 2026: Xylem completed the USD 7.5 billion acquisition of Evoqua, forming a USD 7 billion revenue platform spanning membranes, analytics, and multi-year service contracts.
- December 2025: Veolia opened a 50 MLD reuse station in Vitória, Brazil, supplying petrochemicals with 94% recirculation under a 20-year PPP.


Global Water Recycle and Reuse Market Report Scope
Water recycling and reuse is the process of collecting, treating, and repurposing wastewater from municipal, industrial, or agricultural sources for beneficial uses. This practice conserves freshwater resources, reduces pollution, and provides a sustainable water supply for applications like irrigation, industrial cooling, or groundwater recharge.
The market is segmented by treatment technology, water source, application, and end-user sector. By treatment technology, the market is segmented into membrane filtration (including membrane filtration (UF, NF, and RO), biological treatment (including MBR and activated sludge), advanced oxidation processes (AOPs), disinfection and UV treatment, and other technologies (including electrochemical processes and forward osmosis). By water source, the market is segmented into municipal wastewater, industrial effluent, agricultural run-off, rainwater harvesting, stormwater, greywater, and other sources. By application, the market is segmented into non-potable reuse (including landscaping, toilet flushing, and cooling towers), indirect potable reuse, direct potable reuse, agricultural irrigation, industrial process water, and other applications. By end-user sector, the market is segmented into municipalities and utilities, industrial and manufacturing, agriculture, commercial buildings and facilities, residential complexes, and other sectors.The report also covers the market size and forecasts for water recycle and reuse in 16 countries across the world. For each segemnt market sizing and forecasts are provided in terms of value (USD).
| Membrane Filtration (UF, NF, RO) |
| Biological Treatment (MBR, activated sludge) |
| Advanced Oxidation Processes (AOPs) |
| Disinfection and UV Treatment |
| Other Technologies (electrochemical, forward osmosis, etc.) |
| Municipal Wastewater |
| Industrial Effluent |
| Agricultural Run-off |
| Rainwater Harvesting and Stormwater |
| Greywater |
| Other Sources |
| Non-potable Reuse (landscaping, toilet flushing, cooling towers) |
| Indirect Potable Reuse |
| Direct Potable Reuse |
| Agricultural Irrigation |
| Industrial Process Water |
| Other Applications |
| Municipalities and Utilities |
| Industrial and Manufacturing |
| Agriculture |
| Commercial Buildings and Facilities |
| Residential Complexes |
| Other Sectors |
| Asia-Pacific | China |
| India | |
| Japan | |
| South Korea | |
| Rest of Asia-Pacific | |
| North America | United States |
| Canada | |
| Mexico | |
| Europe | Germany |
| United Kingdom | |
| France | |
| Italy | |
| Rest of Europe | |
| South America | Brazil |
| Argentina | |
| Rest of South America | |
| Middle-East and Africa | United Arab Emirates |
| Saudi Arabia | |
| South Africa | |
| Rest of Middle-East and Africa |
| By Treatment Technology | Membrane Filtration (UF, NF, RO) | |
| Biological Treatment (MBR, activated sludge) | ||
| Advanced Oxidation Processes (AOPs) | ||
| Disinfection and UV Treatment | ||
| Other Technologies (electrochemical, forward osmosis, etc.) | ||
| By Water Source | Municipal Wastewater | |
| Industrial Effluent | ||
| Agricultural Run-off | ||
| Rainwater Harvesting and Stormwater | ||
| Greywater | ||
| Other Sources | ||
| By Application | Non-potable Reuse (landscaping, toilet flushing, cooling towers) | |
| Indirect Potable Reuse | ||
| Direct Potable Reuse | ||
| Agricultural Irrigation | ||
| Industrial Process Water | ||
| Other Applications | ||
| By End-user Sector | Municipalities and Utilities | |
| Industrial and Manufacturing | ||
| Agriculture | ||
| Commercial Buildings and Facilities | ||
| Residential Complexes | ||
| Other Sectors | ||
| By Geography | Asia-Pacific | China |
| India | ||
| Japan | ||
| South Korea | ||
| Rest of Asia-Pacific | ||
| North America | United States | |
| Canada | ||
| Mexico | ||
| Europe | Germany | |
| United Kingdom | ||
| France | ||
| Italy | ||
| Rest of Europe | ||
| South America | Brazil | |
| Argentina | ||
| Rest of South America | ||
| Middle-East and Africa | United Arab Emirates | |
| Saudi Arabia | ||
| South Africa | ||
| Rest of Middle-East and Africa | ||


Key Questions Answered in the Report
How large is the global Water Recycle and Reuse Market in 2026?
It is estimated at USD 20.59 billion in 2026, on track to reach USD 35.04 billion by 2031 at an 11.22% CAGR.
Which treatment technology currently generates the most revenue?
Membrane filtration leads with a 45.28% share thanks to its versatility from ultrafiltration to reverse osmosis.
Which application segment is expanding most quickly?
Direct potable reuse leads growth with a 13.03% CAGR as regulations and public acceptance advance.
Why is Asia-Pacific the largest regional market?
National mandates in China and India, paired with water-scarcity concerns and large industrial bases, gave Asia-Pacific 45.22% of 2025 spending and it is expected to grow at 13.38% CAGR.
Page last updated on:


