Scrap Metal Recycling Market Size and Share
Market Overview
| Study Period | 2021 - 2031 |
|---|---|
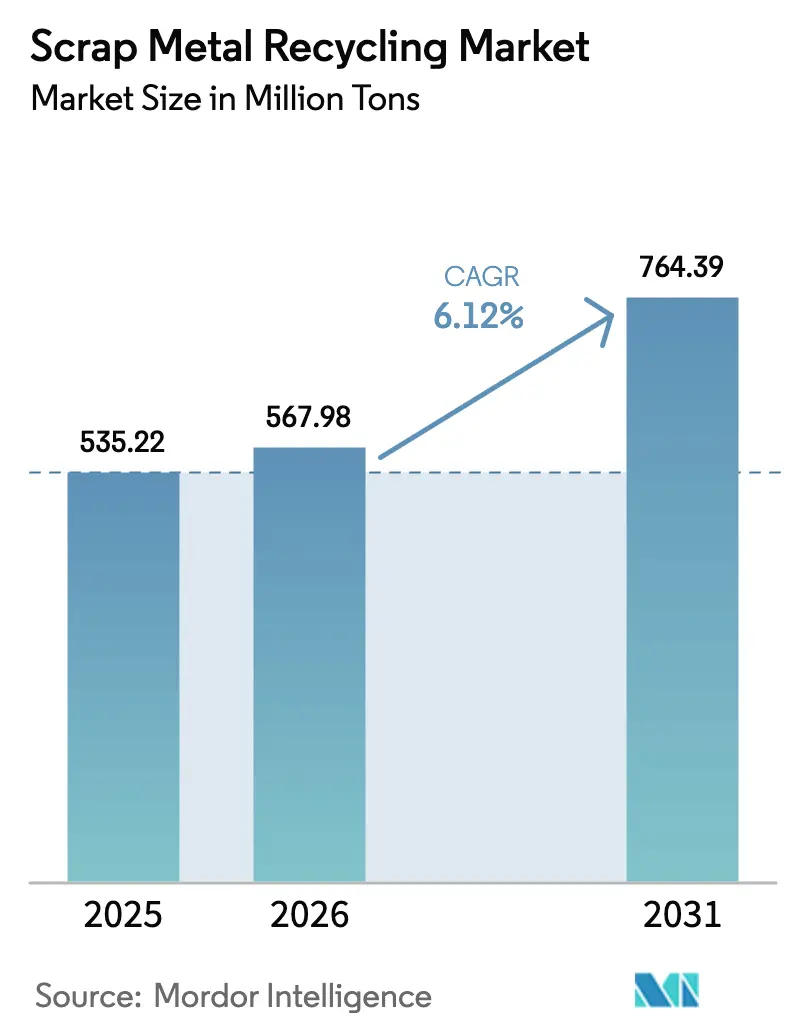
| Market Volume (2026) | 567.98 Million tons |
| Market Volume (2031) | 764.39 Million tons |
| Growth Rate (2026 - 2031) | 6.12% CAGR |
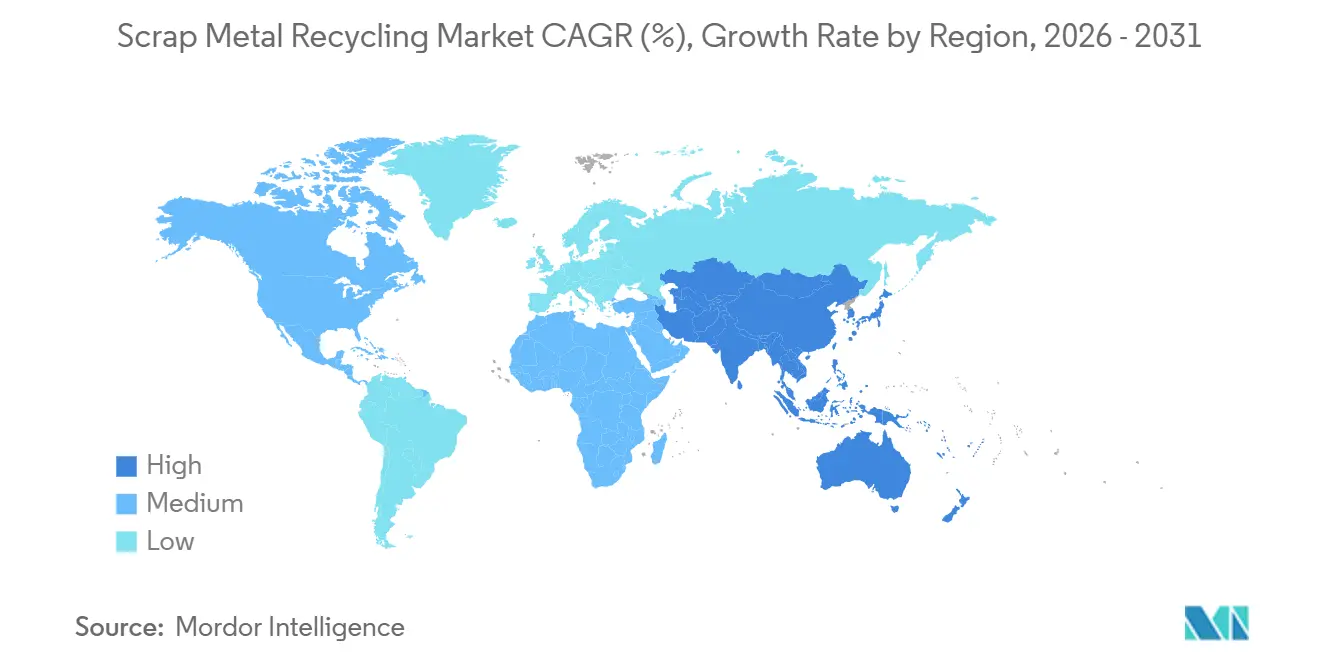
| Fastest Growing Market | Asia Pacific |
| Largest Market | Asia Pacific |
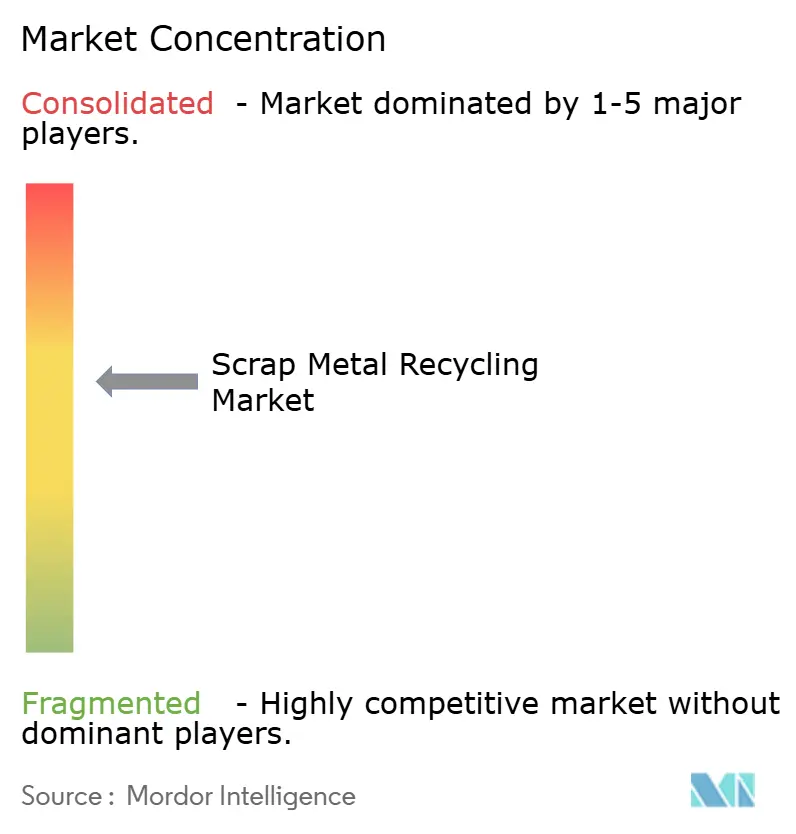
| Market Concentration | Medium |
Major Players *Disclaimer: Major Players sorted in no particular order Image © Mordor Intelligence. Reuse requires attribution under CC BY 4.0. | |
Scrap Metal Recycling Market Analysis by Mordor Intelligence
The Scrap Metal Recycling Market size is projected to expand from 535.22 Million tons in 2025 and 567.98 Million tons in 2026 to 764.39 Million tons by 2031, registering a CAGR of 6.12% between 2026 to 2031. Three structural factors are driving the near-term growth. First, the introduction of new electric arc furnaces (EAFs) in India, the Middle-East, and Southeast Asia is increasing domestic scrap consumption and reducing export volumes. Second, automotive and electronics original equipment manufacturers (OEMs) are securing low-residual contracts, which limit spot market availability. Third, the OECD's advocacy for open scrap trade is encouraging regulators to adopt uniform quality standards, although national export levies continue to create tight regional balances. These dynamics enhance the profitability of processors capable of maintaining copper content below 0.15% while disadvantaging facilities that still depend on manual sorting methods.
Key Report Takeaways
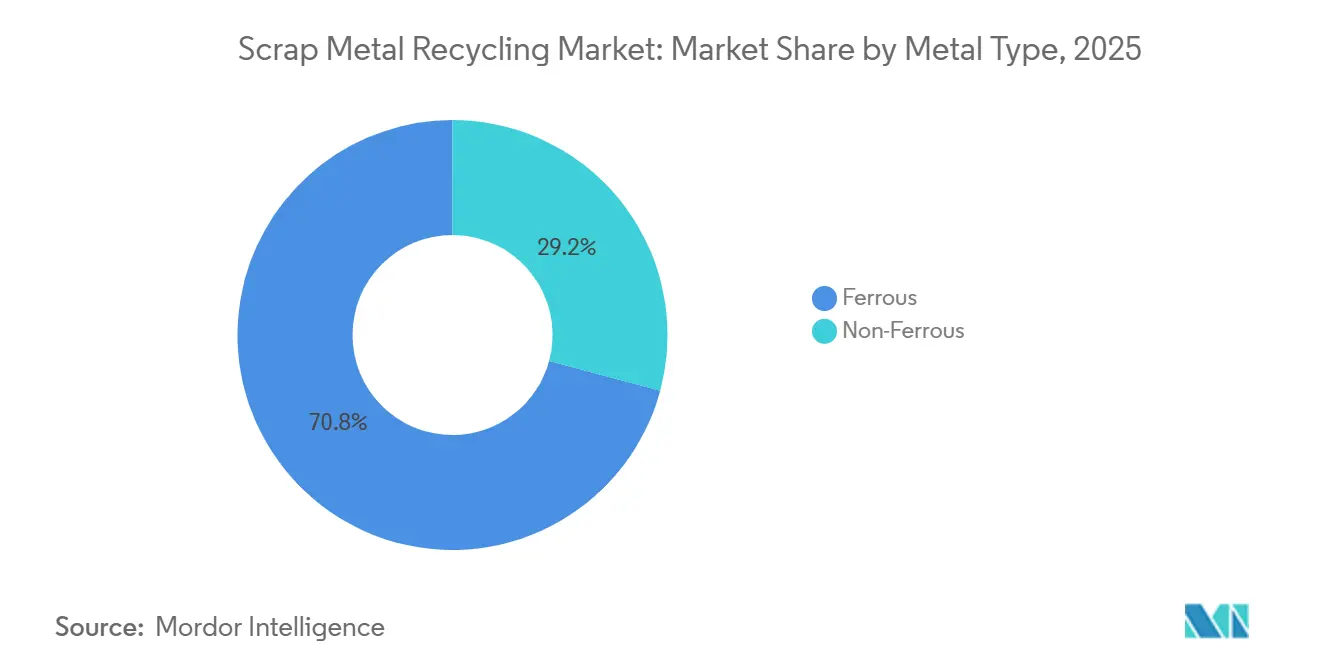
- By metal type, ferrous metals led with 70.82% of the scrap metal recycling market share in 2025; non-ferrous metals are forecast to expand at a 6.22% CAGR through 2031.
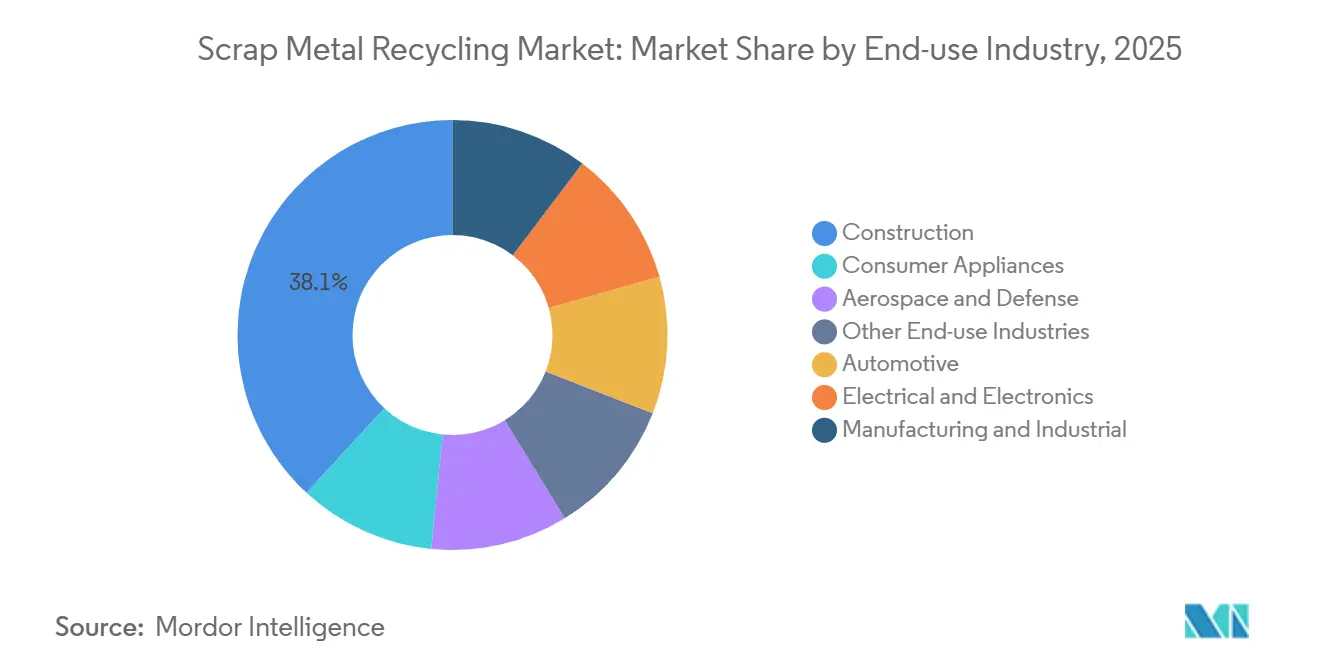
- By end-use industry, construction accounted for 38.11% of the scrap metal recycling market share in 2025, while electrical and electronics is advancing at a 6.33% CAGR through 2031.
- By geography, Asia-Pacific held 52.22% of the scrap metal recycling market share in 2025 and is projected to record a 6.73% CAGR to 2031.
Note: Market size and forecast figures in this report are generated using Mordor Intelligence’s proprietary estimation framework, updated with the latest available data and insights as of 2026.
Global Scrap Metal Recycling Market Trends and Insights
Drivers Impact Analysis*
| Driver | (~) % Impact on CAGR Forecast | Geographic Relevance | Impact Timeline |
|---|---|---|---|
| Rapid EAF capacity additions in India, MENA, and Southeast Asia | +1.8% | India, Saudi Arabia, UAE, Qatar, Indonesia, Vietnam, Malaysia | Medium term (2-4 years) |
| Vertically integrated mill M&A to secure captive scrap | +1.2% | Global, with concentration in North America, Europe, and Asia-Pacific | Short term (≤ 2 years) |
| AI-guided LIBS and hyperspectral sorting lifting recovery yield above 98% | +0.9% | North America, Europe, Japan, South Korea | Long term (≥ 4 years) |
| OEM closed-loop contracts for certified low-residual scrap | +1.1% | Europe, North America, China | Medium term (2-4 years) |
| OECD push for open scrap trade to hit 2050 net-zero steel targets | +0.8% | OECD member countries, spill-over to emerging markets | Long term (≥ 4 years) |
| Source: Mordor Intelligence | |||
Rapid EAF Capacity Additions in India, MENA, and Southeast Asia
EAF projects launched since 2024 have reshaped intra-Asian scrap flows. Tata Steel’s Punjab furnace alone increased local demand by 0.75 million tons in its first operational year, while Emirates Steel Arkan’s 3.5 million-ton Abu Dhabi plant redirected Gulf cargoes that previously went to Turkey. Between 2024 and 2025, Indonesia, Vietnam, and Malaysia added 2.8 million tons of new EAF capacity, absorbing Japanese scrap that previously moved to China. As these furnaces reach full capacity, the Scrap Metal Recycling Market faces challenges such as limited short-haul trucking capacity and higher premiums for prompt material within 300 kilometers of mill gates. Increased local demand is expected to boost collection rates in secondary cities where organized scrap chains were previously underdeveloped.
Vertically Integrated Mill M&A to Secure Captive Scrap
Steelmakers have accelerated acquisitions of scrap yards to secure supply following a 45% spike in pig-iron prices in early 2024, which compressed melt-shop margins. ArcelorMittal’s acquisition of half of Nippon Steel’s continental processing network ensures access to 2 million tons of certified feed while reducing transaction costs by at least USD 12 per ton. In the United States, Nucor’s David J. Joseph subsidiary acquired 12 Midwest yards in 2025, increasing throughput to 8 million tons and tightening the already-concentrated regional scrap pool. This wave of consolidation keeps the Scrap Metal Recycling Market dynamic for large buyers but leaves smaller independent players facing reduced spot availability and greater working-capital volatility.
AI-Guided LIBS and Hyperspectral Sorting Lifting Recovery Yield Above 98%
Advanced spectroscopic systems, such as Laser-Induced Breakdown Spectroscopy (LIBS) and hyperspectral sorting, now sample every shred on conveyor belts within milliseconds, improving grade accuracy from 94% to 98% and reducing copper contamination to below 0.1%. In 2024, Germany’s Fraunhofer ILT validated copper detection at line speeds of three meters per second. By 2025, commercial units from TOMRA and Steinert were operational in the United States and the United Kingdom, reducing re-melt downgrades by 40%. Despite payback periods of less than three years for high-volume processors, the USD 2–5 million cost of these systems has slowed adoption among small and medium enterprises (SMEs). Financing partnerships between original equipment manufacturers (OEMs) and equipment vendors could broaden adoption over the next five years, increasing the availability of premium-grade scrap in the market.
OEM Closed-Loop Contracts for Certified Low-Residual Scrap
Automotive, aerospace, and consumer electronics manufacturers are increasingly entering multi-year agreements to secure certified low-residual scrap with guaranteed chemistry, traceability, and carbon credentials. For example, Volvo Cars and Salzgitter AG’s 2024 ScanLoop agreement recycles end-of-life body panels into new sheets with copper content under 0.15%, significantly lower than mixed obsolete scrap. Similarly, Novelis’s 10-year agreement with Toyota Tsusho secures 200,000 tons of automotive aluminum scrap annually. These contracts help mitigate Scope 3 emissions and create a two-tier price structure in the Scrap Metal Recycling Market, favoring processors with ISO 14001 or RIOS certifications for chain-of-custody verification.
Restraints Impact Analysis*
| Restraint | (~) % Impact on CAGR Forecast | Geographic Relevance | Impact Timeline |
|---|---|---|---|
| Rising residual copper contamination limits EAF feed quality | -0.7% | Global, acute in North America, Europe, China | Medium term (2-4 years) |
| Wave of national export restriction laws shrinking tradable pool | -1.1% | Asia-Pacific (China, India, Indonesia), spill-over to global trade flows | Short term (≤ 2 years) |
| Scrap price volatility widening hedge costs for SMEs | -0.6% | Global, most acute in fragmented markets (South America, Africa, Southeast Asia) | Short term (≤ 2 years) |
| Source: Mordor Intelligence | |||
Rising Residual Copper Contamination Limits EAF Feed Quality
The average copper content in obsolete scrap rose to 0.35% in 2025, exceeding the 0.2% threshold that most long-product EAFs can tolerate without causing color defects. ThyssenKrupp reported an additional EUR 15 per ton in melt-shop costs after installing decopperization units at its Duisburg facility. As electric vehicle wiring density increases and printed circuit boards become more prevalent, processors must either invest in robotic separation technologies or accept downgrades into lower-value products like rebar. Japan’s trade ministry has introduced capital grants for automated copper extraction, aiming to reduce residual copper levels by 20% by 2028[1]METI, “Support Program for Copper-Separation Equipment,” meti.go.jp .
Wave of National Export Restriction Laws Shrinking Tradable Pool
National export restrictions have significantly reduced the global pool of tradable scrap. China’s 2024 ban removed 8 million tons of offshore supply, creating deficits in Southeast Asia and forcing Japanese yards to redirect cargoes to Australia at premiums of USD 30–50 per ton. India followed with a licensing cap five months later, halving its export ceiling. Additional measures, such as Indonesia’s 7.5% export levy and Turkey’s permit regime, collectively removed 15 million tons of tradeable scrap from the market by the end of 2025. These restrictions have increased freight costs, pressured independent exporters, and accelerated the regionalization of scrap collection networks.
*Our forecasts treat driver/restraint impacts as directional, not additive. The impact forecasts reflect baseline growth, mix effects, and variable interactions.
Segment Analysis
By Metal Type: Ferrous Dominance Masks Non-Ferrous Acceleration
Ferrous metals contributed 70.82% of the 2025 throughput, driven by demand for rebar, beams, and automotive sheet. Non-ferrous metals are anticipated to grow at a CAGR of 6.22% through 2031, supported by applications such as data-center cabling, electric vehicle enclosures, and near-total battery collection in North America and Europe. Copper scrap prices rose by 18% in 2025 due to a 2.5 million-ton mine shortfall combined with strong electrification demand, boosting the premium segment of the scrap metal recycling market. Aluminum collection remains robust under beverage-can take-back laws, though lacquer contamination limits secondary alloy yields to 85% of virgin ingot levels. Lead batteries set the efficiency standard with a 99% collection rate in the United States, while titanium continues to serve niche, high-margin aerospace applications.
Grade premiums are shaping market trends. Certified low-copper ferrous scrap fetches up to USD 50 per ton more, enabling sensor-based sorting investments among top-tier yards. Non-ferrous processors observe similar trends: mill-grade aluminum trades USD 150 per ton higher than mixed turnings, and No. 1 copper achieves a 4% spot premium over No. 2 copper during peak deficit periods. As AI detection technology becomes more widespread, these price gaps are expected to narrow. However, early adopters are already capitalizing on the most lucrative opportunities within the scrap metal recycling market.


By End-use Industry: Construction Leads, Electronics Accelerates
In 2025, the construction industry accounted for 38.11% of market volume, driven by bridge replacements, metro expansions, and urban renewal projects in cities such as Delhi, Shanghai, and Chicago. India’s National Infrastructure Pipeline alone generated tens of millions of additional tons, underscoring the construction sector's central role in the scrap metal recycling market. Europe’s 70% demolition-waste recycling mandate promotes selective teardown techniques, preserving high-grade beams and plates, which enhance yield and reduce the carbon footprint of new construction projects.
The electrical and electronics sector is emerging as the fastest-growing segment, with a projected CAGR of 6.33% through 2031. Global e-waste reached 62 million tons in 2025, with each ton of circuit boards yielding 300 grams of copper and 30 grams of gold. Data centers consumed 1.2 million tons of copper busbars in 2025, while solar and wind energy projects increased aluminum demand by 800,000 tons. These high-value material flows accelerate payback periods for smelters with multimetal recovery capabilities, reshaping revenue streams within the broader scrap metal recycling market. The automotive sector remains a stable contributor, with North American and Japanese dismantlers achieving over 95% mass recovery due to end-of-life vehicle directives. Other contributors include manufacturing, appliances, and aerospace, with the latter valued for titanium and nickel superalloy returns that rarely re-enter general scrap streams.

Geography Analysis
Asia-Pacific accounted for 52.22% of the 2025 market volume and is expected to grow at a CAGR of 6.73% through 2031. China’s domestic export ban redirected 8 million tons of scrap to coastal electric arc furnaces (EAFs), tightening supply in Japan and South Korea. Despite this, Japan exported 6.2 million tons, though this figure was 15% lower than its 2023 baseline. South Korea’s new 2 million-ton POSCO furnace, equipped with AI sorters, has increased demand for auto-grade feed[2]POSCO, “Pohang EAF Commissioned,” posco.com . Vietnam, Indonesia, and Malaysia are following similar trajectories, with capacity expansions absorbing surplus feeds from long-haul routes and contributing to the growth of the local scrap metal recycling market.
In North America, the United States processed 70 million tons in 2025, supported by stringent automotive take-back regulations and aging infrastructure demolitions. Commercial Metals Company operates 40 yards across the United States and Mexico. Canada primarily exported scrap to U.S. buyers, while Mexico’s USMCA rules facilitated the movement of 2 million tons to Ternium’s Monterrey complex. Nucor’s expansion in the U.S. Midwest further tightened regional flows, highlighting the role of integrated networks in stabilizing prices within the scrap metal recycling market.
In Europe, the Circular Economy Action Plan mandates 70% demolition-waste recovery by 2030, ensuring a consistent scrap supply for long-product and flat-product mills. ArcelorMittal’s partnership with Nippon Steel secures 2 million tons of captive feed. Turkey’s import demand declined after licensing restrictions halved overseas sales, prompting Nordic mini-mills to rely more on regional scrap. Russia, under payment sanctions, continues to reinforce regional imbalances that impact the European scrap metal recycling market.

Competitive Landscape
The top five processors account for approximately 35% of global capacity in 2025, making the scrap metal recycling market moderately fragmented. Regional ownership patterns vary significantly. In the Asia-Pacific region, vertically integrated steelmakers control about 60% of local scrap, while North America and Europe maintain a strong presence of independent operators. Consolidation accelerated following the 2024 pig-iron price shock. ArcelorMittal’s joint venture with Nippon Steel highlights the focus on feedstock security and reduced exposure to export bans. Sims Limited’s deployment of LIBS-enabled sorting achieved 98% grade accuracy, commanding premiums of up to USD 60 per ton, demonstrating the profitability of technological advancements in the scrap metal recycling market.
Geographic expansion is also shaping corporate strategies. Commercial Metals Company acquired Polish yards, Nucor expanded in the U.S. Midwest, and Emirates Steel scaled its Abu Dhabi hub to 5 million tons. These developments secure supply near new EAF furnaces, reducing freight and import-duty costs. Emerging players are targeting battery metals, with Redwood Materials raising USD 1 billion for a Nevada campus and Li-Cycle’s spoke-and-hub model achieving 95% recovery rates for cobalt, nickel, and lithium. Patent activity in laser-induced spectroscopy increased by 40% between 2023 and 2025, signaling an innovation race that could redefine quality standards in the scrap metal recycling market.
Compliance is increasingly becoming a market-entry barrier. ISO 14001 and RIOS certifications are now common requirements in OEM contract tenders, and processors without these credentials risk exclusion from higher-value supply chains. As regulatory carbon audits become stricter, buyers are favoring yards with transparent Scope 1 and Scope 2 emissions reporting. This trend may raise entry barriers and drive the market toward greater consolidation over the next five years.
Scrap Metal Recycling Industry Leaders
Aurubis AG
OmniSource, LLC
Sims Limited
European Metal Recycling Ltd.
Commercial Metals Company (CMC)
- *Disclaimer: Major Players sorted in no particular order

Recent Industry Developments
- February 2026: Sims Limited acquired Tri Coastal Trading, a Houston-based company, for USD 66.5 million. The acquisition added approximately 350,000 tons of additional annual ferrous scrap volume.
- March 2025: ArcelorMittal Nippon Steel India (AM/NS India) commissioned a 120,000 tons per annum specialized scrap processing facility in India, to enhance domestic supply chains. This facility was the first of four planned as part of a INR 3.5 billion investment to improve the availability of high-quality scrap.


Global Scrap Metal Recycling Market Report Scope
Scrap metal recycling refers to the process of collecting, sorting, processing, and reusing discarded metal materials to extract their valuable components for manufacturing new products. It involves recovering and recycling various metals, such as iron, steel, aluminum, copper, and brass, to conserve natural resources, reduce environmental impacts, and meet the growing demand for sustainable materials. By diverting scrap metal from landfills and reintroducing it into the production cycle, scrap metal recycling plays a vital role in the circular economy and promotes resource conservation and energy efficiency.
The scrap metal recycling market is segmented by metal type, end-use industry, and geography. By metal type, the market is segmented into ferrous and non-ferrous. The ferrous metals are further segmented into iron and steel. The non-ferrous metals are further segmented into copper, aluminum, lead, and other metal types. By end-use industry, the market is segmented into construction, automotive, electrical and electronics, manufacturing and industrial, consumer appliances, aerospace and defense, and other end-user industries. The report also covers the market size and forecasts for the scrap metal recycling in 25 countries across major regions. For each segment, the market sizing and forecasts have been done on the basis of volume (tons).
| Ferrous | Iron |
| Steel | |
| Non-Ferrous | Copper |
| Aluminum | |
| Lead | |
| Other Metal Types |
| Construction |
| Automotive |
| Electrical and Electronics |
| Manufacturing and Industrial |
| Consumer Appliances |
| Aerospace and Defense |
| Other End-use Industries |
| Asia-Pacific | China |
| India | |
| Japan | |
| South Korea | |
| Malaysia | |
| Thailand | |
| Indonesia | |
| Vietnam | |
| Rest of Asia-Pacific | |
| North America | United States |
| Canada | |
| Mexico | |
| Europe | Germany |
| United Kingdom | |
| France | |
| Italy | |
| Spain | |
| Turkey | |
| NORDIC Countries | |
| Russia | |
| Rest of Europe | |
| South America | Brazil |
| Argentina | |
| Rest of South America | |
| Middle-East and Africa | Saudi Arabia |
| Qatar | |
| United Arab Emirates | |
| Egypt | |
| South Africa | |
| Rest of Middle-East and Africa |
| By Metal Type | Ferrous | Iron |
| Steel | ||
| Non-Ferrous | Copper | |
| Aluminum | ||
| Lead | ||
| Other Metal Types | ||
| By End-use Industry | Construction | |
| Automotive | ||
| Electrical and Electronics | ||
| Manufacturing and Industrial | ||
| Consumer Appliances | ||
| Aerospace and Defense | ||
| Other End-use Industries | ||
| By Geography | Asia-Pacific | China |
| India | ||
| Japan | ||
| South Korea | ||
| Malaysia | ||
| Thailand | ||
| Indonesia | ||
| Vietnam | ||
| Rest of Asia-Pacific | ||
| North America | United States | |
| Canada | ||
| Mexico | ||
| Europe | Germany | |
| United Kingdom | ||
| France | ||
| Italy | ||
| Spain | ||
| Turkey | ||
| NORDIC Countries | ||
| Russia | ||
| Rest of Europe | ||
| South America | Brazil | |
| Argentina | ||
| Rest of South America | ||
| Middle-East and Africa | Saudi Arabia | |
| Qatar | ||
| United Arab Emirates | ||
| Egypt | ||
| South Africa | ||
| Rest of Middle-East and Africa | ||


Key Questions Answered in the Report
What is the size of the scrap metal recycling market?
The scrap metal recycling market stands at 567.98 million tons in 2026 and are headed for 764.39 million tons by 2031, translating into a 6.12% CAGR through 2031.
Which region dominates the market volume in 2025?
Asia-Pacific contributed 52.22% of volume in 2025, supported by China’s internal consumption and new furnaces across India, Vietnam, and Indonesia.
Why is copper contamination a rising challenge?
Electric-vehicle wiring harnesses and electronics add copper mass that pushes average residual levels above 0.35%, forcing mills to invest in decopperization or accept downgrades.
What technologies are improving scrap quality?
Laser-induced breakdown spectroscopy and hyperspectral imaging now reach 98% grade accuracy and lower copper to 0.1%, but the costs of USD 2–5 million restrict SME uptake.
Page last updated on:


