Recycled Base Oil Market Size and Share
Market Overview
| Study Period | 2021 - 2031 |
|---|---|
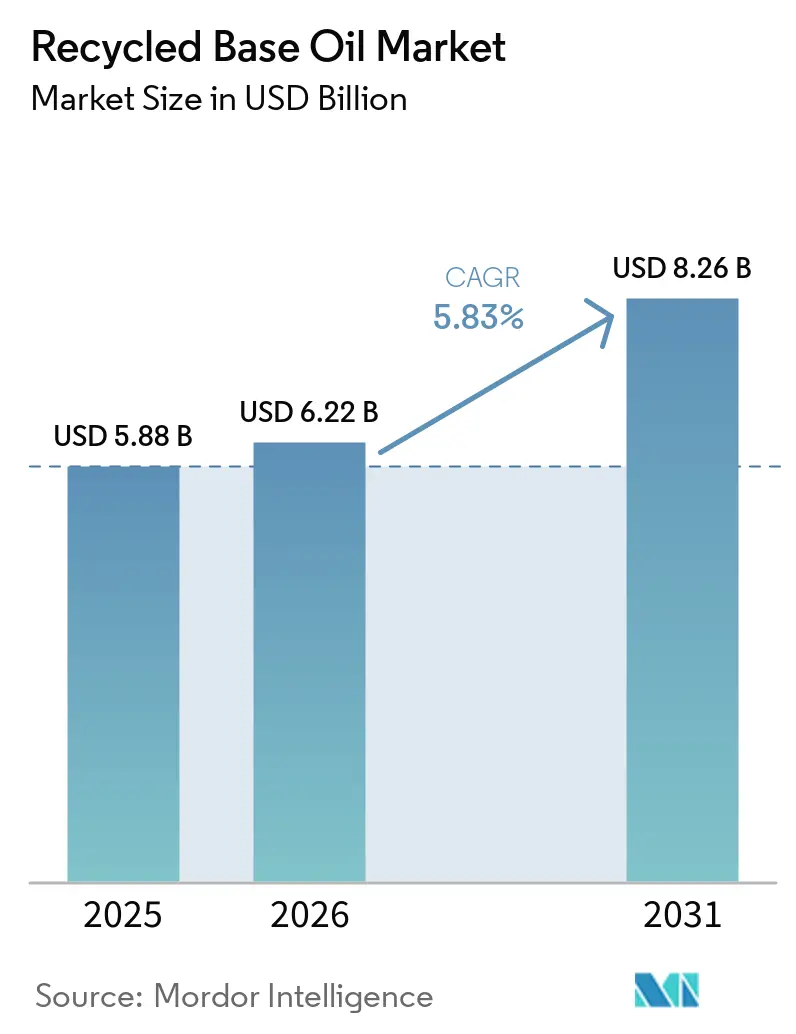
| Market Size (2026) | USD 6.22 Billion |
| Market Size (2031) | USD 8.26 Billion |
| Growth Rate (2026 - 2031) | 5.83% CAGR |
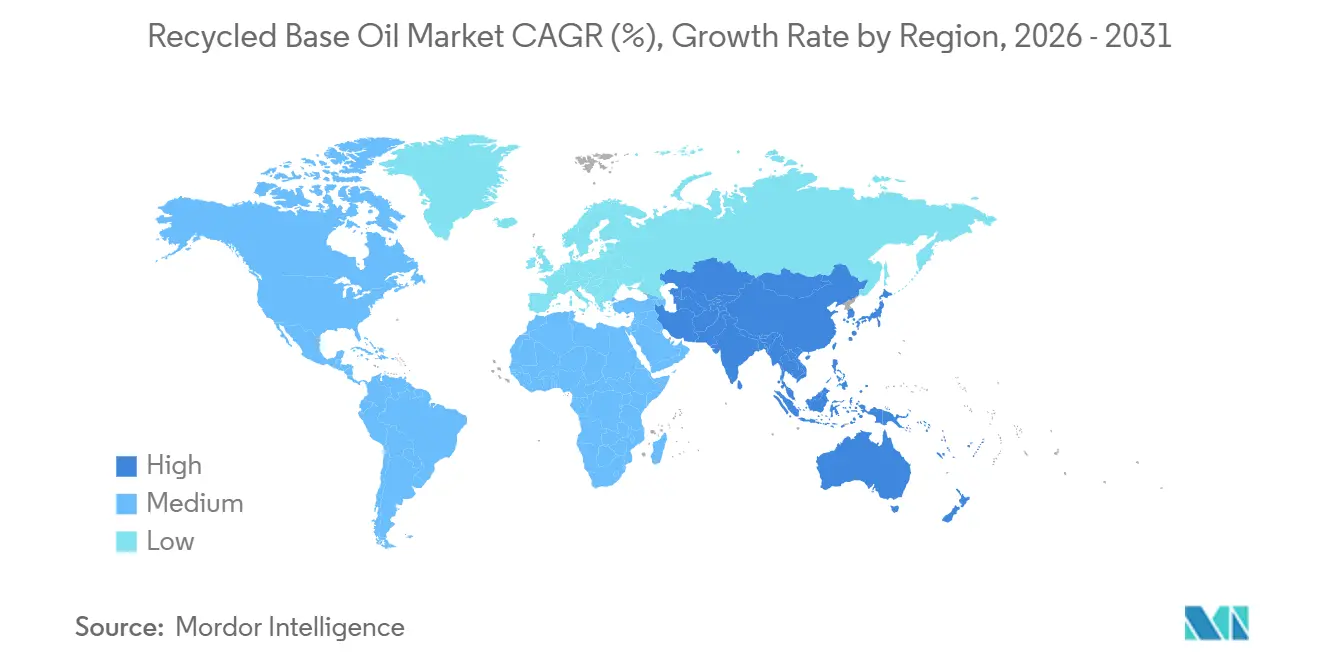
| Fastest Growing Market | Asia Pacific |
| Largest Market | Asia Pacific |
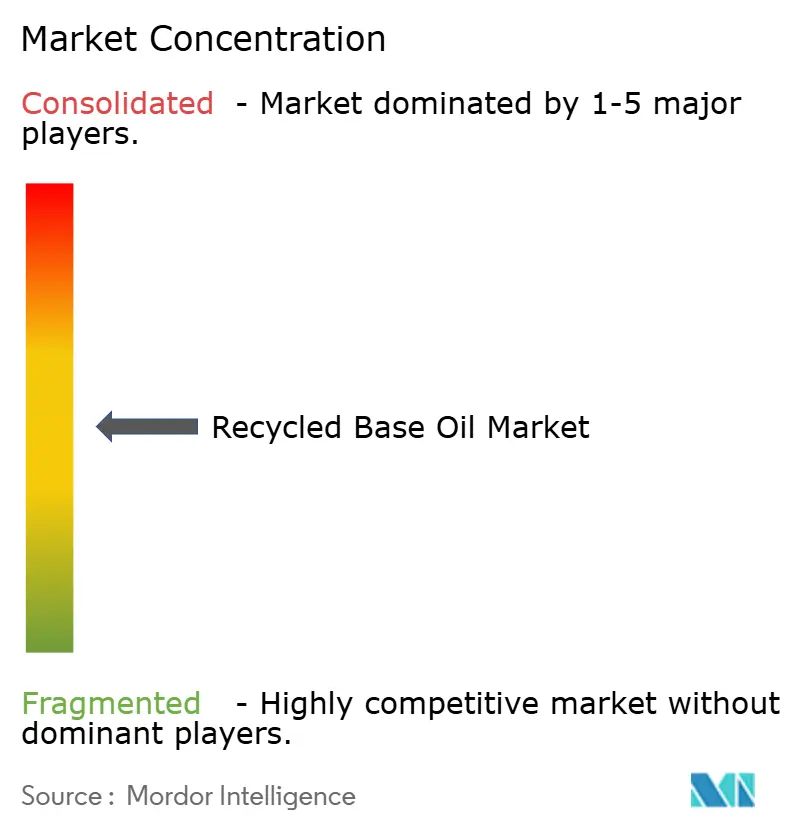
| Market Concentration | Medium |
Major Players *Disclaimer: Major Players sorted in no particular order Image © Mordor Intelligence. Reuse requires attribution under CC BY 4.0. | |
Recycled Base Oil Market Analysis by Mordor Intelligence
The Recycled Base Oil Market size was valued at USD 5.88 billion in 2025 and is estimated to grow from USD 6.22 billion in 2026 to reach USD 8.26 billion by 2031, at a CAGR of 5.83% during the forecast period (2026-2031). A widening price gap between virgin and re-refined Group II/III oils, mandated recycled-content thresholds, and OEM Scope-3 carbon targets are driving increased contract volumes for high-purity recycled stocks. The most significant feedstock shift now combines used engine oil with emerging fatty-acid distillates, enabling hybrid mineral-renewable blends that qualify for low-carbon fuel credits. Investments in hydrotreating upgrades, which improve viscosity index and sulfur performance, continue to attract capital, while thin-film evaporation modules enhance Group III yields and reduce operating costs. Regionally, Asia-Pacific leads in absolute demand growth as China and India implement province-level collection targets and fund greenfield hydrotreaters. However, North America and Europe remain technology hubs, exporting turnkey re-refining designs and strengthening offtake alliances with automotive and utility fleets.
Key Report Takeaways
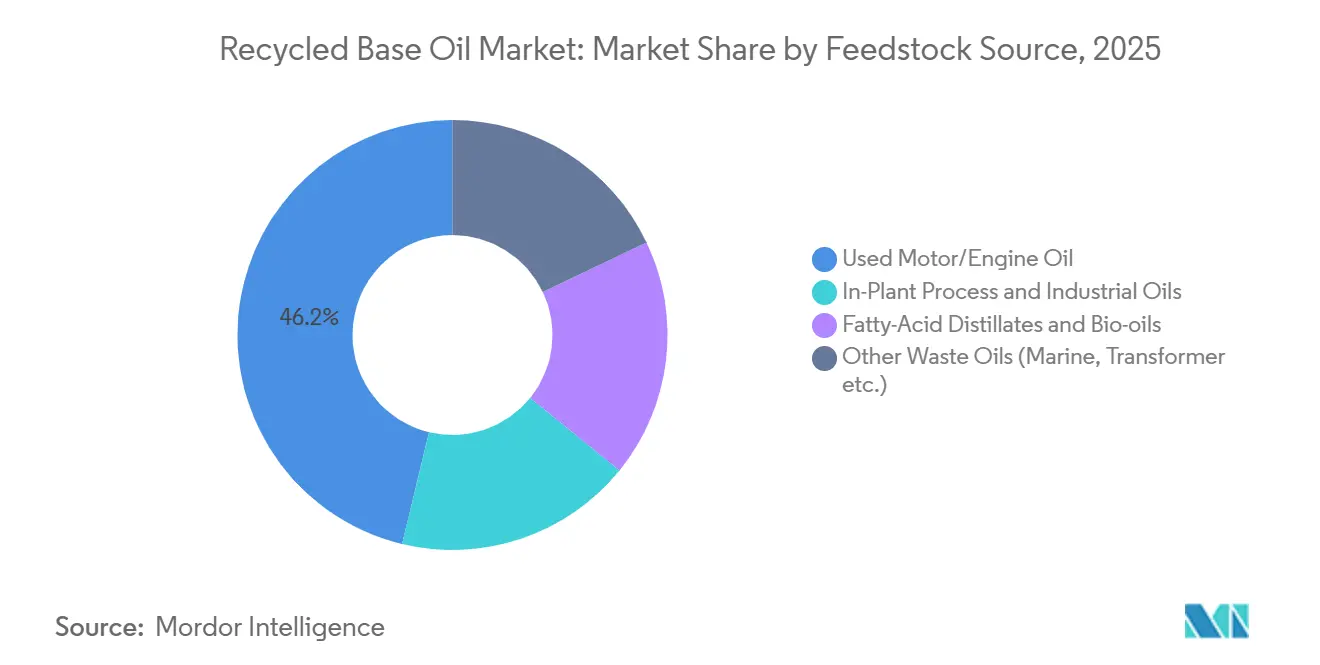
- By feedstock source, used motor and engine oil led with 46.22% of the recycled base oil market share in 2025, while fatty-acid distillates and bio-oils are forecast to expand at a 5.88% CAGR through 2031.
- By refining process, hydrotreating/hydro-refining accounted for 48.13% of the recycled base oil market share in 2025 and is set to grow at a 6.03% CAGR through 2031.
- By application, lubricant and grease blending accounted for 42.22% of the recycled base oil market share in 2025, while hydraulic and transformer oils are set to grow at a 6.13% CAGR through 2031.
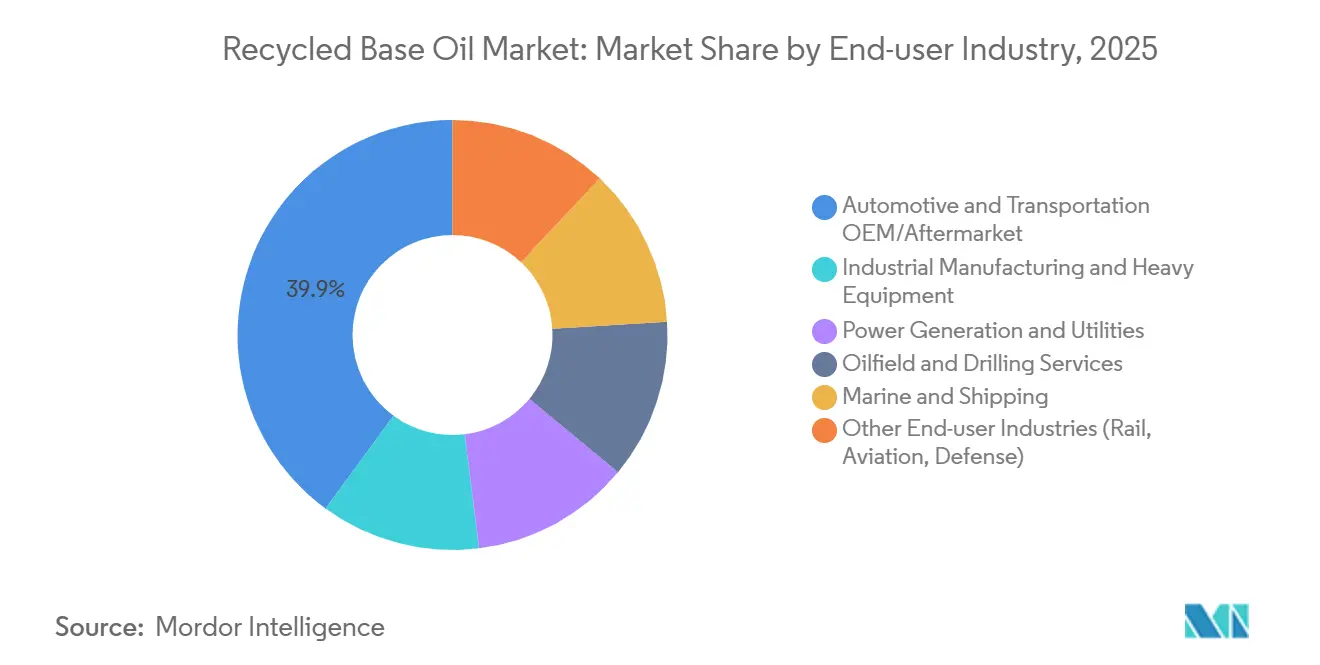
- By end-user industry, automotive and transportation OEM/aftermarket accounted for 39.94% of the recycled base oil market share in 2025, while oilfield and drilling services are set to grow at a 6.34% CAGR through 2031.
- By geography, Asia-Pacific contributed 34.77% of the recycled base oil market share in 2025 and is poised to advance at a 6.22% CAGR through 2031.
Note: Market size and forecast figures in this report are generated using Mordor Intelligence’s proprietary estimation framework, updated with the latest available data and insights as of January 2026.
Global Recycled Base Oil Market Trends and Insights
Drivers Impact Analysis*
| Driver | (~) % Impact on CAGR Forecast | Geographic Relevance | Impact Timeline |
|---|---|---|---|
| Increasing regulations mandating recycled content | +1.2% | North America and the EU, with early adoption in California, Colorado, and Ireland; spillover to APAC via OEM procurement standards | Medium term (2-4 years) |
| Cost advantage vs. virgin Group I/II base oils | +1.5% | Global, with the strongest impact in Asia-Pacific (China, India) and the Middle-East due to virgin-base-oil import dependency | Short term (≤ 2 years) |
| OEM Scope-3 carbon-cut targets favouring RRBO | +1.0% | Global, led by European and North American automakers; APAC OEMs following with a 2-3 year lag | Medium term (2-4 years) |
| Thin-film hydrotreating unlocking Group III RRBO | +0.9% | North America and the EU initially; APAC (China, India) scaling from 2027 onward | Long term (≥ 4 years) |
| Government fleet GPP recycled-content mandates | +0.7% | North America (King County, federal GSA pilots), EU (Ireland Circular 17/2025, EU GPP Road transport) | Medium term (2-4 years) |
| Source: Mordor Intelligence | |||
Increasing Regulations Mandating Recycled Content
State and national regulations are redefining lubricant specifications for public and private fleets. California requires state agencies to purchase lubricants containing at least 25% re-refined content, aligning with the U.S. EPA Comprehensive Procurement Guideline, while Colorado and Ireland introduced similar statutes in 2024 and 2025, respectively[1].U.S. Environmental Protection Agency, “Comprehensive Procurement Guideline,” epa.gov The European Commission reported that 61% of collected waste oil was regenerated into base stock in 2025, a significant increase from historical averages below 50%, reflecting a strong policy shift toward closed-loop regeneration. Updated FTC labeling standards now mandate explicit recycled-content disclosure, reducing greenwashing and improving the competitiveness of certified re-refiners in procurement processes. Collectively, these measures expand addressable demand and protect compliant re-refiners from commoditized pricing pressures.
Cost Advantage vs. Virgin Group I/II Base Oils
Throughout 2025, re-refined Group II oils traded at a noticeable discount compared to virgin counterparts, as re-refiners avoid crude-distillation costs and utilize heat recovery from light distillates. PurePath’s thin-film hydrotreaters report 10-30% lower manufacturing costs per barrel, with additional energy savings through integrated vapor recovery. The cost advantage is more pronounced in Asia-Pacific, where imported virgin oils incur freight and tariff premiums. When carbon pricing mechanisms, such as the EU ETS and pilot schemes in Asia, are factored in, the lifecycle CO₂ reductions of 37-82% achieved by re-refiners directly enhance margins.
OEM Scope-3 Carbon-Cut Targets Favoring RRBO
Automakers are incorporating re-refined oils into supplier scorecards to meet Scope-3 emission reduction goals. For instance, Renault’s 2025 life-cycle audit demonstrated 13-24% carbon reductions when factory-fill blends included re-refined base oils (RRBO). Similarly, FUCHS Petrolub committed in 2025 to transitioning its European automotive lines to re-refined bases. Tier-one suppliers like BorgWarner are aligning lubricant procurement with Science Based Targets initiative pathways, embedding recycled-content minimums into long-term contracts. These secured volumes reduce investment risks for hydrotreating projects and support offtake agreements.
Thin-Film Hydrotreating Unlocking Group III RRBO
Next-generation thin-film evaporators operating at 150-200 bar are enabling the production of API Group III base oils with viscosity indices above 120 and sulfur levels below 10 ppm, meeting OEM low-SAPs formulation requirements. ReGen III’s Texas City pilot achieved a 53% Group III yield from mixed feedstock, with an 82% CO₂ reduction compared to virgin production. In 2024, PURAGLOBE’s HyLube3 plant in Germany became the first commercial source of Group III/III+ recycled stock, and the HyLube4 project is under engineering review for deployment outside Europe. The high capital intensity of these technologies limits participation to integrated operators, widening the quality gap with acid-clay producers.
Restraints Impact Analysis*
| Restraint | (~) % Impact on CAGR Forecast | Geographic Relevance | Impact Timeline |
|---|---|---|---|
| Insufficient re-refining capacity in developing regions | -0.6% | APAC (excluding Japan, South Korea), the Middle-East and Africa, South America | Medium term (2-4 years) |
| Substitution threat from bio-based esters and PAGs | -0.4% | Global, with the highest impact in Europe and North America, the premium synthetic segments | Long term (≥ 4 years) |
| Basel-driven restrictions on used-oil exports | -0.5% | Global, with acute impact on APAC, the Middle-East and Africa, feedstock flows | Short term (≤ 2 years) |
| Source: Mordor Intelligence | |||
Insufficient Re-Refining Capacity in Developing Regions
Emerging economies generate significant volumes of waste oil but lack adequate hydrotreating infrastructure. For example, China’s nominal capacity of 709,000 tons operated at only 11.5% utilization in 2024, as small acid-clay plants failed to meet stricter permitting requirements. Similarly, India generated 3-4 million tons of waste oil in 2025, but formal re-refiners could process only 500,000 tons, leaving the majority to low-value fuel or export streams. Even with YUNITCO’s 200,000-ton Yanbu expansion and a planned 100,000-ton Cairo facility, these projects will address less than 15% of regional waste oil generation, underscoring persistent capacity shortfalls.
Substitution Threat from Bio-Based Esters and PAGs
High-performance applications, such as marine, food-grade, and high-temperature industrial fluids, are increasingly adopting synthetic esters and polyalkylene glycols (PAGs), which outperform Group III RRBO in oxidation stability and biodegradability. EU Ecolabel scoring favors bio-based content, encouraging formulators to shift toward renewable esters despite their 10-20% price premium over RRBO[2]European Union, “EU Ecolabel Lubricant Criteria,” europa.eu. As OEMs extend drain intervals to 20,000 miles, these synthetics are reducing RRBO’s share in premium lubricant blends.
*Our forecasts treat driver/restraint impacts as directional, not additive. The impact forecasts reflect baseline growth, mix effects, and variable interactions.
Segment Analysis
By Feedstock Source: Engine-Oil Dominance, Bio-Oil Momentum
Used motor and engine oil accounted for 46.22% of the recycled base oil market share in 2025, supported by established dealership and quick-lube collection networks. In comparison, fatty-acid distillates and other bio-oils are projected to grow at a 5.88% CAGR through 2031, representing the fastest growth among feedstocks. This increase is driven by low-carbon fuel standards that monetize renewable-content credits and encourage co-processing trials. China’s waste-oil stream remains 90% engine-oil-derived as hazardous-waste tracking expands to steel and power industries.
Pilot blending 10-30% bio-oil with mineral re-refined base oil (RRBO) is producing hybrid base oils that meet API Group II/III specifications while qualifying for California LCFS credits. These pilot projects could scale commercially if credit values exceed USD 50 per ton CO₂-equivalent. Specialty streams, such as transformer and marine oils, command premium margins when repurposed into closed-loop applications that utilities and shipping companies can audit.


By Refining Process: Hydrotreating/Hydro-refining Ascends
Hydrotreating/hydro-refining accounted for 48.13% of the recycled base oil market size in 2025 and is expected to grow at a 6.03% CAGR through 2031. This growth is supported by investments in hydrogen units that enhance saturates and viscosity index to meet Group III standards. While acid-clay processes persist in cost-sensitive markets, they face increasing shutdown pressures due to tightening sulfur regulations. PURAGLOBE’s thin-film-plus-hydrotreat process has set a new quality benchmark, achieving a viscosity index above 120 and sulfur levels below 10 ppm.
Clean Harbors’ USD 210-220 million solvent de-asphalting retrofit is expected to produce 600N heavy base oil by 2028, opening opportunities in heavy-duty diesel and gear-oil markets. YUNITCO and Indian refiners are bypassing outdated neutral-clay systems and adopting hydrotreatment processes to align with Euro 6 lubricant standards.
By Application: Hydraulic and Transformer Oils Outpace Lubricant and Grease Blending
Lubricant and grease blending remained the largest application segment, accounting for 42.22% of the market in 2025. However, hydraulic and transformer oils are projected to grow at a 6.12% CAGR through 2031, outpacing overall market growth.
IEC 60296 now permits transformer oils made entirely from recycled fluids, and utilities in Europe and North America are entering multi-year supply contracts to secure closed-loop flows. ISO 11158-compliant hydraulic oils formulated with Group II RRBO offer 10-20% cost savings per operating hour, making them attractive for high-consumption factories and mobile equipment fleets.
By End-user Industry: Oilfield and Drilling Services Accelerate
The automotive and transportation OEM/aftermarket industry accounted for 39.94% of revenue in 2025, driven by factory-fill and aftermarket demand. However, oilfield and drilling services are expected to grow at a 6.34% CAGR through 2031, as offshore operators adopt circular drilling-fluid loops to reduce carbon intensity and comply with Basel waste-handling standards.
Utilities adopting RRBO transformer oils and turbine lubricants represent another growth area, while industrial manufacturing maintains mid-single-digit growth, supported by cost savings in high-turnover metalworking fluids.
Geography Analysis
Asia-Pacific generated 34.77% of global revenue in 2025 and will ascend at a 6.22% CAGR through 2031. China collected 5.108 million tons of waste oil valued at CNY 13.495 billion (USD 1.89 billion) in 2025, with projections of 5.322 million tons worth CNY 14.231 billion (USD 1.99 billion) in 2026. This growth is driven by digital hazardous-waste tracking and state-owned enterprise (SOE) joint ventures. India’s 2026 MOUs between HPCL-Castrol and Indian Oil-Re Sustainability aim to establish 50,000-100,000-ton Group II+ hydrotreaters to reduce import dependency.
North America, while a mature market, is focusing on quality improvements. Clean Harbors processed 243 million gallons in 2025 and is investing in high-viscosity 600N production. Vertex Energy introduced Group III grades VTX-R4 and VTX-R6 in November 2025 from its Mobile, Alabama facility, targeting OEM carbon mandates.
Europe’s 61% regeneration rate reflects regulatory pressures. PURAGLOBE’s HyLube3 technology anchors Group III supply under a 12-year Shell offtake agreement, supporting the region’s focus on high-quality recycled base oils.
The Middle-East and Africa hinge on capacity gap closures. YUNITCO’s Yanbu expansion to 200,000 tons by 2026 and a 100,000-ton Cairo greenfield project by 2027 represent the region’s largest investments but still address less than 15% of Gulf and North African waste-oil generation. In South America, Brazil’s BRL 1 billion expansion by Lwart to 360 million liters per year highlights regional efforts, though neighboring countries remain reliant on imports.

Competitive Landscape
The global recycled base oil market is moderately concentrated. Clean Harbors leads with integrated collection and re-refining operations and is shifting toward heavier 600N cuts to serve diesel and gear-oil markets. PURAGLOBE’s advanced technology supports Group III/III+ production, which commands 20-40% price premiums and secures long-term offtake agreements with Shell.
In the Asia-Pacific region, over 500 certified Chinese operators exhibit significant quality variation. Environmental audits are driving mergers, consolidating volumes into hydrotreatment-ready hubs. Crystal Clean’s acquisition by J.F. Lehman in 2023 and subsequent expansions in 2025 increased its branch network to over 100 locations, demonstrating the importance of network densification. Emerging players like VAO Group are combining chemical-recycling pyrolysis with mineral RRBO streams to capitalize on LCFS credit opportunities. Certifications such as IEC 60296 for transformer oils and ISO 11158 for hydraulic oils have become competitive differentiators, with early adopters like Nynas and Vertex securing multi-year contracts in utility and automotive OEM markets.
Recycled Base Oil Industry Leaders
CLEAN HARBORS, INC.
PURAGLOBE
Avista Oil Deutschland GmbH
Crystal Clean, Inc
Vertex Energy
- *Disclaimer: Major Players sorted in no particular order

Recent Industry Developments
- March 2026: Indian Oil Corporation (IOCL) and Re Sustainability signed a Memorandum of Understanding (MoU) to develop India's first organized, nationwide used oil recycling ecosystem. The initiative targeted the collection of 100 kilotons per annum (KTA) of used lubricating oil to produce high-quality Group II+ Re-Refined Base Oil (RRBO).
- September 2024: Exxon Mobil Corporation advanced a circular economy initiative in Europe by incorporating re-refined base stock production into its operations. This initiative, involving the Gravenchon Refinery in France and the Rotterdam facility in the Netherlands, aimed to convert used oil into high-quality Group II base stock.


Global Recycled Base Oil Market Report Scope
Recycled base oil is a high-quality lubricant base derived from processing used oil to eliminate contaminants such as dirt, water, and chemicals. Unlike standard recycled oil, which is merely filtered for reuse as fuel, re-refined base oil undergoes advanced distillation and purification processes to restore its original chemical properties, making it comparable to virgin base oil.
The Recycled Base Oil Market is segmented into feedstock source, refining process, application, end-user industry, and geography. By feedstock source, the market is segmented into used motor/engine oil, in-plant process and industrial oils, fatty-acid distillates and bio-oils, and other waste oils (marine, transformer, etc.). By refining process, the market is segmented into hydrotreating/hydro-refining, acid-clay treating, resin de-wax/de-color, and other proprietary processes (Revivoil, Vaxon, etc.). By application, the market is segmented into lubricant and grease blending, metal-working fluids (cutting, forming), hydraulic and transformer oils, industrial machinery lubrication, and other applications (rubber process, process oils). By end-user industry, the market is segmented into automotive and transportation OEM/aftermarket, industrial manufacturing and heavy equipment, power generation and utilities, oilfield and drilling services, marine and shipping, and other end-user industries (rail, aviation, defense). The report also covers the market size and forecasts for recycled base oil in 17 countries across major regions. For each segment, the market sizing and forecasts have been done on the basis of value (USD).
| Used Motor/Engine Oil |
| In-Plant Process and Industrial Oils |
| Fatty-Acid Distillates and Bio-oils |
| Other Waste Oils (Marine, Transformer etc.) |
| Hydrotreating/Hydro-refining |
| Acid-Clay Treating |
| Resin De-wax/De-color |
| Other Proprietary Processes (Revivoil, Vaxon, etc.) |
| Lubricant and Grease Blending |
| Metal-working Fluids (Cutting, Forming) |
| Hydraulic and Transformer Oils |
| Industrial Machinery Lubrication |
| Other Applications (Rubber Process, Process Oils) |
| Automotive and Transportation OEM/Aftermarket |
| Industrial Manufacturing and Heavy Equipment |
| Power Generation and Utilities |
| Oilfield and Drilling Services |
| Marine and Shipping |
| Other End-user Industries (Rail, Aviation, Defense) |
| Asia-Pacific | China |
| India | |
| Japan | |
| South Korea | |
| ASEAN Countries | |
| Rest of Asia-Pacific | |
| North America | United States |
| Canada | |
| Mexico | |
| Europe | Germany |
| United Kingdom | |
| France | |
| Italy | |
| Spain | |
| Russia | |
| Rest of Europe | |
| South America | Brazil |
| Argentina | |
| Rest of South America | |
| Middle-East and Africa | Saudi Arabia |
| South Africa | |
| Rest of Middle-East and Africa |
| By Feedstock Source | Used Motor/Engine Oil | |
| In-Plant Process and Industrial Oils | ||
| Fatty-Acid Distillates and Bio-oils | ||
| Other Waste Oils (Marine, Transformer etc.) | ||
| By Refining Process | Hydrotreating/Hydro-refining | |
| Acid-Clay Treating | ||
| Resin De-wax/De-color | ||
| Other Proprietary Processes (Revivoil, Vaxon, etc.) | ||
| By Application | Lubricant and Grease Blending | |
| Metal-working Fluids (Cutting, Forming) | ||
| Hydraulic and Transformer Oils | ||
| Industrial Machinery Lubrication | ||
| Other Applications (Rubber Process, Process Oils) | ||
| By End-user Industry | Automotive and Transportation OEM/Aftermarket | |
| Industrial Manufacturing and Heavy Equipment | ||
| Power Generation and Utilities | ||
| Oilfield and Drilling Services | ||
| Marine and Shipping | ||
| Other End-user Industries (Rail, Aviation, Defense) | ||
| By Geography | Asia-Pacific | China |
| India | ||
| Japan | ||
| South Korea | ||
| ASEAN Countries | ||
| Rest of Asia-Pacific | ||
| North America | United States | |
| Canada | ||
| Mexico | ||
| Europe | Germany | |
| United Kingdom | ||
| France | ||
| Italy | ||
| Spain | ||
| Russia | ||
| Rest of Europe | ||
| South America | Brazil | |
| Argentina | ||
| Rest of South America | ||
| Middle-East and Africa | Saudi Arabia | |
| South Africa | ||
| Rest of Middle-East and Africa | ||


Key Questions Answered in the Report
What is the size of the recycled base oil market?
The recycled base oil market stands at USD 6.22 billion in 2026 and is expected to reach USD 8.26 billion by 2031, expanding at a 5.83% CAGR over 2026-2031.
Which region will record the fastest demand growth through 2031?
Asia-Pacific, advancing at roughly 6.22% CAGR through 2031 on the back of new hydrotreaters in China and India.
Why are hydrotreating refining process gaining the fastest growth through 2031?
They deliver Group II/III quality that meets modern OEM specifications, supporting a 6.03% CAGR through 2031 for the hydrotreating refining process.
Which application segment is poised for the quickest expansion through 2031?
Hydraulic and transformer oils, with a forecast 6.12% CAGR through 2031 as utilities adopt IEC 60296-compliant recycled fluids.
Page last updated on:


