Lead Market Size and Share
Market Overview
| Study Period | 2021 - 2031 |
|---|---|
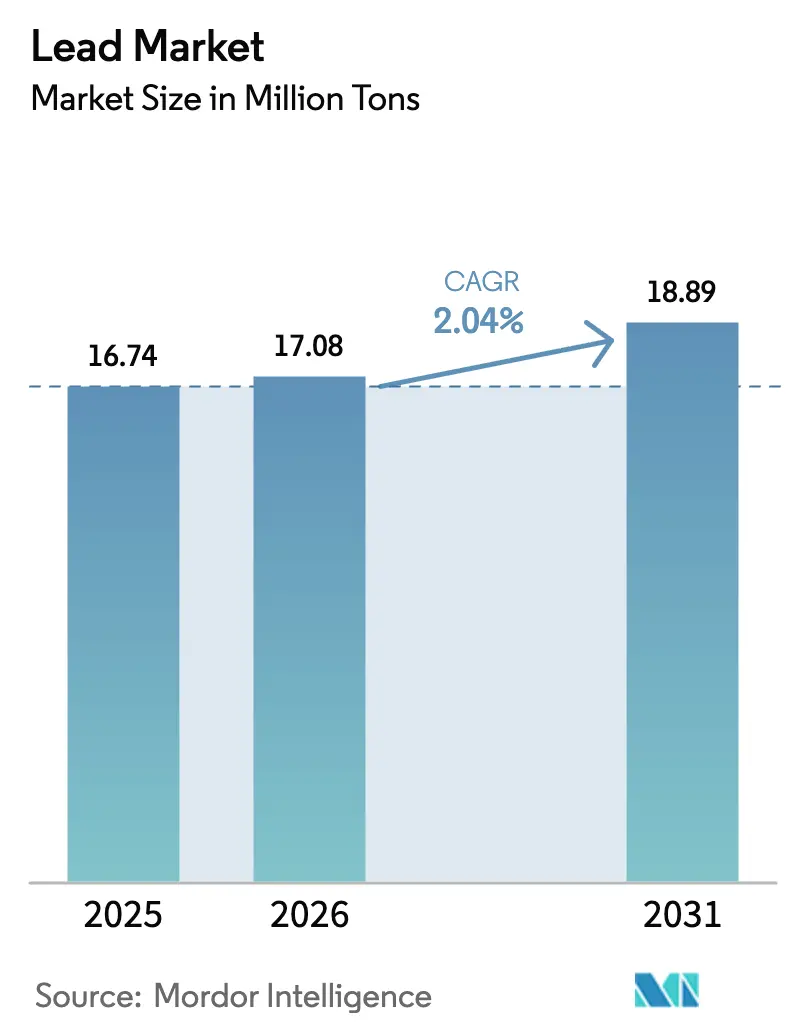
| Market Volume (2026) | 17.08 Million tons |
| Market Volume (2031) | 18.89 Million tons |
| Growth Rate (2026 - 2031) | 2.04% CAGR |
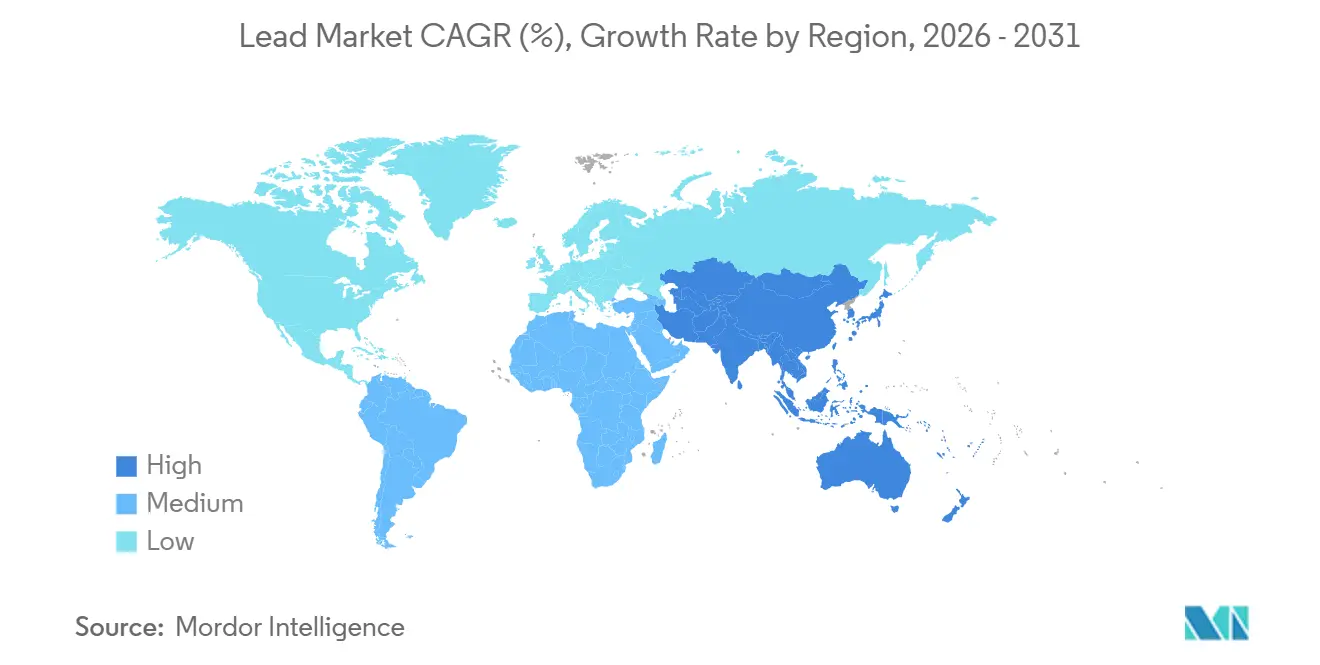
| Fastest Growing Market | Asia Pacific |
| Largest Market | Asia Pacific |
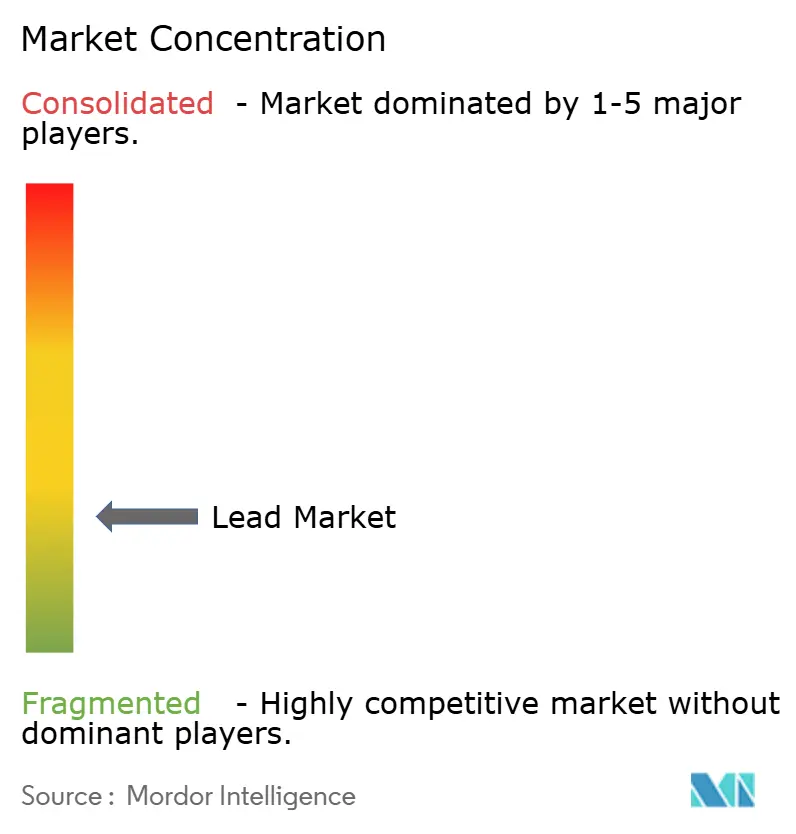
| Market Concentration | Low |
Major Players *Disclaimer: Major Players sorted in no particular order Image © Mordor Intelligence. Reuse requires attribution under CC BY 4.0. | |
Lead Market Analysis by Mordor Intelligence
The Lead Market size is expected to grow from 16.74 Million tons in 2025 to 17.08 Million tons in 2026 and is forecast to reach 18.89 Million tons by 2031 at 2.04% CAGR over 2026-2031. Data‐center UPS demand, low-speed EV adoption in emerging Asia, and 81.02% battery dominance within the application mix preserve a sizable, price-insulated outlet for refined metal even as lithium chemistries gain attention. Secondary supply already delivers 62.65% of global output, and EU Regulation 2023/1542 that mandates 85% recycled content by 2031 is accelerating a 2.29% CAGR for scrap-based feedstock, outstripping primary mining, hampered by concentrate-grade decline and 15% annual CAPEX inflation. Asia-Pacific leads with 51.28% of volume and a 2.99% CAGR, buoyed by India’s e-rickshaw fleet, China’s urban-mining subsidies, and ASEAN ride-hailing logistics. Moderate competitive intensity - top five players control roughly 35% of refined capacity - favors vertically integrated recyclers that deploy closed-loop hydrometallurgical technology, recovering 99% of contained lead at lower energy intensity.
Key Report Takeaways
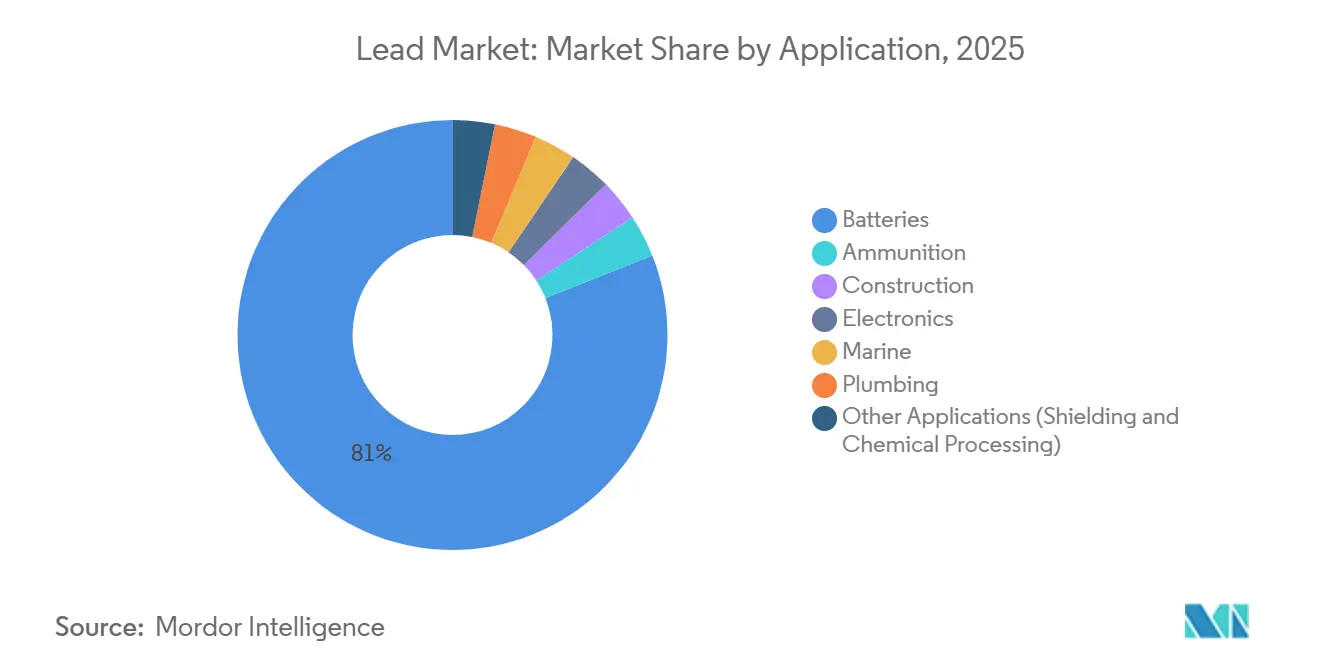
- By application, Lead-acid Batteries accounted for 81.02% share in the Lead market in 2025. However, the share of Motive-Power Batteries is expected to grow with the fastest CAGR of 3.05% during the forecast period (2026-2031).
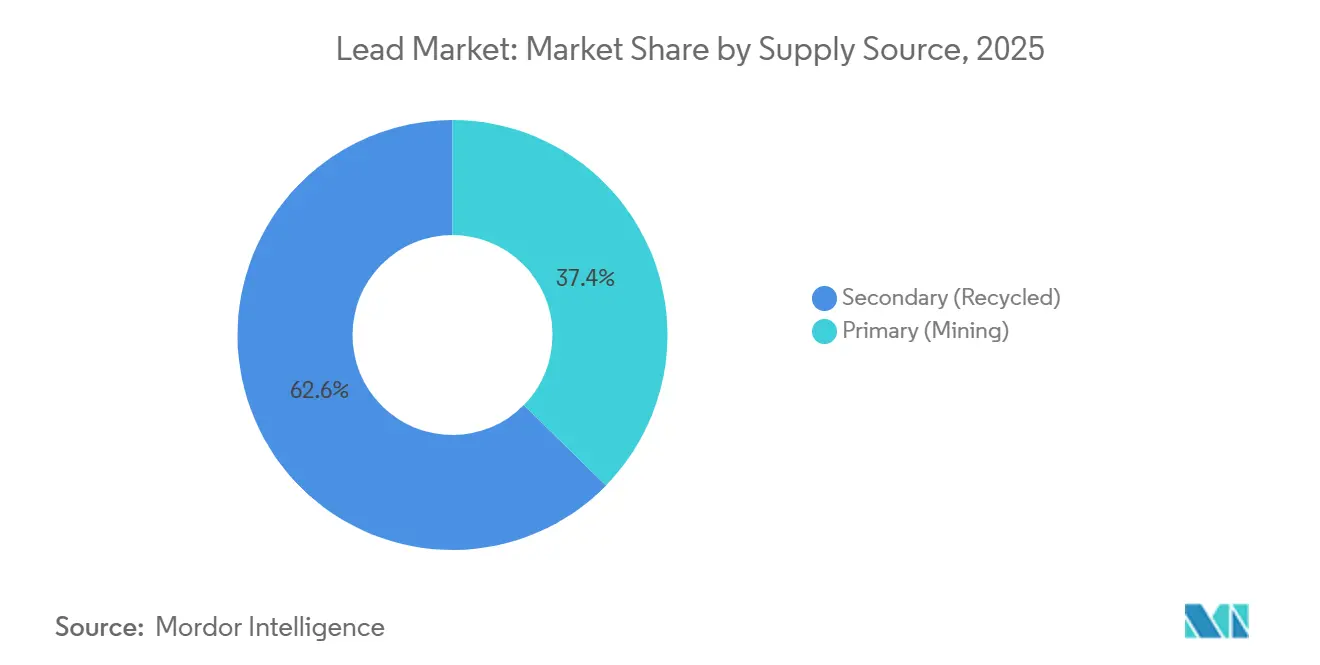
- By supply source, secondary (recycled) captured a 62.65% lead market share in 2025 and is projected to grow at a 2.29% CAGR during the forecast period (2026-2031).
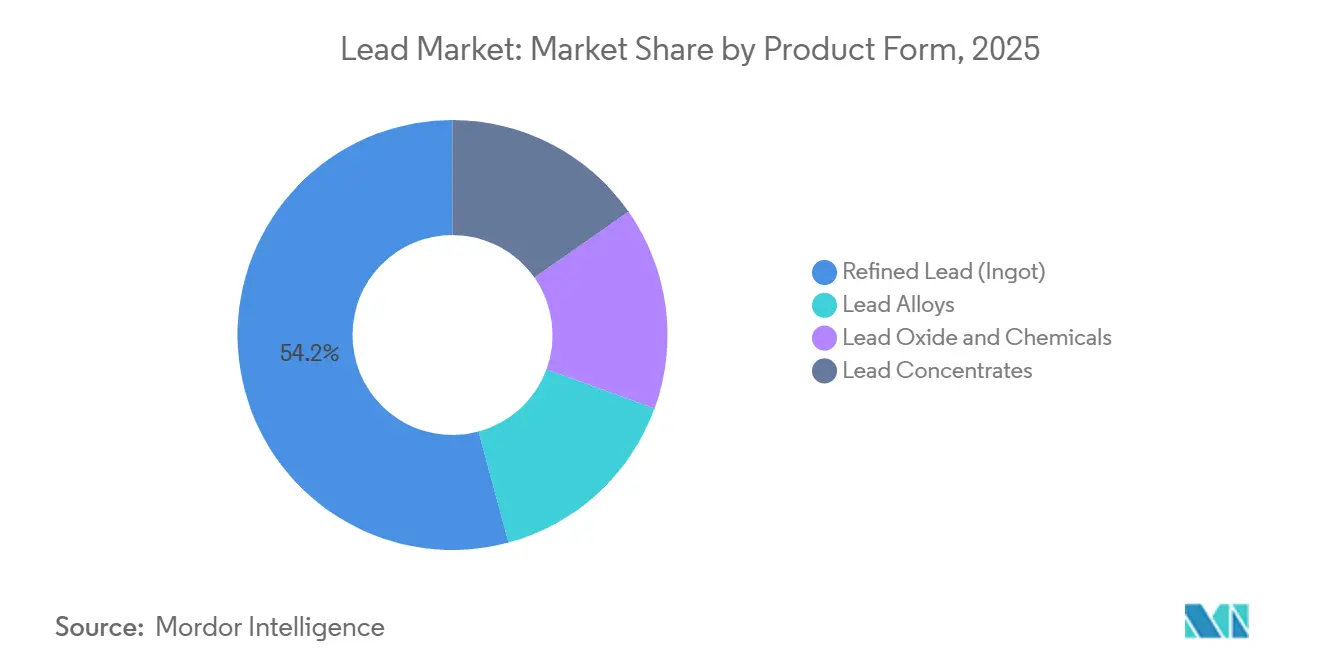
- By product form, refined lead commanded 54.18% of volume in 2025, yet lead oxides and chemicals are poised for a 3.02% CAGR during the forecast period (2026-2031).
- By geography, Asia-Pacific accounted for 51.28% share in lead market in 2025 and is projected to grow at a 2.99% CAGR .he fastest 3.19% CAGR during the forecast period (2026-2031) .
- By geography, Asia-Pacific accounted for 51.28% share in lead market in 2025 and is projected to grow at a 2.99% CAGR during the forecast period (2026-2031).
Note: Market size and forecast figures in this report are generated using Mordor Intelligence’s proprietary estimation framework, updated with the latest available data and insights as of January 2026.
Global Lead Market Trends and Insights
Drivers Impact Analysis*
| Driver | (~) % Impact on CAGR Forecast | Geographic Relevance | Impact Timeline |
|---|---|---|---|
| Booming lead-acid battery demand from data-center and 5G back-up systems | +0.4% | Global, with concentration in North America, Europe, and China | Medium term (2-4 years) |
| Resurgence of low-speed EVs (e-rickshaws, golf cars) in emerging Asia | +0.3% | APAC core (India, ASEAN), spillover to MEA | Short term (≤ 2 years) |
| Mandated minimum recycled-content rules in EU & US battery regulations | +0.5% | North America & EU, indirect impact on APAC exporters | Long term (≥ 4 years) |
| Multi-metal refinery retrofits unlocking latent primary-lead capacity | +0.2% | Global, led by Canada, Australia, South Korea | Medium term (2-4 years) |
| China's scrap-based "urban-mining" subsidies for secondary lead | +0.3% | China, with indirect price effects globally | Short term (≤ 2 years) |
| Source: Mordor Intelligence | |||
Booming Lead-Acid Battery Demand from Data-Center and 5G Back-Up Systems
Hyperscale facilities double electricity draw to 1,000 TWh by 2026, translating to 120,000-150,000 tons of incremental annual lead for VRLA UPS strings that remain preferred because lithium fire-suppression adds USD 50-80 per kWh to capex. Indian and Southeast Asian carriers mirror the trend; Bharti Airtel equipped 5,000 towns with lead-acid backed 5G towers during 2025, citing lower replacement cost and a mature reverse-logistics network[1]Airtel, “5G Rollout Press Release 2025,” airtel.com. Telecom backup needs to combine with data-center redundancy to underpin a resilient, high-margin outlet insulated from chemistry substitution. OEM warranties extending to 15 years for the newest VRLA designs further raise switching costs. Safety regulators in the US and EU continue to flag lithium thermal-runaway risk, reinforcing preference for tried-and-tested lead systems.
Resurgence of Low-Speed EVs in Emerging Asia
India’s e-rickshaw fleet surpassed 1.5 million units in 2025, 90% of which run on lead-acid packs that cost 40-50% less than lithium equivalents, a decisive factor for drivers earning USD 8-12 daily. The 2024 Electric Mobility Promotion Scheme extended subsidies to vehicles below 25 km/h regardless of chemistry, reversing earlier lithium-only incentives. ASEAN ride-hailing operators such as Grab and Gojek adopted similar trikes, and low-range golf carts in the United States kept an 85% lead-acid share through 2025. Daily duty cycles below 25 km, limited charging infrastructure, and high scrap value lock in 200,000-250,000 tons of annual demand. VRLA variants with rapid-swapping trays further align with shared-mobility economics.
Mandated Minimum Recycled-Content Rules in EU and US Battery Regulations
EU Regulation 2023/1542 sets an 85% recycled-lead threshold by 2031, triggering tighter scrap premiums, 15-20% above LME spot in 2025, and multi-year offtake contracts between battery OEMs and recyclers. California’s 2024 amendment to its Rechargeable Battery Recycling Act layers a 95% recovery target for industrial units by 2028, steering capital toward collection logistics. Vertically integrated firms like Ecobat and Gravita India hedge volatility by straddling smelting and oxide manufacture, while Umicore touts its 99.9% closed-loop hydrometallurgy that cuts energy use by 30% and fetches premium pricing. Regulations, therefore, convert environmental compliance into a structural moat for integrated recyclers.
Multi-Metal Refinery Retrofits Unlocking Latent Primary-Lead Capacity
Glencore’s Portovesme smelter reopened in 2025 to co-process zinc and lead concentrates, slashing per-ton costs 60% versus standalone circuits and restoring 40,000 tons of capacity. Teck’s Trail complex now reroutes zinc residues into a 15,000-ton lead stream, and Korea Zinc’s Onsan operation reaches 92% metal recovery from polymetallic feed. Such retrofits monetize lower-grade ores that single-metal mines reject, softening the cost curve and extending mine life in Canada and Australia. Benchmark CAPEX for greenfield primary smelting surpasses USD 2 billion, so brownfield circuit additions remain the pragmatic, lower-risk path.
Restraints Impact Analysis*
| Restraint | (~) % Impact on CAGR Forecast | Geographic Relevance | Impact Timeline |
|---|---|---|---|
| Accelerating OEM shift to lithium-iron-phosphate starter batteries | -0.3% | Global, led by China and Europe | Medium term (2-4 years) |
| Strict PFAS limits raising operating costs for lead smelters | -0.2% | North America & EU | Short term (≤ 2 years) |
| Chronic concentrate-grade decline driving CAPEX inflation | -0.2% | Global, acute in Australia and China | Long term (≥ 4 years) |
| Source: Mordor Intelligence | |||
Accelerating OEM Shift to Lithium-Iron-Phosphate Starter Batteries
Chinese automakers BYD and CATL piloted LFP starter packs in 2025 at cell costs under USD 60 per kWh, nearing parity with lead-acid once 10-year lifespans are factored. Start-stop systems favor 3,000-5,000 lithium cycles versus 500-800 for lead, risking the displacement of 150,000-200,000 tons of annual demand if adoption scales. European OEMs remain cautious; Volkswagen flagged cold-weather degradation below –10 °C, delaying wide deployment. Aftermarket replacement, representing 60% of automotive battery volume, will lag OEM rollout by five to seven years, cushioning near-term erosion.
Strict PFAS Limits Raising Operating Costs for Lead Smelters
EPA proposals ban PFAS surfactants in electrolytic refining by 2027, forcing USD 20-30 million retrofits per plant and adding USD 8-12 per ton to operating costs[2]Environmental Protection Agency, “PFAS Proposed Rule 2024,” epa.gov. EU REACH restrictions already paused Nyrstar’s Budel smelter for six months in 2025, removing 35,000 tons from the market while upgrades were installed. Secondary recyclers with pyrometallurgical routes escape most compliance costs, widening their cost advantage by USD 50-70 per ton by 2026. High-purity primary producers are unable to absorb the delta and may face closure or consolidation.
*Our forecasts treat driver/restraint impacts as directional, not additive. The impact forecasts reflect baseline growth, mix effects, and variable interactions.
Segment Analysis
By Application: Batteries Anchor Demand While Motive Power Gains Speed
Lead-acid batteries accounted for 81.02% of application demand in 2025, and the motive-power niche is on track for a 3.05% CAGR, outpacing the overall lead market. Warehouse operators such as Amazon deployed 120,000 electric forklifts in 2025, 70% still powered by lead packs because fleet managers value familiar charging protocols and lower upfront costs. Ammunition remains a stable 3-4% share, with the US Army consuming 12,000 tons for small-arms rounds despite lead-free training projectiles gaining ground. Construction demand posts a muted 1.5% CAGR, linked to radiation shields in new hospitals. Electronics solder contracted 8% as RoHS tin-silver-copper alloys spread, though aerospace exemptions preserve a 15,000-ton niche.
Forklift OEMs commercialized fast-charge flooded batteries that reach 80% state of charge in one hour, narrowing the convenience gap with lithium at a 40% cost advantage. Medical-imaging shields employ 8-12 mm lead sheets as emerging markets expand cancer-treatment capacity. Marine batteries for small craft sustain a 2.0% CAGR, as anglers and pleasure-boat operators prioritize price over weight. The diversified application mix dampens volatility that could stem from automotive substitution.


By Supply Source: Secondary Supply Extends Its Lead
Secondary material secured 62.65% of the 2025 supply and is projected to increase at a 2.29% CAGR to 2031, outstripping primary mining’s slower trajectory. EU circular mandates alone divert 150,000-200,000 tons away from virgin metal, embedding recycled content as the default in regional production. North America reaches a 99% collection rate, feeding Ecobat’s 450,000-ton annual throughput. Primary output clings to relevance where recycling systems lag, such as parts of Africa, and for ultra-high-purity grades used in specialty applications. Vedanta’s zinc byproduct streams in India achieve sub-USD 1,000 cash costs, demonstrating that polymetallic synergies can still compete.
Urban-mining subsidies in China compress secondary cash costs to well below USD 900 per ton, exporting deflationary pressure worldwide. When LME prices dip under USD 2,000, high-cost mines in Canada or Australia idle capacity, reinforcing secondary dominance and nudging the lead market size toward a more circular structure.
By Product Form: Refined Ingots Remain Core as Oxides Surge
Refined lead (ingots) retained a 54.18% share in 2025, yet oxides and lead chemicals posted the fastest 3.02% CAGR. Battery-grade PbO commands premiums of USD 200-300 per ton, encouraging smelters to integrate downstream. Calcium-lead alloys for maintenance-free starter batteries grew 4% year-on-year on wider start-stop adoption. Constrained concentrate availability trimmed treatment charges to USD 120 per ton in 2025, rewarding secondary plants able to bypass mined intermediates.
EnerSys’s Barton oxide plant claims 95% conversion efficiency while cutting energy use by 20%. Specialty chemicals such as lead acetate remain niche but stable at 20,000 tons annually, mainly for aerospace coatings. The value-chain shift toward higher-margin oxides and alloys safeguards producer profitability even when ingot spreads tighten.
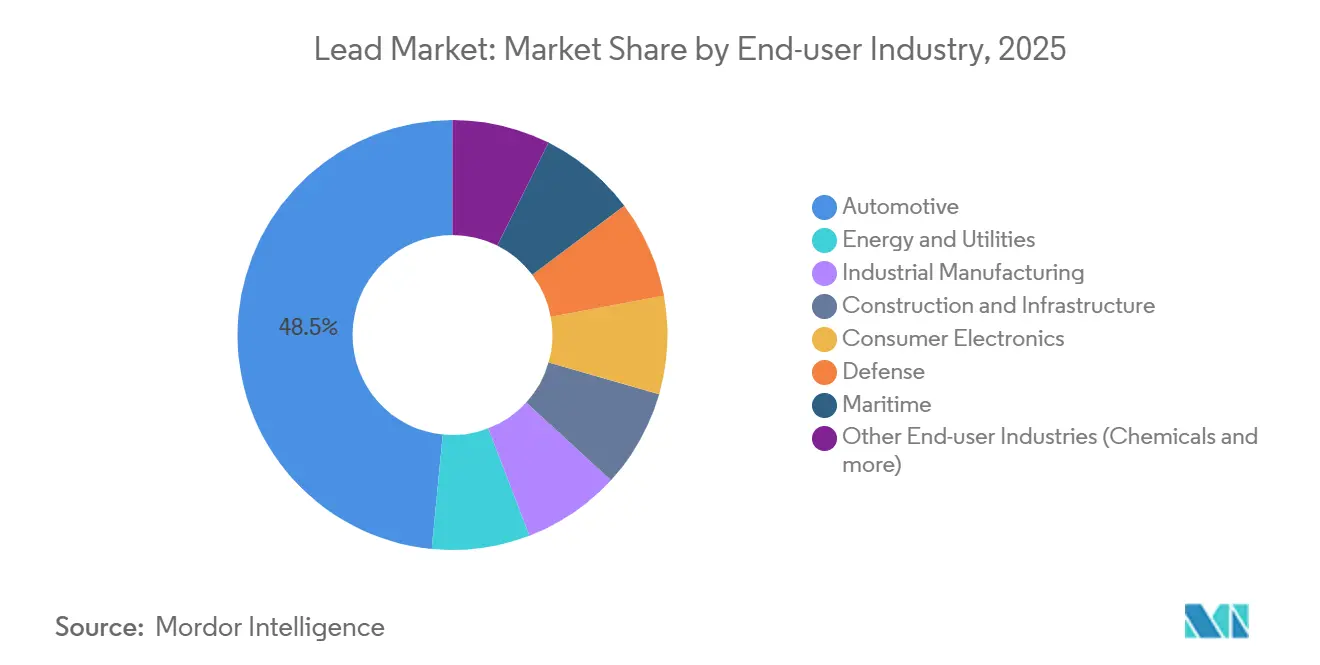
By End-User Industry: Automotive Dominates While Utilities Accelerate
The automotive sector consumed 48.45% of lead in 2025, yet utility installations form the fastest 3.19% CAGR through 2031 as operators deploy VRLA banks for frequency regulation. California and Texas installed 800 MWh of lead-acid storage in 2025 at USD 150-200 per kWh, 40-50% below lithium once safety systems are included. Industrial manufacturing rises 2.5% annually with data-center UPS and warehouse electrification. Construction grows 1.8% on hospital shielding demand, while consumer electronics retreat 3% as RoHS lead bans widen.
California’s SGIP allocated USD 150 million in 2025 for small-scale solar-plus-storage projects, and VRLA units qualified under the fire-safety clause. Telecom tower rollouts in India relied solely on lead-acid backup because lithium logistics remain immature. The diverse end-user base limits downside from any single substitution threat.
Geography Analysis
Asia-Pacific captured 51.28% of 2025 volume and will pace growth at 2.99% through 2031. China’s CNY 5 billion urban-mining subsidy program raised collection to 98% and secured 55-60% of global secondary output. India’s EMPS lifted low-speed EV subsidies, supporting 1.5 million e-rickshaws that rely on lead packs 40-50% cheaper than lithium. ASEAN logistics fleets mirror the pattern, adopting three-wheelers for last-mile deliveries where daily mileage remains under 25 km. Japan and South Korea focus on high-purity refined metal, with Korea Zinc’s Onsan complex achieving 92% recovery from polymetallic concentrates. Australia’s Broken Hill curtailments sliced 30,000 tons of primary supply in 2025, nudging the region toward imported and recycled metal.
North America is fueled by a 99% battery collection rate and Ecobat’s 17-facility network. EPA lead-service-line removal cuts plumbing demand, but channels recovered metal straight into smelters. Teck’s Trail refinery unlocks 15,000 tons from zinc residues. Mexico’s Monterrey battery hub uses recycled feedstock to meet USMCA content rules. PFAS compliance costs nevertheless weigh on primary smelters that rely on electrowinning.
In Europe, German OEMs test LFP starters but cold-weather issues slow rollout. Ecobat’s UK and German sites avoid major PFAS retrofits, securing a USD 50-70 per ton cost edge over primary competitors. Russian volumes divert to domestic markets under sanctions, balancing regional supply. In South America, Brazilian replacement demand remains resilient, while the Middle East and Africa are experiencing growth owing to infrastructure projects requiring shielding and backup power.

Competitive Landscape
The Lead market is fragmented. White-space opportunities reside in emerging-market collection networks. Redwood Materials, initially a lithium recycler, processed 5,000 tons of lead-acid units in 2025 to leverage shared logistics and reduce handling costs by 25%. Terrapure BR and Battery Solutions LLC operate in jurisdictions with streamlined permitting, undercutting incumbents burdened by legacy remediation liabilities. As PFAS compliance costs and ore-grade decline squeeze primary margins, consolidation is likely among smaller smelters lacking integrated recycling.
Lead Industry Leaders
Glencore
KOREAZINC
Teck Resources Limited
Vedanta Resources Limited
Nyrstar
- *Disclaimer: Major Players sorted in no particular order

Recent Industry Developments
- March 2025: Nafees Batteries’ new lead battery recycling plant in Qatar was opened by the JMJ Group. The plant will process ULAB into high-purity lead alloys as part of plans to boost sustainability across the state.
- February 2025: Luminous Power Technologies inaugurated its new industrial battery plant in northern India. The facility features a green positive plate manufacturing system, utilizing 100% grey oxide via a wet paste filling method. With an annual production capacity ranging from 1.5 GWh to 2 GWh, the plant also houses a state-of-the-art laboratory for lead-acid and alternative chemistries.


Global Lead Market Report Scope
Lead is a soft, dull, malleable chemical element with the symbol Pb, which can be derived from mined ores such as lead sulfide (PbS) galena, cerussite (lead carbonate), anglesite (lead sulfate), and scraps, including batteries, pipes, etc. Lead finds its major application in lead-acid batteries, followed by pigments, ammunition, cable sheathing, and others. The lead market is segmented by application and geography. The market is segmented by application into ammunition, batteries, construction, electronics, marine, plumbing, and other applications. The report also covers the market sizes and forecasts for the lead market in 15 countries across the major regions. For each segment, the market sizing and forecasts have been done based on volume (tons).
| Ammunition |
| Batteries |
| Construction |
| Electronics |
| Marine |
| Plumbing |
| Other Applications (Shielding, Chemical Processing, etc.) |
| Primary (Mining) |
| Secondary (Recycled) |
| Refined Lead (Ingot) |
| Lead Alloys |
| Lead Oxide & Chemicals |
| Lead Concentrates |
| Automotive |
| Energy & Utilities |
| Industrial Manufacturing |
| Construction & Infrastructure |
| Consumer Electronics |
| Defense |
| Maritime |
| Other End-user Industries (Chemicals, etc.) |
| Asia-Pacific | China |
| India | |
| Japan | |
| South Korea | |
| ASEAN Countries | |
| Rest of Asia-Pacific | |
| North America | United States |
| Canada | |
| Mexico | |
| Europe | Germany |
| United Kingdom | |
| France | |
| Italy | |
| Russia | |
| Rest of Europe | |
| South America | Brazil |
| Argentina | |
| Rest of South America | |
| Middle East and Africa | Saudi Arabia |
| United Arab Emirates | |
| South Africa | |
| Egypt | |
| Rest of Middle East and Africa |
| Application | Ammunition | |
| Batteries | ||
| Construction | ||
| Electronics | ||
| Marine | ||
| Plumbing | ||
| Other Applications (Shielding, Chemical Processing, etc.) | ||
| Supply Source | Primary (Mining) | |
| Secondary (Recycled) | ||
| Product Form | Refined Lead (Ingot) | |
| Lead Alloys | ||
| Lead Oxide & Chemicals | ||
| Lead Concentrates | ||
| End-User Industry | Automotive | |
| Energy & Utilities | ||
| Industrial Manufacturing | ||
| Construction & Infrastructure | ||
| Consumer Electronics | ||
| Defense | ||
| Maritime | ||
| Other End-user Industries (Chemicals, etc.) | ||
| Geography | Asia-Pacific | China |
| India | ||
| Japan | ||
| South Korea | ||
| ASEAN Countries | ||
| Rest of Asia-Pacific | ||
| North America | United States | |
| Canada | ||
| Mexico | ||
| Europe | Germany | |
| United Kingdom | ||
| France | ||
| Italy | ||
| Russia | ||
| Rest of Europe | ||
| South America | Brazil | |
| Argentina | ||
| Rest of South America | ||
| Middle East and Africa | Saudi Arabia | |
| United Arab Emirates | ||
| South Africa | ||
| Egypt | ||
| Rest of Middle East and Africa | ||


Key Questions Answered in the Report
What is the projected size of the lead market by 2031?
It is forecast to reach 18.89 million tons by 2031, growing at a 2.04% CAGR.
Which region contributes the most to global lead demand?
Asia-Pacific accounts for 51.28% of 2025 volume and will remain the largest contributor through 2031.
Why does secondary lead supply grow faster than primary mining?
Regulatory recycled-content mandates and lower operating costs drive a 2.29% CAGR for recycled metal versus 1.65% for virgin sources.
How are PFAS regulations affecting lead smelters?
North American and EU smelters must invest USD 20-30 million per facility to replace PFAS chemicals, adding USD 8-12 per ton to costs.
What is the fastest growing end-user segment for lead?
Energy and utility storage is set to expand at a 3.19% CAGR as operators deploy VRLA batteries for grid stability.
Page last updated on:


