Ready-to-Drink Shakes Market Size and Share
Market Overview
| Study Period | 2021 - 2031 |
|---|---|
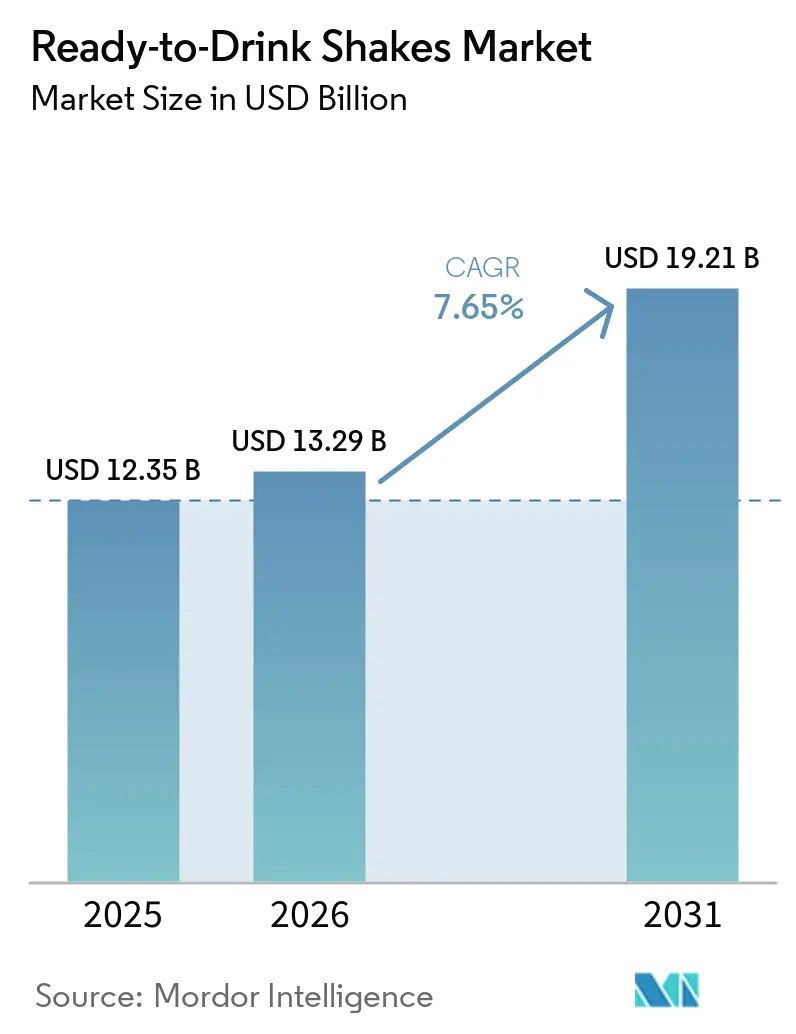
| Market Size (2026) | USD 13.29 Billion |
| Market Size (2031) | USD 19.21 Billion |
| Growth Rate (2026 - 2031) | 7.65% CAGR |
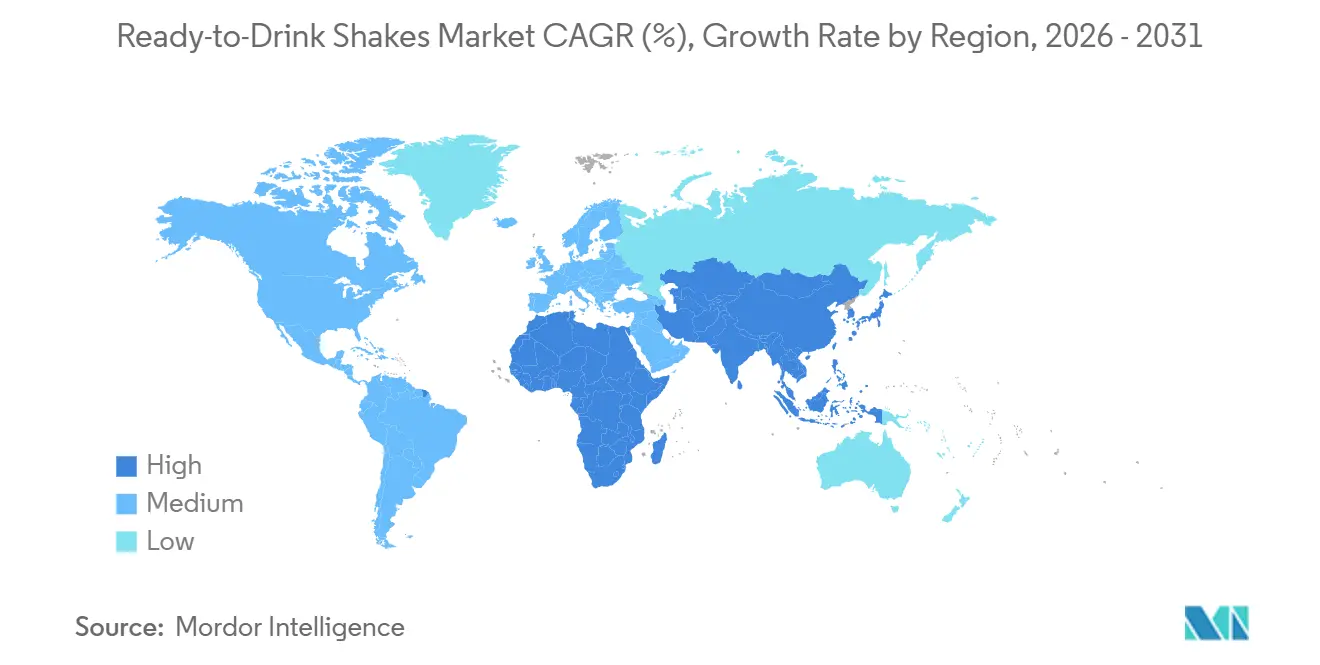
| Fastest Growing Market | Asia Pacific |
| Largest Market | North America |
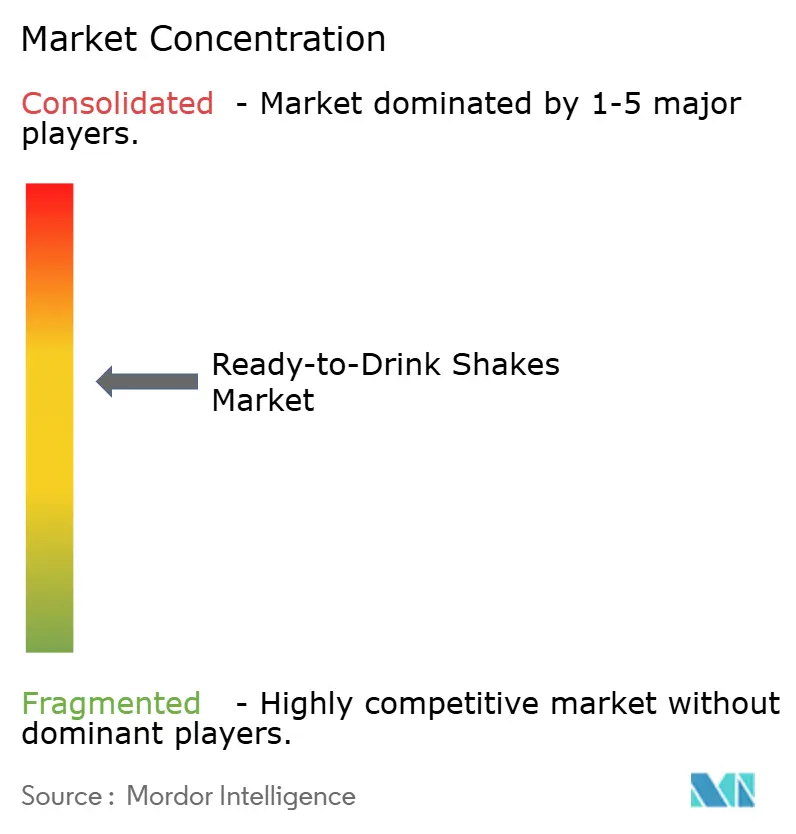
| Market Concentration | Medium |
Major Players
*Disclaimer: Major Players sorted in no particular order Image © Mordor Intelligence. Reuse requires attribution under CC BY 4.0. |
|
Ready-to-Drink Shakes Market Analysis by Mordor Intelligence
The ready-to-drink shakes market size is projected to expand from USD 12.35 billion in 2025 and USD 13.29 billion in 2026 to USD 19.21 billion by 2031, registering a CAGR of 7.65% between 2026 and 2031. Changing dietary preferences, the increasing adoption of GLP-1 therapies (used for weight management and diabetes treatment), and a growing trend toward convenient, portion-controlled meal replacements are driving demand for these products. While athletes and fitness enthusiasts have traditionally been the primary consumers, the market is now attracting a broader audience, including individuals seeking healthier meal alternatives. North America leads the market due to its extensive retail network and high per capita protein consumption. Meanwhile, the Asia-Pacific region is witnessing the fastest growth, driven by the rising popularity of gym memberships and fitness activities in urban areas across countries such as China, India, and Southeast Asia. The market remains moderately consolidated, with a few key players dominating the competitive landscape.
Key Report Takeaways
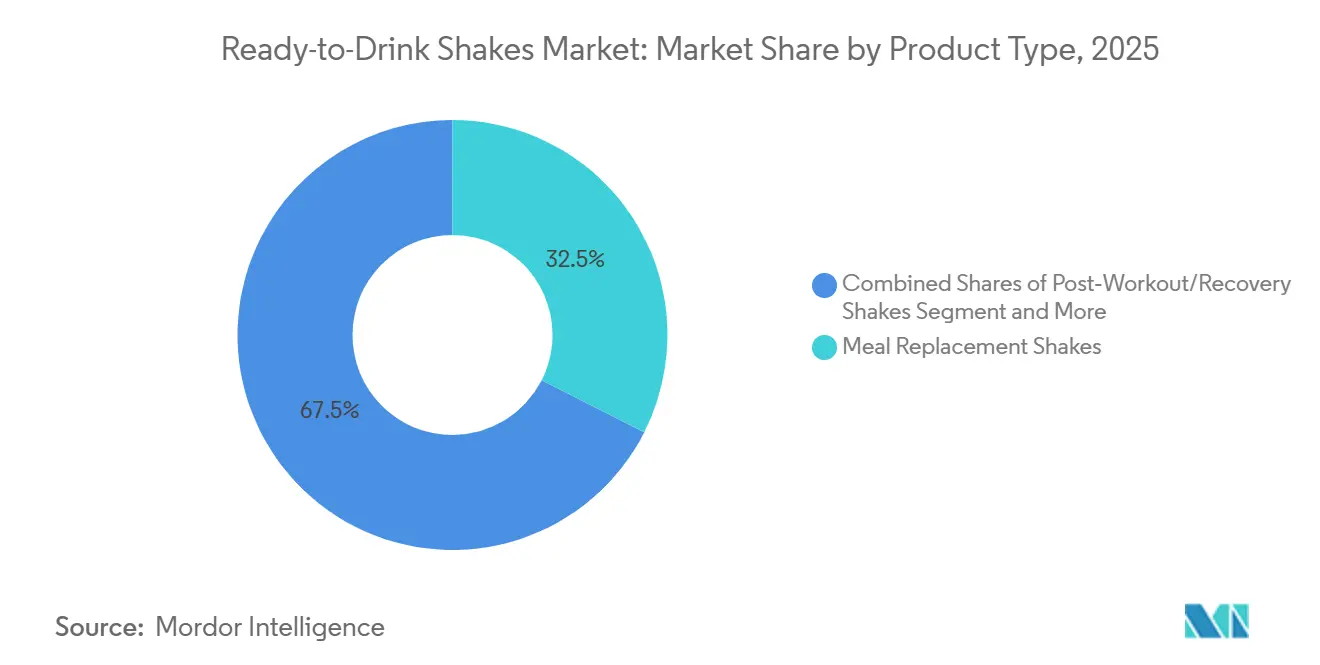
- By product type, meal replacement shakes led with 32.48% of the ready-to-drink shakes market share in 2025, while post-workout recovery shakes are forecast to advance at a 9.32% CAGR through 2031.
- By flavor profile, flavored variants accounted for 91.06% of sales in 2025; plain formulations are expected to grow at a 8.51% CAGR between 2026 and 2031.
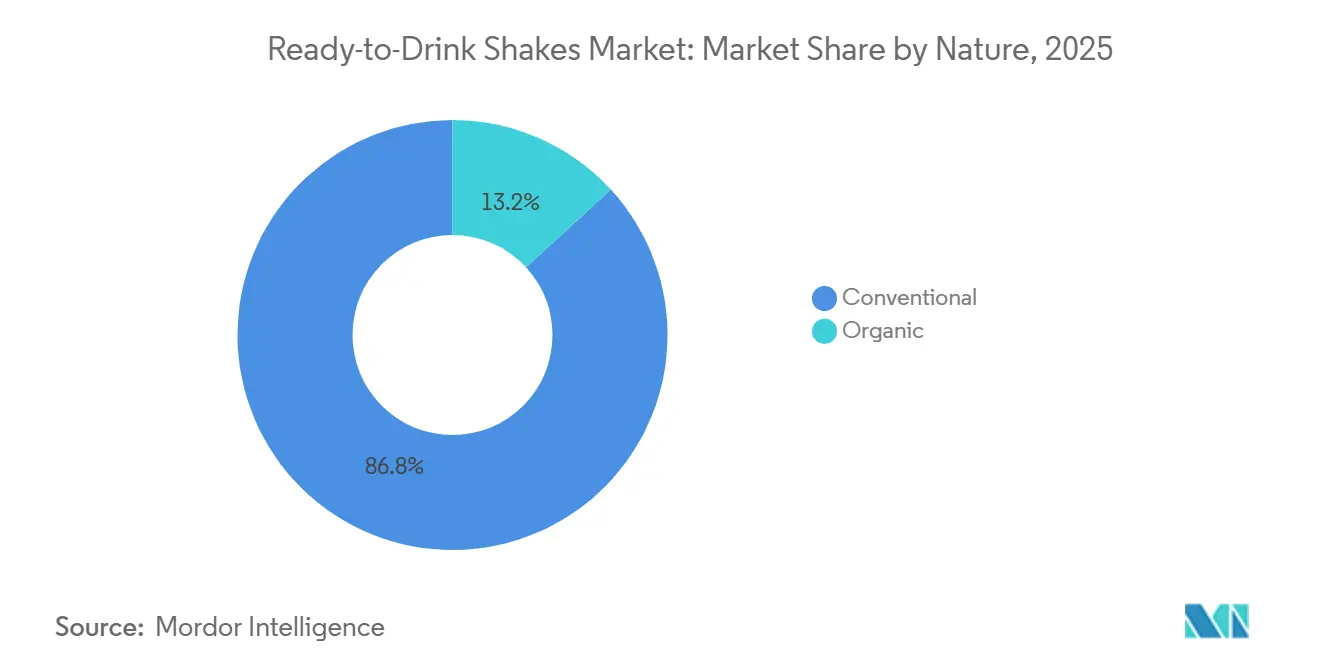
- By nature, conventional offerings accounted for 86.84% of the market share in 2025, whereas organic formulations are forecast to record a 9.16% CAGR through 2031.
- By packaging type, bottles captured 65.16% share of the ready-to-drink shakes market size in 2025, and cans are projected to grow at an 8.55% CAGR between 2026 and 2031.
- By distribution channel, supermarkets and hypermarkets accounted for 43.21% of global revenue in 2025; online retail is poised to register a 9.54% CAGR through 2031.
- By geography, North America contributed 37.65% of 2025 sales; Asia-Pacific is anticipated to achieve the fastest regional expansion at an 8.47% CAGR through 2031.
Note: Market size and forecast figures in this report are generated using Mordor Intelligence’s proprietary estimation framework, updated with the latest available data and insights as of January 2026.
Global Ready-to-Drink Shakes Market Trends and Insights
Drivers Impact Analysis*
| Driver | (~) % Impact on CAGR Forecast | Geographic Relevance | Impact Timeline |
|---|---|---|---|
| Rising consumer preference for convenient and on-the-go nutritional beverages | +1.8% | Global, with strongest uptake in North America and urban Asia-Pacific | Medium term (2-4 years) |
| Growing participation in sports, fitness activities, and gym culture | +1.5% | North America, Europe, urban China and India | Long term (≥ 4 years) |
| Demand for high-protein diets among millennials and younger consumers | +1.3% | Global, particularly North America and Western Europe | Medium term (2-4 years) |
| Busy lifestyles encouraging consumers to replace traditional meals with convenient beverages | +1.2% | Global, with highest penetration in North America, Japan, South Korea | Short term (≤ 2 years) |
| Continuous product innovation in flavors, ingredients, and functional benefits | +1.0% | Global, led by North America and Europe for Research and Development | Medium term (2-4 years) |
| Growing demand for lactose-free and allergen-free nutritional beverages | +0.9% | North America, Europe, Australia | Medium term (2-4 years) |
| Source: Mordor Intelligence | |||
Rising consumer preference for convenient and on-the-go nutritional beverages
Consumers are increasingly turning to ready-to-drink shakes due to their convenience and suitability for busy lifestyles. These shakes offer a quick, easy way to meet nutritional needs without preparation, making them a popular choice for individuals with long working hours or hectic schedules. The growing demand for meal and snack alternatives that save time has significantly boosted the ready-to-drink shakes market. According to the Organization for Economic Co-operation and Development (OECD), the employment rate reached 95.1% as of July 2025, highlighting the fast-paced nature of modern life and the need for convenient nutrition options[1]Source: Organization for Economic Co-operation and Development, "OECD Unemployment Rate Remained Stable at 4.9% in July 2025", oecd.org. While ready-to-drink shakes were initially popular among fitness enthusiasts, their use has expanded to include breakfast replacements, workplace nutrition, and daily energy boosts. To meet consumers' evolving needs, manufacturers are developing innovative formulations packed with protein, vitamins, and functional ingredients that support overall wellness.
Growing participation in sports, fitness activities, and gym culture
The growing popularity of sports, fitness, and gym culture is driving significant growth in the ready-to-drink shakes market. More people are becoming health-conscious and adopting active lifestyles, leading to a higher demand for protein-rich, functional beverages. These drinks are now a common choice for individuals looking to support muscle recovery, boost energy, and enhance overall performance. According to the Sports and Fitness Industry Association (SFIA), nearly 250 million Americans participated in at least one sport, fitness, or leisure activity in 2025, showcasing the growing consumer base for sports nutrition products[2]Source: Sports and Fitness Industry Association, "Participation Hits New High, but Majority of Americans Not Yet Meeting Recommended Guidelines of Weekly Activity, SFIA’s 2026 Topline Report Finds", sfia.org. Ready-to-drink shakes are gaining preference over traditional protein powders due to their convenience, ease of use, and portability. Additionally, the rise of home fitness programs, boutique gyms, and wellness-focused habits in emerging markets like India and China is further fueling market growth. Consumers in these regions are increasingly seeking convenient and nutritious options to complement their fitness routines.
Demand for high-protein diets among millennials and younger consumers
The growing popularity of high-protein diets, especially among millennials and younger consumers, is driving the ready-to-drink shakes market. Social media fitness trends, wellness influencers, and nutrition-tracking apps are encouraging people to focus on increasing their protein intake for better weight management, muscle health, and overall wellness. A 2025 survey by the International Food Information Council (IFIC) found that nearly 70% of Americans were actively trying to consume more protein, underscoring the growing priority of protein-rich diets[3]Source: International Food Information Council, "2025 IFIC Food and Health Survey", ific.org. Younger consumers, in particular, prefer ready-to-drink shakes because they are convenient, easy to carry, and well-suited to busy, active lifestyles. Additionally, the rising use of GLP-1 weight management therapies is boosting the demand for protein-enriched drinks, as these products help maintain lean muscle and provide controlled nutrition. This trend is further fueling the market's growth.
Continuous product innovation in flavors, ingredients, and functional benefits
The ready-to-drink shakes market is growing steadily, driven by continuous product innovation in flavors, ingredients, and health benefits. Manufacturers are developing new formulations that include probiotics, collagen, vitamins, adaptogens, fiber, and plant-based proteins to meet the changing preferences of health-conscious consumers. To appeal to a wider audience, companies are also introducing low-sugar, lactose-free, and functional nutrition beverages. For example, in March 2026, Not Rocket Science launched India’s first savory plant-based ready-to-drink protein shake category with unique flavors like Gazpacho. This highlights the increasing focus on offering differentiated products with innovative taste options in the market. Additionally, advancements in aseptic manufacturing and shelf-stable packaging technologies are helping brands produce ready-to-drink shakes with longer shelf life, making them more convenient for consumers and easier to distribute across various regions.
Restraints Impact Analysis*
| Restraint | (~) % Impact on CAGR Forecast | Geographic Relevance | Impact Timeline |
|---|---|---|---|
| High product prices compared to traditional beverages | -1.2% | Global, most acute in price-sensitive markets (Latin America, Southeast Asia, Africa) | Short term (≤ 2 years) |
| Growing concerns regarding high sugar content, artificial additives, and preservatives | -0.9% | North America, Europe, Australia | Medium term (2-4 years) |
| Availability of substitute products such as protein bars, smoothies, and powdered supplements | -0.7% | Global, particularly North America and Europe | Medium term (2-4 years) |
| Stringent food safety regulations and labeling requirements related to nutritional claims | -0.5% | North America, Europe, Asia-Pacific (China, India) | Long term (≥ 4 years) |
| Source: Mordor Intelligence | |||
Growing concerns regarding high sugar content, artificial additives, and preservatives
Concerns about high sugar content, artificial additives, and preservatives are slowing the growth of the ready-to-drink shakes market. Consumers are becoming more health-conscious and are paying closer attention to ingredient labels. Many are avoiding products with excessive sugar, artificial flavors, chemical preservatives, and synthetic sweeteners. This shift is largely driven by increasing awareness of health issues like obesity, diabetes, and other lifestyle-related conditions. As a result, there is a growing demand for clean-label products made with natural, minimally processed ingredients. Governments and regulatory bodies in various countries are introducing stricter rules to reduce sugar levels and improve ingredient transparency. These regulations are putting pressure on manufacturers to comply. For example, the United States Department of Agriculture (USDA) recently updated school nutrition standards, setting limits on added sugar in beverages.
Availability of substitute products such as protein bars, smoothies, and powdered supplements
The growth of the ready-to-drink shakes market is being held back by the availability of substitute products such as protein bars, smoothies, powdered supplements, Greek yogurt, and functional snacks. Consumers are increasingly choosing nutrition products based on factors such as convenience, cost, taste, and customization, often switching between alternatives depending on their lifestyle and specific needs. For example, powdered supplements are more affordable per serving and allow users to tailor ingredients to their preferences. Similarly, protein bars and functional snacks are easier to carry and consume while on the move, making them a popular choice for busy individuals. The rising demand for high-protein foods, creatine-based products, and fortified dairy snacks is intensifying competition across the broader nutrition and wellness industry.
*Our forecasts treat driver/restraint impacts as directional, not additive. The impact forecasts reflect baseline growth, mix effects, and variable interactions.
Segment Analysis
By Product Type: Recovery Shakes Outpace Meal Replacements
Meal replacement shakes accounted for the largest share of the ready-to-drink shakes market in 2025, contributing 32.48% of the total revenue. This growth is primarily driven by increasing demand for convenient, ready-to-consume beverages that provide balanced nutrition. These shakes are particularly popular among busy professionals, fitness enthusiasts, and individuals focused on weight management. To meet changing consumer preferences, manufacturers are developing products with high protein content, reduced sugar levels, and added functional benefits, making them more appealing to health-conscious buyers.
Post-workout recovery shakes are expected to grow significantly during the forecast period, with a projected CAGR of 9.32% through 2031. This segment is gaining traction as more people engage in fitness activities and become aware of the importance of muscle recovery and hydration. Consumers are looking for ready-to-drink shakes that include essential nutrients like protein, amino acids, vitamins, and electrolytes to support their post-exercise needs. Additionally, the rise of gym culture, advancements in product innovation, and a preference for clean-label ingredients are driving the demand for these recovery-focused beverages.


By Flavor Profile: Plain Variants Gain Traction
Flavored ready-to-drink shakes led the global market in 2025, accounting for 91.06% of the total market share. Consumers prefer these shakes for their appealing taste, with popular flavors including chocolate, vanilla, coffee, and fruit. The demand for flavored ready-to-drink shakes has grown significantly, driven by younger consumers seeking protein-enriched beverages that also taste good. To cater to health-conscious buyers, manufacturers are introducing products with low sugar, high protein, and added functional ingredients, further boosting the popularity of this segment.
Plain ready-to-drink shakes are expected to grow steadily, with a projected CAGR of 8.51% through 2031. This growth is fueled by increasing consumer awareness of the benefits of reducing sugar intake and of choosing clean-label, natural products. These formulations are particularly appealing to individuals following specialized diets, such as keto, diabetic-friendly, or low-calorie plans. Additionally, the rising trend of personalized nutrition and the use of ready-to-drink shakes as meal replacements in fitness and medical nutrition are driving demand for plain and unsweetened options, ensuring their long-term market growth.
By Nature: Organic Certification Drives Premium Growth
Conventional ready-to-drink shakes dominated the market in 2025, accounting for 86.84% of global market share. This strong performance is attributed to their easy availability, affordable pricing, and wide variety of options across retail channels. Consumers favor these products for their established brands, diverse flavors, and ease of purchase at supermarkets, convenience stores, and online platforms. Additionally, manufacturers are focusing on enhancing these shakes by adding fortified ingredients, increasing protein content, and offering functional health benefits, which further boosts their popularity among a broad consumer base.
Organic ready-to-drink shakes are expected to grow significantly, with a projected CAGR of 9.16% through 2031. This growth is driven by rising consumer demand for clean-label products made with non-GMO and naturally sourced ingredients. Health-conscious buyers are increasingly avoiding artificial additives, preservatives, and synthetic sweeteners, leading to a shift toward organic nutritional drinks. Furthermore, the growing availability of plant-based and sustainably produced organic ready-to-drink shakes is attracting more consumers, especially those seeking environmentally friendly and healthier beverage options. This trend is likely to support the segment's expansion during the forecast period.
By Packaging Type: Cans Gain Share on Sustainability
In 2025, bottles led the ready-to-drink shakes market, accounting for 65.16%. These bottles are popular due to their durability, lightweight design, and affordability, making them a practical choice for both consumers and manufacturers. They are easy to carry, store, and reseal, which appeals to busy, on-the-go consumers. Additionally, manufacturers prefer these materials because they support large-scale production and help extend the shelf life of nutritional beverages, ensuring product quality over time.
Aluminum cans are expected to grow significantly during the forecast period, with a projected CAGR of 8.55% from 2026 to 2031. This growth is driven by rising consumer demand for eco-friendly, recyclable packaging. Aluminum cans are favored for their ability to preserve product freshness, provide strong protection against external factors, and offer a premium look on shelves. As environmental concerns rise and regulations push for reduced plastic use, more beverage companies are adopting aluminum cans, especially for functional and protein-based drinks, to meet sustainability goals and attract environmentally conscious consumers.
By Distribution Channel: E-Commerce Accelerates Direct-to-Consumer
Supermarkets and hypermarkets were the leading distribution channels for the ready-to-drink shakes market in 2025, accounting for 43.21% of total revenue. These stores dominate because they offer high product visibility, a wide variety of brands, and the convenience of purchasing multiple items in one place. Manufacturers benefit from these outlets by showcasing their products on prominent shelves and running promotional campaigns to attract customers. For consumers, supermarkets and hypermarkets offer immediate access to products, the ability to compare options, and the opportunity to buy in bulk at discounted prices.
Online sales channels are expected to grow rapidly, with a projected CAGR of 9.54% through 2031. The increasing popularity of e-commerce platforms, combined with the convenience of home delivery, is driving this growth. Consumers are turning to online platforms for their wide product selection, subscription options, and personalized recommendations tailored to their fitness and nutrition needs. Additionally, many brands are adopting direct-to-consumer strategies, which allow them to connect directly with customers and offer exclusive deals. The rising demand for health and wellness products, along with the ease of online shopping, is expected to further boost the growth of this channel.
Geography Analysis
North America held the largest share of the ready-to-drink shakes market in 2025, accounting for 37.65% of total revenue. This dominance is driven by the region's strong demand for protein-rich beverages, supported by advanced retail networks and continuous product innovation. Consumers in North America are highly aware of fitness, weight management, and functional nutrition, which has led to the widespread adoption of ready-to-drink shakes. Manufacturers are focusing on developing high-protein, low-sugar products to meet changing dietary needs and medical nutrition trends. Additionally, the presence of well-established brands and robust cold-chain infrastructure further strengthens the region's market position.
The Asia-Pacific region is expected to witness the fastest growth in the ready-to-drink shakes market, with a projected CAGR of 8.47% through 2031. Factors such as rapid urbanization, rising disposable incomes, and a growing fitness culture are driving demand in countries such as China, India, and South Korea. Consumers in this region are turning to protein-enriched and functional beverages for convenience and overall wellness. The rising popularity of sports nutrition, coupled with the availability of innovative product formats and expanding retail channels, is further boosting market growth. This trend reflects the region's increasing focus on health and lifestyle improvements.
Europe represents a mature market for ready-to-drink shakes, with steady growth driven by the demand for clean-label, plant-based, and sustainably produced beverages. Consumers in countries such as Germany, the United Kingdom, and France are increasingly seeking products made with natural ingredients, clear labeling, and enhanced nutritional benefits. Regulatory support for healthier food and beverage options, along with a growing interest in vegan and eco-friendly consumption, is encouraging manufacturers to diversify their offerings. Meanwhile, emerging markets in South America and the Middle East and Africa are seeing gradual growth due to improving retail access, a rising middle-class population, and advancements in shelf-stable packaging, making ready-to-drink shakes more accessible to consumers.

Competitive Landscape
The ready-to-drink shakes market is dominated by a few key players, including Abbott Laboratories, BellRing Brands Inc., Nestlé S.A., Danone S.A., and PepsiCo Inc. These companies hold a strong position due to their wide range of products and well-established distribution networks across supermarkets, convenience stores, and online platforms. Their ability to produce on a large scale and maintain strong brand recognition gives them a competitive edge. However, competition is increasing as companies focus on creating unique products to meet the growing demand for innovative and functional beverages. This has led to intensified marketing efforts and a push for differentiation in the market.
Major manufacturers are adopting strategies such as acquisitions and partnerships, and expanding their product portfolios to stay ahead in the market. They are also reformulating their products to meet consumer preferences for healthier options, such as high-protein, low-sugar, and diabetes-friendly shakes. Additionally, companies are investing in direct-to-consumer sales models, subscription services, and personalized nutrition solutions to enhance customer engagement and loyalty. Research and development efforts are focused on introducing clean-label products and functional ready-to-drink shakes that cater to the wellness trends among consumers.
Smaller and emerging brands are gaining popularity by targeting niche markets, such as plant-based nutrition, allergen-free beverages, and low-calorie meal replacements. Companies like OWYN, Koia, and Ripple Foods are leveraging social media, influencer marketing, and creative branding to attract a wider audience. At the same time, advancements in packaging technology, such as aseptic and sustainable materials, are helping brands launch products faster and operate more efficiently. Sustainability has become a key focus, with many companies adopting environmentally friendly packaging to appeal to eco-conscious consumers and stand out in the competitive ready-to-drink shakes market.
Ready-to-Drink Shakes Industry Leaders
-
Abbott Laboratories
-
Nestlé S.A.
-
BellRing Brands Inc.
-
PepsiCo Inc.
-
Danone S.A.
- *Disclaimer: Major Players sorted in no particular order

Recent Industry Developments
- March 2026: Skyway entered India’s ready-to-drink nutrition market with the introduction of Cloud Shake, a protein milkshake made with monk fruit and KSM-66 Ashwagandha. The product delivers 26g of protein, prebiotic fiber, Omega-3, and daily greens to promote overall wellness.
- July 2025: Arla Protein introduced a new ready-to-drink milkshake designed for busy consumers seeking convenient, indulgent snack options. This launch marked the brand's first foray into the ready-to-drink protein category, offering a product that combined taste and nutrition in a portable format.
- July 2025: Premier Protein expanded its fan-favorite ready-to-drink lineup with the launch of Premier Protein Almondmilk Non-Dairy Protein Shakes. Made with real Almondmilk, it contains 20g of non-dairy protein, 160 calories or less, and 5g of sugar.
- June 2025: BioSteel, a Canadian sports nutrition brand known for its no-compromise approach to hydration, expanded into the protein drink market with its first-ever Ready-to-Drink (RTD) protein beverage. With the protein beverage market booming, BioSteel brought its clean-label standards to a category often dominated by sugar-laden or heavily processed formulas.


Global Ready-to-Drink Shakes Market Report Scope
Ready-to-drink shakes are pre-packaged beverages designed to offer convenient nutrition, typically including protein, vitamins, minerals, and other functional ingredients. The global ready-to-drink shakes market is classified by product type, flavor profile, nature, packaging type, distribution channel, and geography. Based on product type, the market is classified into meal replacement shakes, weight loss shakes, energy/pre-workout shakes, post-workout/recovery shakes, and nutritional/general wellness shakes. Based on flavor profile, the market is classified into plain and flavored. Based on nature, the market is classified into organic and conventional. Based on packaging type, the market is classified into bottles, Tetra Pak, cans, and pouches. Based on distribution channel, the market is classified into supermarkets/hypermarkets, convenience/grocery stores, health and pharmacy stores, online retail stores, and other channels. Based on geography, the market is classified into North America, Europe, Asia-Pacific, South America, and the Middle East and Africa. The market forecasts are provided in terms of value (USD).
| Meal Replacement Shakes |
| Weight Loss Shakes |
| Energy/Pre-Workout Shakes |
| Post-Workout/Recovery Shakes |
| Nutritional/General Wellness Shakes |
| Others |
| Plain |
| Flavored |
| Organic |
| Conventional |
| Bottles |
| Tetra Pak |
| Cans |
| Pouches |
| Supermarkets/Hypermarkets |
| Convenience/Grocery Stores |
| Health and Pharmacy Stores |
| Online Retail Stores |
| Other Channels |
| North America | United States |
| Canada | |
| Mexico | |
| Rest of North America | |
| Europe | Germany |
| United Kingdom | |
| Italy | |
| France | |
| Spain | |
| Poland | |
| Belgium | |
| Sweden | |
| Rest of Europe | |
| Asia-Pacific | China |
| Japan | |
| India | |
| Australia | |
| Indonesia | |
| South Korea | |
| Thailand | |
| Singapore | |
| Rest of Asia-Pacific | |
| South America | Brazil |
| Argentina | |
| Colombia | |
| Chile | |
| Peru | |
| Rest of South America | |
| Middle East and Africa | South Africa |
| Saudi Arabia | |
| United Arab Emirates | |
| Nigeria | |
| Egypt | |
| Morocco | |
| Turkey | |
| Rest of Middle East and Africa |
| By Product Type | Meal Replacement Shakes | |
| Weight Loss Shakes | ||
| Energy/Pre-Workout Shakes | ||
| Post-Workout/Recovery Shakes | ||
| Nutritional/General Wellness Shakes | ||
| Others | ||
| By Flavor Profile | Plain | |
| Flavored | ||
| By Nature | Organic | |
| Conventional | ||
| By Packaging Type | Bottles | |
| Tetra Pak | ||
| Cans | ||
| Pouches | ||
| By Distribution Channel | Supermarkets/Hypermarkets | |
| Convenience/Grocery Stores | ||
| Health and Pharmacy Stores | ||
| Online Retail Stores | ||
| Other Channels | ||
| By Geography | North America | United States |
| Canada | ||
| Mexico | ||
| Rest of North America | ||
| Europe | Germany | |
| United Kingdom | ||
| Italy | ||
| France | ||
| Spain | ||
| Poland | ||
| Belgium | ||
| Sweden | ||
| Rest of Europe | ||
| Asia-Pacific | China | |
| Japan | ||
| India | ||
| Australia | ||
| Indonesia | ||
| South Korea | ||
| Thailand | ||
| Singapore | ||
| Rest of Asia-Pacific | ||
| South America | Brazil | |
| Argentina | ||
| Colombia | ||
| Chile | ||
| Peru | ||
| Rest of South America | ||
| Middle East and Africa | South Africa | |
| Saudi Arabia | ||
| United Arab Emirates | ||
| Nigeria | ||
| Egypt | ||
| Morocco | ||
| Turkey | ||
| Rest of Middle East and Africa | ||


Key Questions Answered in the Report
What is the projected value of the ready-to-drink shakes market by 2031?
The market is projected to grow to USD 19.21 billion by 2031, with an expected CAGR of 7.65% during the forecast period from 2026 to 2031.
Which product type is growing fastest through 2031?
Post-workout recovery shakes are expected to post the quickest growth at a 9.32% CAGR, outpacing meal replacements and energy variants.
How large is the organic segment within ready-to-drink shakes?
Organic formulations are expected to grow at a 9.16% CAGR, which is twice as fast as conventional options.
Which region will see the fastest market expansion?
Asia-Pacific is expected to drive market growth, with a projected CAGR of 8.47% through 2031, driven by increasing fitness trends in urban areas of China, India, and Southeast Asia.
Page last updated on:


