
Meal Replacement Shakes Market Size and Share
Market Overview
| Study Period | 2021 - 2031 |
|---|---|
| Market Size (2026) | USD 6.52 Billion |
| Market Size (2031) | USD 9.65 Billion |
| Growth Rate (2026 - 2031) | 8.38 % |
| Fastest Growing Market | Asia Pacific |
| Largest Market | North America |
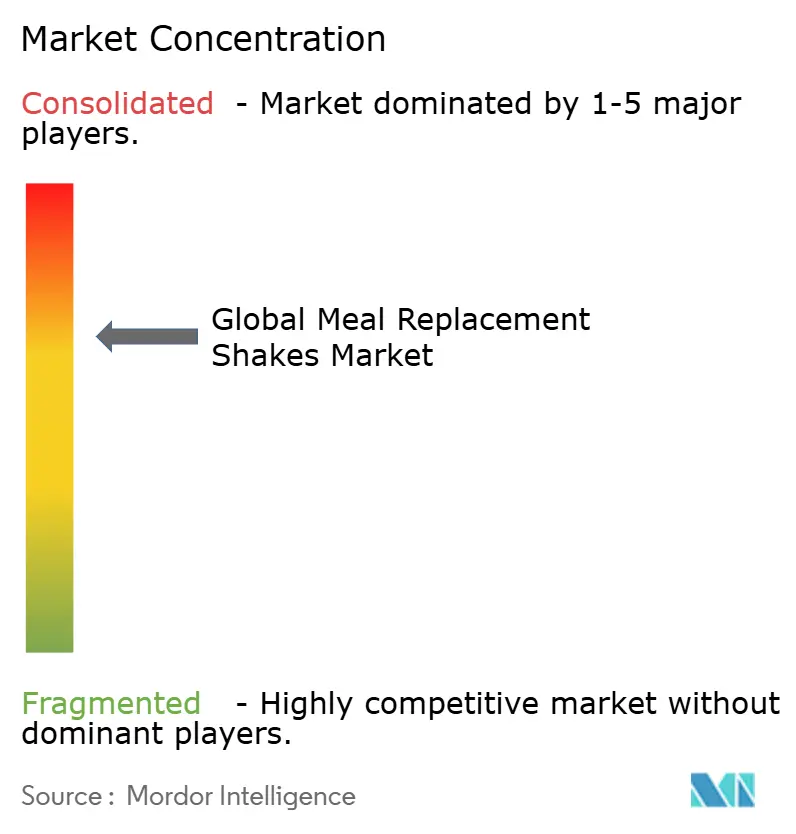
| Market Concentration | Medium |
Major Players *Disclaimer: Major Players sorted in no particular order Image © Mordor Intelligence. Reuse requires attribution under CC BY 4.0. | |
Meal Replacement Shakes Market Analysis by Mordor Intelligence
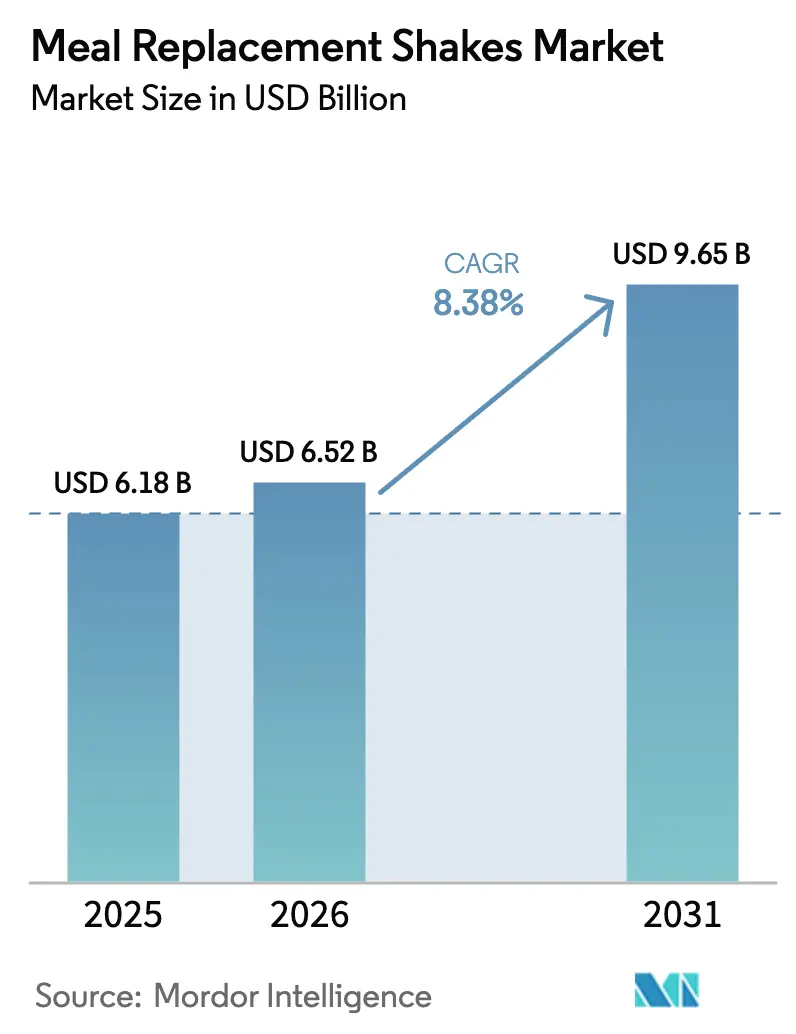
The meal replacement shakes market size is valued at USD 6.52 billion in 2026, growing from the 2025 value of USD 6.18 billion, and is forecast to climb to USD 9.65 billion by 2031, advancing at a 8.38% CAGR. Greater medical endorsement, stricter nutrient‐claim rules, and rapid formulation upgrades are moving the category beyond mere convenience toward clinically aligned nutrition solutions. Ready-to-drink (RTD) formats continue to dominate shelves, yet concentrates and syrups are expanding fastest as hospitals, schools, and nursing homes pivot to lower freight and packaging footprints. Pediatric malnutrition programs and geriatric sarcopenia management are widening the consumer base, while plant-based proteins and zero-sugar formulas unlock new premium niches. Distribution economics are also shifting; supermarkets still drive volume, but subscription-based direct-to-consumer (D2C) models are raising lifetime value through automated replenishment cycles.
Key Report Takeaways
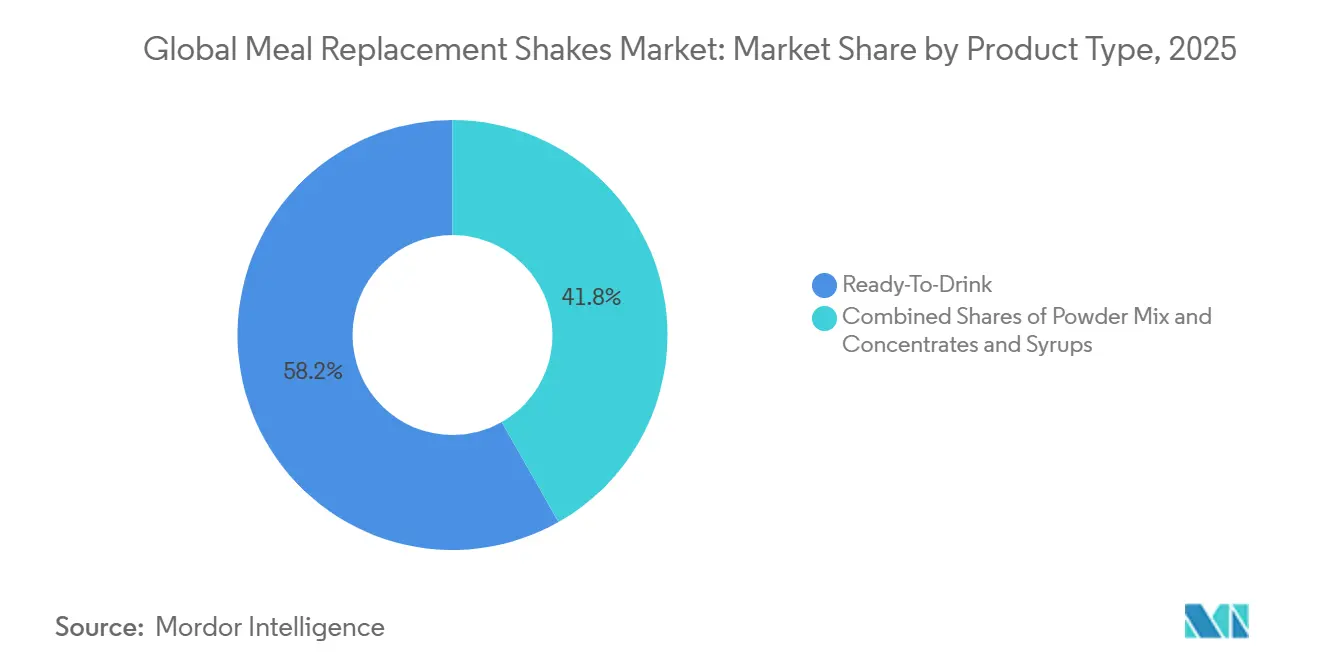
- By product type, ready-to-drink formats held 58.21% of the meal replacement shakes market share in 2025, while concentrates and syrups are forecast to register an 11.20% CAGR through 2031.
- By age group, adults accounted for 45.68% share of the meal replacement shakes market in 2025; the children segment is projected to grow at a 9.81% CAGR to 2031.
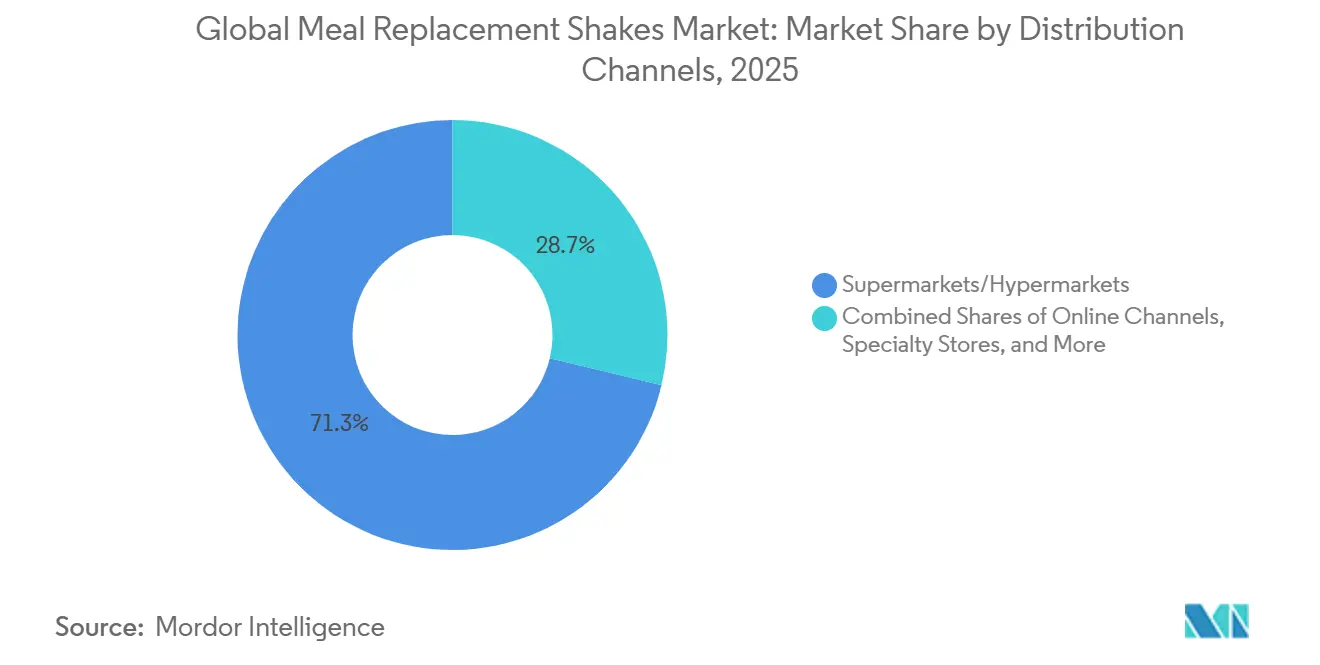
- By distribution channel, supermarkets and hypermarkets commanded 71.25% share of the meal replacement shakes market in 2025, whereas online retail and D2C are advancing at a 10.58% CAGR through 2031.
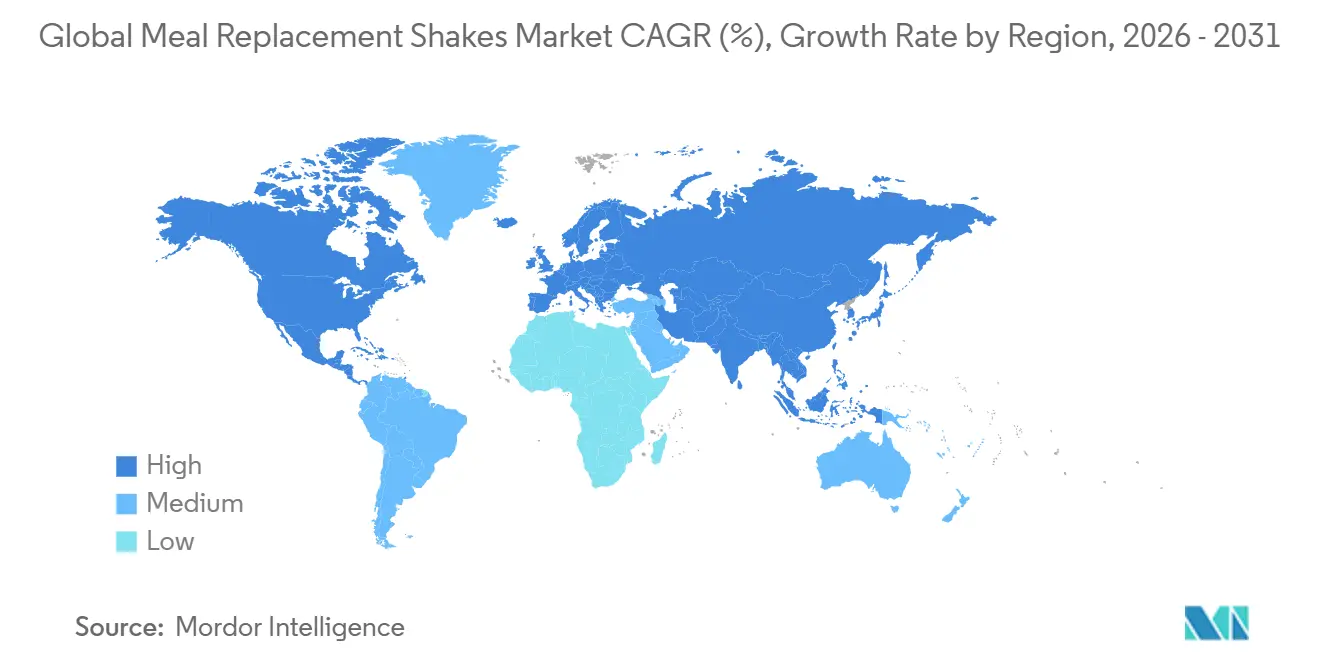
- By geography, North America contributed 48.25% of the revenue share to the meal replacement shakes market in 2025, and the Asia-Pacific region is forecast to expand at an 11.28% CAGR through 2031.
Note: Market size and forecast figures in this report are generated using Mordor Intelligence’s proprietary estimation framework, updated with the latest available data and insights as of January 2026.
Market Trends and Insights
Drivers Impact Analysis of Meal Replacement Shakes Market*
| Drivers | (~) % Impact on CAGR Forecasts | Geographic Relevance | Impact Timeline |
|---|---|---|---|
| Busy urban lifestyles drive need for quick, portable meal options | +1.8% | Global, with concentration in North America, Western Europe, and Asia-Pacific urban centers | Short term (≤ 2 years) |
| Rising Health Consciousness Boosts Preference for Nutrient-Dense Shakes | +1.5% | Global, particularly North America, Europe, and affluent Asia-Pacific markets | Medium term (2-4 years) |
| Product Innovation in Plant-Based, Low-Sugar, and Functional Variants | +2.1% | North America and Europe lead; Asia-Pacific adoption accelerating | Medium term (2-4 years) |
| Fitness Trends and Gym Culture | +1.3% | North America, Europe, and urban Asia-Pacific (China, India, South Korea) | Short term (≤ 2 years) |
| E-Commerce Expansion and Subscription Models | +1.4% | Global, with highest penetration in North America and Western Europe | Medium term (2-4 years) |
| Medical Endorsements for Weight Loss and Malnutrition Management | +1.7% | North America and Europe for weight management; Asia-Pacific, South America, and MEA for malnutrition | Long term (≥ 4 years) |
| Source: Mordor Intelligence | |||
Busy Urban Lifestyles Drive Need for Quick, Portable Meal Options
Urban professionals, constrained by time, are now reducing their meal durations to less than 10 minutes. This shift in behavior was emphasized in the USDA's 2024 Eating & Health Module, which found that 42% of employed adults skip at least one traditional sit-down meal during weekdays[1]. Consequently, liquid meal formats that require no preparation, utensils, or significant cleanup are gaining popularity. Ready-to-drink shakes have emerged as the preferred option for commuters, shift workers, and remote employees who often merge work and meals. This trend is especially evident in megacities such as Tokyo, Mumbai, and São Paulo, where average commute times exceed 60 minutes. In these cities, dense retail networks support impulse purchases at subway kiosks and convenience stores. Brands that secure strategic placements in high-traffic transit areas attract regular customers who value speed over taste. This dynamic explains the 30% to 40% price premium that single-serve RTD formats hold compared to per-serving costs of powder mixes.
Rising Health Consciousness Boosts Preference for Nutrient-Dense Shakes
In South Africa, a 2024 national health and nutrition survey found that 78% of consumers aim to lead healthier lifestyles, with 45% actively tracking their calorie consumption. This changing perspective has led consumers to view meal replacements as functional foods that provide essential micronutrients often missing from ultra-processed convenience meals, rather than just diet aids. Brands are adapting to this trend by highlighting ingredients such as bioavailable minerals like chelated magnesium and ferrous bisglycinate, prebiotic fibers like inulin and resistant starch, and omega-3 fatty acids such as algal DHA, distinguishing themselves from conventional protein powders. Abbott's Ensure, which achieved over USD 3 billion in global sales in 2024, reformulated its core product line to include 27 vitamins and minerals. This strategy targets consumers who see meal replacements as a way to address dietary gaps rather than as emergency food options. The medicalization of nutrition has elevated the category from being discretionary to essential, ensuring steady demand even during economic downturns.
Product Innovation in Plant-Based, Low-Sugar, and Functional Variants
From 2010 to 2023, Google Trends data highlighted a remarkable 3,355% increase in the adoption of plant-based proteins. This growth is primarily driven by the rising popularity of flexitarian diets, increased focus on allergen avoidance, and growing sustainability concerns, particularly among millennial and Gen Z consumers. Pea protein isolates have become strong competitors, equaling whey in digestibility and amino acid profiles. Additionally, faba bean and mung bean concentrates, with their neutral flavor profiles, are simplifying the formulation process. Addressing consumer concerns over the 15 to 20 grams of added sugars in traditional formulations, Beachbody launched Shakeology 0g Added Sugar in June 2024. This product, sweetened with monk fruit and stevia, delivers 130 to 140 kilocalories per serving. Ingredients previously limited to niche wellness brands, such as adaptogens (e.g., ashwagandha and rhodiola), nootropics (e.g., lion's mane and citicoline), and probiotics (e.g., Lactobacillus rhamnosus GG), are now entering mainstream products. This shift is blurring the distinction between meal replacements and dietary supplements. Consequently, regulatory agencies are under pressure to establish clearer labeling standards. For instance, the FDA's December 2024 update on the "healthy" claim explicitly excludes products with added sugars exceeding 2.5 grams per serving.
Medical Endorsements for Weight Loss and Malnutrition Management
Physicians are increasingly supporting meal replacements for weight management and diabetes remission, driven by growing clinical evidence. The Look AHEAD trial, which monitored participants over 8 years, revealed that intensive lifestyle interventions incorporating meal replacements resulted in sustained weight loss and reduced cardiovascular risks. Similarly, the DIRECT and DIADEM-I trials, which employed total diet replacement protocols, reported type 2 diabetes remission rates of 46% and 61%, respectively. These notable findings prompted the Brazilian Association for the Study of Obesity and Metabolic Syndrome (ABESO) to recommend meal replacements as a Class IIa, Level A intervention for structured low-calorie diets in their 2024 guidelines. In addressing malnutrition, the World Health Organization endorses ready-to-use therapeutic foods for severe acute malnutrition, a category closely associated with high-protein shakes, particularly in pediatric and geriatric care[2]. To meet the rising demand for PediaSure and Ensure, products frequently prescribed by physicians for growth challenges and age-related muscle loss, Abbott established new manufacturing facilities in Jhagadia, India; Tipp City, Ohio; and Jiaxing, China in 2025.
Restraints Impact Analysis of Meal Replacement Shakes Market*
| Restraints | (~) % Impact on CAGR Forecasts | Geographic Relevance | Impact Timeline |
|---|---|---|---|
| Regulatory Scrutiny on Nutrition Claims and Sugar Content | -0.9% | Global, with strictest enforcement in North America and Europe | Short term (≤ 2 years) |
| Intense Competition From Bars, Soups, and Ready-to-Drink Alternatives | -0.7% | Global, particularly North America and Europe | Medium term (2-4 years) |
| Lack of Satiety Compared to Solid Meals | -0.5% | Global | Medium term (2-4 years) |
| High Costs Compared to Whole Foods | -0.6% | Global, with greatest impact in price-sensitive emerging markets | Long term (≥ 4 years) |
| Source: Mordor Intelligence | |||
Regulatory Scrutiny on Nutrition Claims and Sugar Content
In December 2024, the FDA finalized new criteria for the "healthy" claim, introducing limits on saturated fat, sodium, and added sugars. These updated standards disqualify many existing product formulations, requiring brands to either reformulate or discontinue front-of-package health messaging. Products with more than 2.5 grams of added sugars per serving are prohibited from carrying "healthy" claims, effectively excluding chocolate and vanilla flavors sweetened with cane sugar or high-fructose corn syrup. Additionally, in 2024, the Food and Drug Administration proposed front-of-package nutrition labeling rules. These rules would require clear disclosure of saturated fat, sodium, and added sugar content. While this enhances transparency, it also exposes formulation weaknesses that competitors could exploit through comparative advertising. In the European Union, Regulation 609/2013 imposes strict requirements for meal replacements targeting weight control. These products must provide 200 to 400 kilocalories, at least 25% of the daily recommended intake for vitamins and minerals, and a minimum of 25 grams of protein. These standards create a compliance barrier that smaller brands often struggle to overcome. In Brazil, ANVISA's RDC 243/2018 regulation classifies dietary supplements as "Suplemento Alimentar." This regulation restricts ingredient lists to those outlined in IN 28/2018 and IN 29/2018. Additionally, the registration process, which takes 12 to 18 months, presents a significant challenge for new entrants to the market.
Intense Competition from Bars, Soups, and Ready-to-Drink Alternatives
From 2013 to 2024, protein bars experienced a fourfold rise in high-protein claims, according to Mintel. These bars now compete directly with shakes, catering to health-conscious consumers seeking convenience. Bars offer better portability, as they do not require refrigeration and eliminate the risk of spillage. Their solid form also enhances satiety by promoting stronger gastric distension and slower gastric emptying compared to liquids. Introduced in fall 2024, the David Bar delivers 28 grams of protein, 150 kilocalories, and zero sugar. This product represents the next generation of bar formulations, matching or surpassing the macronutrient profiles of shakes without the need for shaker bottles or blenders. Brands like Huel and Soylent are redefining categories with ready-to-eat meal kits, soups, and refrigerated bowls. These products incorporate whole-food ingredients and offer textural variety, addressing limitations associated with liquid shakes.
*Our forecasts treat driver/restraint impacts as directional, not additive. The impact forecasts reflect baseline growth, mix effects, and variable interactions.
Meal Replacement Shakes Market Segment Analysis
By Product Type:
Concentrates Capture Cost-Focused DemandConcentrates and syrups are projected to grow at an impressive 11.20% CAGR, surpassing the overall growth rate of the meal replacement shakes market. This format is particularly favored by hospitals and schools due to its cost-efficiency; one liter can yield up to 15 servings, significantly reducing freight and packaging expenses by nearly 70% compared to ready-to-drink (RTD) options. On the other hand, RTD products, known for their convenience, are expected to maintain a dominant position, capturing a notable 58.21% revenue share in 2025. Powder mixes occupy a middle ground between concentrates and RTD products, but their multi-step preparation process can deter consumers seeking quick and mobile solutions. Advances in microencapsulation technology are enhancing the shelf life of powders, while flavor-focused product launches, such as those by Huel, are proving that powders can offer a variety comparable to RTD options.
The concentrates segment is also gaining traction due to its alignment with environmental mandates, as it uses less plastic compared to other formats. However, certain challenges persist, including high viscosity, which limits protein loading, and the risk of flavor dilution errors, which can negatively impact consumer acceptance. To address these challenges, RTD products are evolving by introducing plant-based and zero-sugar variants. These innovations aim to narrow the gap between cost and performance while ensuring a competitive shelf presence in the market.

By Age Group:
Pediatric Shakes Outpace the Core Adult BasePropelled by the increasing medicalization of growth supplementation, the children segment is projected to expand at a robust 9.81% CAGR through 2031. The growing success of PediaSure in India highlights the rising trend of physicians prescribing nutritional products to address feeding difficulties in children. This shift reflects a broader acceptance of medical-grade nutritional solutions for pediatric care. In contrast, the adult cohort, which is expected to account for a 45.68% market share in 2025, is showing signs of market saturation. However, companies like Herbalife continue to maintain their foothold in this segment by utilizing a multi-level marketing model that emphasizes personalized coaching to engage consumers effectively.
Meanwhile, the senior demographic exhibits the highest per-capita consumption of nutritional products, driven by increasing protein requirements of 1.0-1.2 g/kg body weight, as recommended by geriatric dietary guidelines. Healthcare reimbursement policies and insurance coverage are increasingly influencing market dynamics, shifting the focus toward pediatric and senior nutritional formulas. These specialized formulas not only command premium price points but also demonstrate lower promotional elasticity compared to mainstream adult stock-keeping units (SKUs). This trend underscores the growing demand for targeted nutritional solutions that cater to specific age groups and health needs.
By Distribution Channel:
Online Retail Captures Subscription EconomicsOnline retail and D2C are expected to grow at a robust 10.58% CAGR, fueled by advancements in automated replenishment systems and the advantage of lower channel fees. Brands such as Soylent and Huel are leveraging subscription models by offering discounts ranging from 12% to 25%, which has successfully increased purchase frequency from two to four orders annually. Additionally, the integration of social commerce features on platforms like TikTok and Instagram is transforming influencer engagement into seamless and expedited checkout experiences, particularly appealing to Gen Z consumers who prioritize convenience and digital interaction.
Supermarkets and hypermarkets continue to dominate with a substantial 71.25% market share, primarily due to their ability to attract high foot traffic. However, the imposition of slotting fees and markdown guarantees is exerting pressure on brand margins, making profitability a challenge. Convenience and drug stores remain essential for fulfilling top-up purchase needs, as demonstrated by Premier Protein’s widespread availability in CVS and 7-Eleven outlets. Meanwhile, specialty nutrition stores are carving out a niche by offering expert advice, which significantly enhances conversion rates for clinically targeted products such as Ensure and Boost, catering to consumers seeking tailored nutritional solutions.
Geography Analysis
North America Meal Replacement Shakes Market
North America generated 48.25% of the meal replacement shakes market revenue in 2025, supported by insurance reimbursement for medical nutrition and diversified retail coverage. High obesity prevalence and physician acceptance of meal replacements sustain consumer interest. The FDA’s 2024 nutrient-claim tightening will impose reformulation expense through 2027, particularly for sugar-heavy flavors. Consolidation persists as illustrated by Hormel’s 2024 Muscle Milk acquisition, which strengthens its high-protein beverage portfolio.
APAC Meal Replacement Shakes Market
Asia-Pacific is the fastest-growing region with an 11.28% CAGR to 2031. Urbanization, higher disposable income, and streamlined import regulations allow multinationals to localize formulas across India, China, and Southeast Asia. Abbott expanded manufacturing in Jhagadia and Jiaxing during 2025 to meet pediatric and geriatric demand. China’s population aged over 60 is on track to hit 400 million by 2035, underpinning sustained volume growth for high-protein shakes.
EMEA and South America Meal Replacement Shakes Market
Europe enforces EU Regulation 609/2013, creating high compliance costs that favor established players[3]. Germany leads per-capita consumption owing to strong pharmacy channels, whereas France’s Nutri-Score grading penalizes high-sugar SKUs. South America faces currency volatility, with Brazil’s real depreciation raising whey input costs and testing price elasticity. ANVISA’s restrictive ingredient lists further slow new entry. The Middle East and Africa present long-run potential as governments tackle obesity and malnutrition, evidenced by South Africa’s 6.3% annual growth in weight-management products.
Regulatory Landscape
Regulation of meal replacement shakes spans general food rules and, in some markets, specific compositional standards for products positioned for weight control or medical nutrition. In the United States, the FDA finalized an updated definition for the implied nutrient content claim "healthy" on December 27, 2024, tightening limits on saturated fat, sodium, and added sugars, with a mandatory compliance date of February 25, 2028. The FDA also set January 1, 2028 as the uniform compliance date for final food labeling regulations published between January 1, 2025 and December 31, 2026, which determines when label and claim updates must be implemented across portfolios.
Other major markets also apply category-specific requirements that shape formulation and labeling choices. In the European Union, Regulation (EU) No 609/2013 governs foods for specific groups, including total diet replacement for weight control, and links compliance to broader EU food information rules. Australia regulates formulated meal replacements under the Food Standards Code (Standard 2.9.3), with a labeling transition window running from September 13, 2024 to September 13, 2029, while Canada sets meal replacement requirements under Food and Drug Regulations B.24.200 (last modified April 2026). Together, these rules reinforce the need for market-by-market product specifications and claims governance.
Value Chain Analysis
The value chain begins with inputs including dairy proteins (whey and milk protein concentrates), plant proteins (pea and other pulses), oils and MCTs, fibers, sweeteners, vitamins and minerals, flavors, and packaging (single-serve bottles, caps, labels, and cartons). Formulation and premix blending are followed by processing and filling. RTD products typically rely on UHT and aseptic packaging capabilities, while powders, concentrates, and syrups use more dry blending, concentration, and stable packaging formats. Ingredient traceability and quality systems are increasingly tied to procurement, since nutrient claims and category-specific standards in the United States, European Union, Canada, and Australia require audited specifications and consistent documentation.
Midstream production is carried out by brand-owned plants and co-manufacturers, then routed through downstream channels. Supermarkets and hypermarkets remain central for volume distribution, while convenience and drug stores support top-up purchases and specialty nutrition outlets serve clinically positioned products. Online retail and D2C add subscription logistics, automated replenishment, and direct consumer data. Key friction points include volatility in protein and micronutrient inputs, packaging cost swings, and capacity constraints for aseptic lines, all of which affect SKU rationalization (RTD vs powders vs concentrates) and decisions on regional manufacturing footprints.
Competitive Landscape
The meal replacement shakes market, with a moderate concentration, highlights the dominance of a few key multinationals: Abbott, Nestlé, Glanbia, Herbalife, and Danone. Abbott’s Ensure achieved a significant milestone in 2024, surpassing USD 3 billion in revenue. This success was driven by its strong clinical validation and strategic positioning within reimbursement frameworks. Similarly, Herbalife demonstrated its ability to adapt to emerging trends with the February 2024 launch of its GLP-1 Nutrition Companion, showcasing how established players are aligning with drug-adjacent innovations to maintain relevance and capture new opportunities.
Digitally native challengers are leveraging advanced data integration to disrupt the market. Brands such as AG1 and Huel have integrated their offerings with fitness-tracking applications, enabling them to deliver personalized subscription bundles. This approach not only enhances customer lifetime value but also eliminates the need for slotting fees, providing a competitive edge. Additionally, smaller brands are capitalizing on attributes like plant-based formulations and zero-sugar options to carve out distinct niches, effectively bypassing the portfolios of larger incumbents. Mergers and acquisitions remain a critical growth strategy in this market. For example, Nestlé’s phased acquisition of Orgain strengthens its plant-based product portfolio, while Glanbia’s introduction of a SlimFast plant-based variant aligns with the growing flexitarian consumer trend, further diversifying its offerings.
Regulatory compliance continues to shape the competitive landscape, creating both challenges and opportunities. Companies that proactively invest in sugar reduction initiatives and adopt clean labeling practices are better positioned to defend their product claims and maintain shelf visibility. This is particularly crucial as global nutrient-profile labeling regulations become increasingly stringent, compelling market players to adapt and innovate to meet evolving standards.
Meal Replacement Shakes Industry Leaders
-
Abbott Laboratories
-
Nestlé S.A.
-
Glanbia PLC
-
Amway Corp.
-
Herbalife Nutrition
- *Disclaimer: Major Players sorted in no particular order
Meal Replacement Shakes Market Companies Covered in this Report
- Abbott Laboratories
- Glanbia PLC (SlimFast)
- Herbalife Nutrition Ltd.
- Nestlé S.A. (Orgain, Boost)
- The Simply Good Foods Co. (Atkins)
- Huel Ltd.
- Soylent Nutrition Inc.
- Amway Corp. (Nutrilite)
- Danone S.A. (Ensure)
- Kellogg Company (Special K)
- Beachbody LLC (Shakeology)
- Premier Nutrition Co. (Premier Protein)
- IdealShape LLC
- Garden of Life LLC
- Labrada Nutrition
- Vega (WhiteWave Foods)
- PepsiCo Inc.(Muscle Milk)
- GNC Holdings Inc.
- Orgain Inc.
- Jimmy Joy
Market Opportunities and Future Outlook
Product development is opening whitespace at the intersection of higher protein density, lower sugar, and targeted functional positioning. Abbott expanded manufacturing capacity in 2025 across locations including Jhagadia (India), Tipp City, Ohio, and Jiaxing (China) to support demand for medically aligned nutrition tied to pediatric and geriatric use cases. At the same time, the FDA's tightened "healthy" claim criteria (finalized December 2024) raises the bar for sugar and nutrient-profile compliance, creating room for reformulated and clean-label meal replacements that can sustain front-of-pack messaging.
Usage occasions and formats are also broadening beyond classic RTD single-serve shakes. In July 2026, PepsiCo introduced Quaker Oat Shake & Go as a dry mix that consumers combine with liquid, and Danone expanded Silk with shelf-stable Silk Protein Shakes positioned around plant protein and fiber, reinforcing ongoing innovation in portable, shelf-stable offerings that reduce refrigeration dependence. The step-up in protein benchmarks, including BellRing Brands launching Premier Protein Ultimate in July 2026 with 42g of protein per bottle, highlights room for brands to differentiate with concentrated nutrition for weight management and muscle support while managing taste, texture, and labeling constraints.
Recent Industry Developments in Meal Replacement Shakes Market
- June 2026: Nestle announced the acquisition of the remaining 51% stake in Munich-based ready-to-drink meal company yfood Labs, taking full ownership. The deal strengthens Nestle's position in portable, nutrition-focused RTD meals and gives it a route to scale yfood through Nestle's broader manufacturing and distribution footprint.
- May 2026: Abbott launched Ensure Strength Pro in India, positioned around a 31-nutrient blend including 30g of protein to support strength and holistic nourishment for aging adults. The India-focused launch tracks demand for clinically adjacent nutrition and creates a more direct bridge between consumer meal replacements and medical nutrition positioning.
- September 2024: Arla Foods introduced Protein Food to Go in Denmark, a milk-based meal replacement drink line offered in multiple flavors with 30g of protein per serving plus fiber, vitamins, and minerals. The launch added competitive intensity in Europe for complete-nutrition RTD formats and raised expectations for protein-forward formulations in mainstream retail.
Meal Replacement Shakes Market Report Scope and Research Methodology
Market Definition and Coverage
This market covers packaged shakes positioned and used as a meal replacement, counted in value terms across retail and online channels, including ready-to-drink, powder mixes, and concentrates/syrups. Our view stays focused on products that deliver a planned calorie and nutrient profile to substitute one full meal.
Scope exclusions: We exclude standard protein shakes and sports recovery drinks that are mainly marketed for performance or muscle gain rather than replacing a meal.
Segments Covered in This Report
- By Product Type
- Powder Mix
- Ready-to-Drink (RTD)
- Concentrates and Syrups
- By Age Group
- Children (≤12 yrs)
- Adults (18-64 yrs)
- Seniors (65+)
- By Distribution Channel
- Supermarkets and Hypermarkets
- Convenience and Drug Stores
- Online Retail and D2C
- Specialty Nutrition Stores
- Other Distribution Channels
- By Geography
- North America
- United States
- Canada
- Mexico
- Rest of North America
- Europe
- Germany
- United Kingdom
- France
- Italy
- Spain
- Russia
- Netherlands
- Belgium
- Poland
- Rest of Europe
- Asia-Pacific
- India
- China
- Japan
- Australia
- South Korea
- Rest of Asia-Pacific
- South America
- Brazil
- Argentina
- Rest of South America
- Middle East and Africa
- South Africa
- Saudi Arabia
- Rest of Middle East and Africa
- North America
Data Sources, Market Sizing, and Validation
Desk Research
Desk work started with public nutrition and labeling guidance, because it helps separate meal replacements from adjacent drinks and supplements. We reviewed sources such as the US FDA (labeling and claims), the European Commission and EFSA materials on foods with nutrition claims, and Codex Alimentarius guidance that shapes labeling practices across many countries.
To ground the demand signals, we also used health and diet indicators from sources such as the World Health Organization and the OECD, followed by trade and shipment directional checks using UN Comtrade style customs series where relevant. Company annual reports, investor presentations, reputable press, and a paid subscription for company financials and news were then used to map brand portfolios, channel mix shifts (including online), and pricing narratives. The desk sources listed here are illustrative, and other public references were also used for data collection, validation, and clarification during the work.
Primary Interviews and Surveys
Primary work focused on interviews and surveys with product and commercial leaders across packaged nutrition, retail category teams, and distribution partners, so that our inputs on volumes, pricing ladders, and channel dynamics could be checked against buying patterns. We also spoke with regional specialists to confirm how meal replacement positioning, claims sensitivity, and online subscription behavior differ by geography, and then we used these inputs to tighten assumptions that were weaker in public data.
Distribution of primary research fieldwork respondents
| Company type | Respondent position | Region |
|---|---|---|
| Top tier: 39% | CXOs: 19% | APAC: 40% |
| Mid tier: 42% | Functional/Unit leaders: 34% | EMEA: 36% |
| Smaller Players: 19% | Managers: 47% | Americas: 24% |
Market-Sizing & Forecasting
Sizing started from a top-down build that reconstructs category value by region using consumption signals and channel structure, then it is translated into a single global total after currency consistency checks. To keep the totals realistic, we corroborated the result with selective bottom-up approximations, such as sampled price per serving multiplied by estimated servings sold across key channels, followed by distributor and retailer checks where data was available.
Key model inputs included the ready-to-drink versus powder mix versus concentrates/syrups mix, online retail and D2C penetration, typical pack sizes and servings per pack, average selling price movements by format, and shifts tied to weight management interest and convenience eating. Where company disclosures did not cleanly split meal replacement shakes from adjacent nutrition drinks, revenue was adjusted using portfolio mapping and interview-based allocation ranges, and the remaining gap was handled through region-level scaling anchored to channel shares.
For forecasting, we used scenario analysis so near-term price inflation, reformulation pace (for sugar reduction and protein density), and online subscription growth could be varied without breaking the model. Assumptions were reviewed with primary experts so the final curve reflects what is expected to occur in shelves, not just what a trend suggests.
Data Validation & Update Cycle
We cross-checked outputs through triangulation across three angles, namely demand-side signals, channel behavior, and supplier-side disclosures, and then we looked for variances that were too large to be explained by mix or currency. When anomalies showed up, the input trail was rechecked, and targeted follow-ups were done to confirm whether the issue came from definition, pricing, or channel allocation.
Before sign-off, the model goes through a multi-step analyst review, including logic checks at the region and format level, followed by consistency checks against known category dynamics. Reports are refreshed annually, with interim updates triggered by material events such as major regulatory changes, large portfolio shifts, or sharp pricing moves, and a final freshness pass is done right before delivery so clients receive the latest view.
Mordor Intelligence's Meal Replacement Shakes Market Size Measured Against Other Published Estimates
Published market values for meal replacement shakes can look far apart, even when everyone is talking about the same consumer need. The gaps usually come from how the boundary is drawn between true meal replacements and adjacent nutrition drinks, plus differences in how online sales, price per serving, and currency timing are treated.
Pricing checks by format (RTD versus powder mix) and channel-mix validation from interviews are the evidence that keep Mordor Intelligence anchored to a meal replacement demand pool instead of a broader protein beverage bucket. When other publishers fold in sports recovery shakes, meal replacement bars, or wider meal replacement products, the total naturally shifts. It can also move if the base year and inflation assumptions are not refreshed on the same cadence.
Benchmark comparison
| Source | Market Size | Gaps in Research Methodology |
|---|---|---|
| Mordor Intelligence | USD 6.18 B (2025) | |
| Trade Journal A | USD 6.16 B (2025) | Uses a broader narrative scope that may not consistently separate meal replacement shakes from adjacent nutrition beverages across all regions, and the method detail on format-level pricing and channel weighting is limited. |
| Industry Publication B | USD 5.19 B (2024) | Uses an earlier base year and a longer horizon with different inflation and currency assumptions, and the inclusion rules appear to allow more variation in what qualifies as a meal replacement shake across markets. |
The spread is mostly explained by definition control, year selection, and how price per serving is carried forward by format. By keeping the scope tight to meal replacement-positioned shakes and then validating format mix and channel shares, the estimate becomes easier to trace and to update when market conditions change.
Key Questions Answered in the Report
What is the current value of the meal replacement shakes market?
The meal replacement shakes market size is USD 6.52 billion in 2026.
How fast is the category expected to grow through 2031?
Revenue is projected to advance at an 8.38% CAGR, reaching USD 9.65 billion by 2031.
Which product format leads sales today?
Ready-to-drink shakes hold the largest share at 58.21% of 2025 revenue.
Which region is expanding the fastest?
Asia-Pacific is forecast to post an 11.28% CAGR through 2031 due to urbanization and rising disposable income.