Rainbow Trout Market Size and Share
Rainbow Trout Market Analysis by Mordor Intelligence
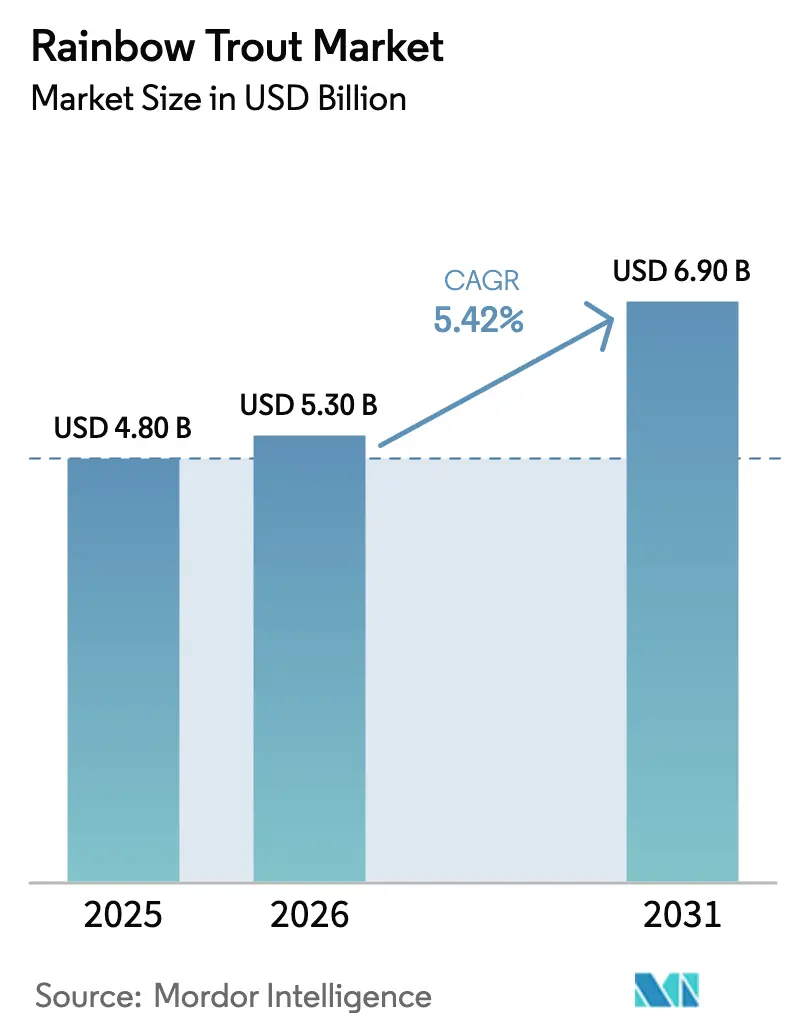
The rainbow trout market was valued at USD 4.8 billion in 2025 and estimated to grow from USD 5.3 billion in 2026 to reach USD 6.9 billion by 2031, at a CAGR of 5.42% during the forecast period (2026-2031). This growth is fueled by the rapid adoption of recirculating aquaculture systems, widening consumer demand for omega-3-rich proteins, and the roll-out of blockchain traceability that secures buyer confidence. Producers are channeling capital into land-based and offshore infrastructure that lessens disease exposure, responds to climate shifts, and satisfies tightening discharge rules. Retailers are broadening antibiotic-free and organic-certified lines to capture premium margins, while online grocery and direct-to-consumer platforms shorten supply chains and lift average order values. At the same time, alternative feed innovations are attracting environmental, social, and governance financing that lowers the cost of capital and accelerates technology uptake.
Key Report Takeaways
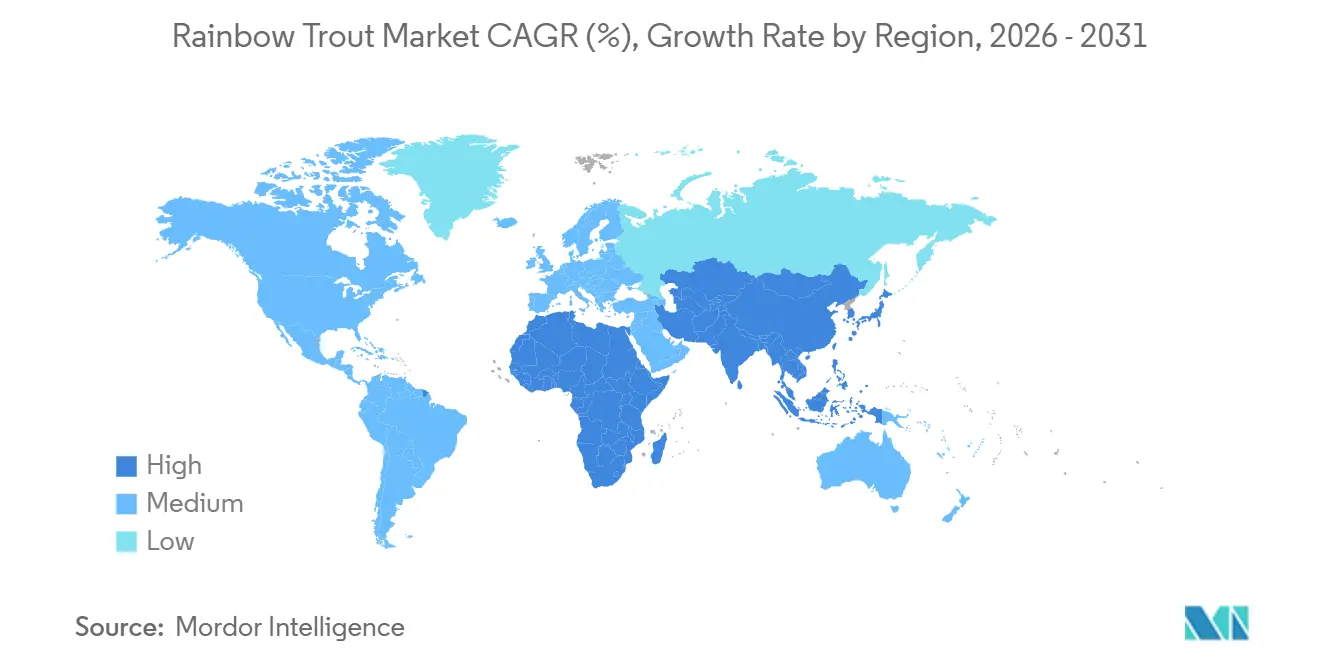
- By geography, Europe led with a 33% rainbow trout market share in 2025, while Asia-Pacific is forecast to be the fastest-growing region at an 8.2% CAGR.
Note: Market size and forecast figures in this report are generated using Mordor Intelligence’s proprietary estimation framework, updated with the latest available data and insights as of January 2026.
Global Rainbow Trout Market Trends and Insights
Drivers Impact Analysis*
| Driver | (~) % Impact on CAGR Forecast | Geographic Relevance | Impact Timeline |
|---|---|---|---|
| Recirculating aquaculture systems and offshore cages | +2.1% | Europe, Asia-Pacific, and North America | Medium term (2-4 years) |
| Consumer shift toward protein-rich omega-3 diets | +1.8% | North America, Europe, urban Asia-Pacific | Long term (≥ 4 years) |
| Government subsidies for cold-water infrastructure | +1.5% | India, China, Turkey, Saudi Arabia, select North American states | Short term (≤ 2 years) |
| Expansion of premium antibiotic-free product lines | +1.2% | North America, Europe, and Australia | Medium term (2-4 years) |
| Blockchain traceability adoption | +0.8% | Europe, North America, spreading to Asia-Pacific | Medium term (2-4 years) |
| Environmental financing linked to novel feeds | +0.7% | Europe, North America, pilot projects in Asia-Pacific and South America | Long term (≥ 4 years) |
| Source: Mordor Intelligence | |||
Recirculating Aquaculture Systems and Offshore Cages
Land-based Recirculating Aquaculture Systems (RAS) and deep-water cages are transforming production economics by decoupling farming from river flows and seasonal temperature swings. Hima Seafood’s USD 235 million Norwegian unit demonstrates year-round harvests while recycling process water. Similar projects in Japan and Finland confirm that closed-loop biofiltration slashes pathogen risk and meets stringent effluent caps. Investors view these systems as future-proof against tightening water rules, which is why capital intensity is falling as modular equipment gains scale. The trend boosts the rainbow trout market by adding capacity in high-value urban zones previously unsuitable for cold-water species.
Consumer Shift Toward Protein-Rich Omega-3 Diets
Health-conscious shoppers in North America, Europe, and rising Asian cities are prioritizing high omega-3 foods aligned with heart-health guidelines[1]. Rainbow trout delivers roughly 1.2 grams of omega-3 per 100 grams, outpacing many white-fish substitutes and avoiding mercury concerns tied to large predators. Surveys show escalating attention to environmental seals such as Aquaculture Stewardship Council certification, linking nutrition to ethical sourcing. Live-fish logistics in China now move Qinghai trout to Beijing within 24 hours, fetching premiums north of 30%. Sustained dietary change rather than fleeting fads keeps volumes rising across supermarket and restaurant channels.
Government Subsidies for Cold-Water Infrastructure
Public programs are lowering capital hurdles and speeding technology transfer to smaller farmers. India set aside INR 193.53 crore (USD 23.2 million) for trout projects in hill states, aiming at 15,000-metric tons output by 2027. The United Kingdom seafood innovation fund awarded GBP 12 million (USD 15.2 million) to Scottish pilots, while New South Wales earmarked AUD 20 million (USD 13.1 million) for hatchery upgrades. These grants shorten payback periods for chilling gear, biosecurity modules, and automated feeding, thereby pulling forward installations that fuel rainbow trout market expansion. Regional clusters also raise local employment, reinforcing political backing for subsequent rounds of spending.
Expansion of Premium Antibiotic-Free Product Lines
Retailers and caterers now stock antibiotic-free and organic-certified trout that commands 20% to 30% higher shelf prices. More than 150 farms adhered to Aquaculture Stewardship Council rules by 2025, and Best Aquaculture Practices standards gained similar traction. United States operators Clear Springs Foods and Riverence Holdings reformulated diets around insect protein to meet National Organic Program thresholds, capturing coveted supermarket slots. Europe’s organic volume grew significantly in 2024, illustrating that premium positioning adds revenue headroom to offset feed-cost volatility. The development stabilizes margins and elevates brand stickiness within the rainbow trout market.
Restraints Impact Analysis*
| Restraint | (~) % Impact on CAGR Forecast | Geographic Relevance | Impact Timeline |
|---|---|---|---|
| Climate-driven water-temperature volatility | -1.4% | North America, Europe, temperate Asia-Pacific | Short term (≤ 2 years) |
| Viral hemorrhagic septicemia and microsporidian diseases | -1.1% | North America, Europe, sporadic Asia-Pacific | Medium term (2-4 years) |
| Stringent effluent and nitrogen-discharge limits | -0.9% | Europe, North America, select Asia-Pacific | Medium term (2-4 years) |
| Competition from land-based salmon and plant analogues | -0.7% | North America, Europe, urban Asia-Pacific | Long term (≥ 4 years) |
| Source: Mordor Intelligence | |||
Climate-Driven Water-Temperature Volatility
Rainbow trout perform optimally at temperatures between 10-15°C, with temperatures exceeding 20°C during summer reducing their feed intake and increasing mortality rates. Water darkening from organic matter runoff decreases light penetration and activates 34 detoxification genes due to oxidative stress. Farm operators respond by installing cooling systems or moving operations to cooler regions, which increases both capital investment and energy costs. While genetic breeding programs for heat-resistant trout show potential, widespread implementation remains several years away. This temperature-driven transformation is reshaping optimal farming locations, with high-altitude areas becoming more suitable while traditional low-elevation farms face increasing challenges.
Viral Hemorrhagic Septicemia and Microsporidian Diseases
Viral Hemorrhagic Septicemia (VHS) outbreaks reduce production by 30-70%, and most jurisdictions lack approved treatments. Microsporidian parasites, including Loma salmonae, decrease growth rates and increase feed costs. Red Mark Syndrome affects skin quality in up to 90% of fish, reducing marketability while maintaining fish survival. The international trade of eggs facilitates pathogen transmission, as demonstrated by Peru's initial RMS case in 2023, which originated from European imports. Aquaculture facilities implement enhanced biosecurity protocols and conduct vaccine research, though these measures increase capital expenses and lengthen investment recovery periods.
*Our forecasts treat driver/restraint impacts as directional, not additive. The impact forecasts reflect baseline growth, mix effects, and variable interactions.
Geography Analysis
Europe held a 33% rainbow trout market share in 2025. Norway anchors supply with more than 70,000 metric tons annually, exporting to Japan, the United States, and intra-European destinations [2]Source: Norwegian Seafood Council, “Norwegian Seafood Exports and Production,” seafood.no. Finland’s Finnforel doubled capacity with a EUR 45 million (USD 48.6 million) recirculating aquaculture system (RAS) expansion that targets Baltic consumers seeking local, certified fish. Denmark champions value-added processing, shipping smoked products to German and British chains that reward traceable sourcing.
Asia-Pacific will be the fastest-growing region at an 8.2% CAGR, propelled by Qinghai high-altitude farms in China, Indian subsidies, and Japanese corporate entries into land-based aquaculture. China's aquaculture industry has seen rapid development, particularly in cold-water fish farming in regions such as Xinjiang, which has significantly increased the availability of fresh rainbow trout in major cities[3]Source: China Fisheries, “Qinghai Trout Production and Markets,” china-fisheries.com. Japan’s NTT facility sells live trout at USD 25 to USD 30 per kilogram to affluent Tokyo buyers, proving urban RAS viability.
North America and South America are advancing, where in the United States produced about nearly 22,000 metric tons in 2025, mainly in Idaho, but stricter nitrogen permits are nudging farms toward retrofits or offshore trials in the Great Lakes. Canada exports organic-certified trout to United States natural-food outlets, leveraging proximity and shared cold-chain infrastructure. Chile shipped more than 40,000 metric tons south-to-north, benefiting from counter-seasonal harvests and established Pacific logistics. Emerging demand in the Middle East and Africa offers future white-space for agile exporters.


Competitive Landscape
Moderate fragmentation defines the rainbow trout market, with the top five suppliers together holding a substantial share of global revenue. Mowi, Leroy Seafood Group, and Cermaq leverage scale in feed purchasing and genetics, cutting input costs by up to 15%. Smaller innovators such as Hima Seafood and NTT deploy cutting-edge recirculating aquaculture systems and artificial intelligence to penetrate premium urban niches. Geographic diversification is also a hedge, as companies position operations across both hemispheres to soften climate and regulatory shocks.
Strategic moves center on vertical integration, alternative feeds, and product certification. Leroy is boosting smoked-fish capacity in Denmark and Scotland to capitalize on delicatessen margins above 40%. Producers that achieve Aquaculture Stewardship Council or Best Aquaculture Practices seals access high-end retail lanes, whereas uncertified rivals compete mainly on cost, amplifying a two-tier dynamic inside the rainbow trout market.
Technology and traceability are emerging differentiators. IBM Food Trust and AquaLedger solutions provide end-to-end provenance that reassures buyers and reduces customs delays. Clear Springs Foods launched direct-to-consumer e-commerce in 2025, garnering average order values above wholesale. Cell-cultured entrants such as Kuleana and plant-based innovators such as Plantish inject future competitive pressure, yet incumbents anticipate defending share through superior taste and verified nutrition. Investment in disease-resistant broodstock, automated processing, and renewable energy supplies rounds out the strategic toolkit.
Recent Industry Developments
- June 2025: Pure Salmon has shifted the focus of its planned Virginia Recirculating Aquaculture System (RAS) project from Atlantic salmon to rainbow trout due to high construction costs and inflation. The project, referred to as “Project Jonah,” will now emphasize a revised operational approach with construction updates planned to support the change in species.
- May 2025: Khyber Aquaculture established India's first recirculating aquaculture system (RAS)-based trout farming facility in Kashmir to enhance fish farming efficiency through controlled production methods.
- March 2025: Nordic Trout, a company owned by the Hukkanen family, launched a 1,000 metric tons capacity offshore rainbow trout farm near Kasko, Finland. This USD 4.7 million project represents their largest and most advanced facility to date. The farm is anticipated to reach full capacity by 2027, with an initial production of 150 metric tons in the first year.


Research Methodology Framework and Report Scope
Market Definitions and Key Coverage
Our study defines the global rainbow trout market as all commercial revenue generated from Oncorhynchus mykiss sold as whole fish or primary processed forms (fillets, frozen blocks, smoked portions, canned meat) that enter retail and food-processing channels. Production from flow-through ponds, recirculating aquaculture systems, net pens, and offshore cages is included and converted to ex-plant value by region-specific average selling prices.
Scope Exclusion: Ready-to-eat meals served in restaurants, hobbyist aquarium trade, and value-added culinary dishes fall outside this scope.
Segmentation Overview
- By Geography
- North America
- United States
- Production Analysis (Production Volume)
- Consumption Analysis (Consumption Value and Volume)
- Import Market Analysis (Import Value, Volume, and Key Supplying Markets)
- Export Market Analysis (Export Value, Volume, and Key Destination Markets)
- Wholesale Price Trend Analysis and Forecast
- Regulatory Framework
- List of Key Players
- Logistics and Infrastructure
- Seasonality Analysis
- Canada
- Production Analysis (Production Volume)
- Consumption Analysis (Consumption Value and Volume)
- Import Market Analysis (Import Value, Volume, and Key Supplying Markets)
- Export Market Analysis (Export Value, Volume, and Key Destination Markets)
- Wholesale Price Trend Analysis and Forecast
- Regulatory Framework
- List of Key Players
- Logistics and Infrastructure
- Seasonality Analysis
- Mexico
- Production Analysis (Production Volume)
- Consumption Analysis (Consumption Value and Volume)
- Import Market Analysis (Import Value, Volume, and Key Supplying Markets)
- Export Market Analysis (Export Value, Volume, and Key Destination Markets)
- Wholesale Price Trend Analysis and Forecast
- Regulatory Framework
- List of Key Players
- Logistics and Infrastructure
- Seasonality Analysis
- United States
- Europe
- United Kingdom
- Production Analysis (Production Volume)
- Consumption Analysis (Consumption Value and Volume)
- Import Market Analysis (Import Value, Volume, and Key Supplying Markets)
- Export Market Analysis (Export Value, Volume, and Key Destination Markets)
- Wholesale Price Trend Analysis and Forecast
- Regulatory Framework
- List of Key Players
- Logistics and Infrastructure
- Seasonality Analysis
- Germany
- Production Analysis (Production Volume)
- Consumption Analysis (Consumption Value and Volume)
- Import Market Analysis (Import Value, Volume, and Key Supplying Markets)
- Export Market Analysis (Export Value, Volume, and Key Destination Markets)
- Wholesale Price Trend Analysis and Forecast
- Regulatory Framework
- List of Key Players
- Logistics and Infrastructure
- Seasonality Analysis
- Spain
- Production Analysis (Production Volume)
- Consumption Analysis (Consumption Value and Volume)
- Import Market Analysis (Import Value, Volume, and Key Supplying Markets)
- Export Market Analysis (Export Value, Volume, and Key Destination Markets)
- Wholesale Price Trend Analysis and Forecast
- Regulatory Framework
- List of Key Players
- Logistics and Infrastructure
- Seasonality Analysis
- Italy
- Production Analysis (Production Volume)
- Consumption Analysis (Consumption Value and Volume)
- Import Market Analysis (Import Value, Volume, and Key Supplying Markets)
- Export Market Analysis (Export Value, Volume, and Key Destination Markets)
- Wholesale Price Trend Analysis and Forecast
- Regulatory Framework
- List of Key Players
- Logistics and Infrastructure
- Seasonality Analysis
- United Kingdom
- Asia-Pacific
- China
- Production Analysis (Production Volume)
- Consumption Analysis (Consumption Value and Volume)
- Import Market Analysis (Import Value, Volume, and Key Supplying Markets)
- Export Market Analysis (Export Value, Volume, and Key Destination Markets)
- Wholesale Price Trend Analysis and Forecast
- Regulatory Framework
- List of Key Players
- Logistics and Infrastructure
- Seasonality Analysis
- India
- Production Analysis (Production Volume)
- Consumption Analysis (Consumption Value and Volume)
- Import Market Analysis (Import Value, Volume, and Key Supplying Markets)
- Export Market Analysis (Export Value, Volume, and Key Destination Markets)
- Wholesale Price Trend Analysis and Forecast
- Regulatory Framework
- List of Key Players
- Logistics and Infrastructure
- Seasonality Analysis
- Indonesia
- Production Analysis (Production Volume)
- Consumption Analysis (Consumption Value and Volume)
- Import Market Analysis (Import Value, Volume, and Key Supplying Markets)
- Export Market Analysis (Export Value, Volume, and Key Destination Markets)
- Wholesale Price Trend Analysis and Forecast
- Regulatory Framework
- List of Key Players
- Logistics and Infrastructure
- Seasonality Analysis
- Myanmar
- Production Analysis (Production Volume)
- Consumption Analysis (Consumption Value and Volume)
- Import Market Analysis (Import Value, Volume, and Key Supplying Markets)
- Export Market Analysis (Export Value, Volume, and Key Destination Markets)
- Wholesale Price Trend Analysis and Forecast
- Regulatory Framework
- List of Key Players
- Logistics and Infrastructure
- Seasonality Analysis
- China
- South America
- Brazil
- Production Analysis (Production Volume)
- Consumption Analysis (Consumption Value and Volume)
- Import Market Analysis (Import Value, Volume, and Key Supplying Markets)
- Export Market Analysis (Export Value, Volume, and Key Destination Markets)
- Wholesale Price Trend Analysis and Forecast
- Regulatory Framework
- List of Key Players
- Logistics and Infrastructure
- Seasonality Analysis
- Chile
- Production Analysis (Production Volume)
- Consumption Analysis (Consumption Value and Volume)
- Import Market Analysis (Import Value, Volume, and Key Supplying Markets)
- Export Market Analysis (Export Value, Volume, and Key Destination Markets)
- Wholesale Price Trend Analysis and Forecast
- Regulatory Framework
- List of Key Players
- Logistics and Infrastructure
- Seasonality Analysis
- Brazil
- Middle East
- United Arab Emirates
- Production Analysis (Production Volume)
- Consumption Analysis (Consumption Value and Volume)
- Import Market Analysis (Import Value, Volume, and Key Supplying Markets)
- Export Market Analysis (Export Value, Volume, and Key Destination Markets)
- Wholesale Price Trend Analysis and Forecast
- Regulatory Framework
- List of Key Players
- Logistics and Infrastructure
- Seasonality Analysis
- Saudi Arabia
- Production Analysis (Production Volume)
- Consumption Analysis (Consumption Value and Volume)
- Import Market Analysis (Import Value, Volume, and Key Supplying Markets)
- Export Market Analysis (Export Value, Volume, and Key Destination Markets)
- Wholesale Price Trend Analysis and Forecast
- Regulatory Framework
- List of Key Players
- Logistics and Infrastructure
- Seasonality Analysis
- United Arab Emirates
- Africa
- South Africa
- Production Analysis (Production Volume)
- Consumption Analysis (Consumption Value and Volume)
- Import Market Analysis (Import Value, Volume, and Key Supplying Markets)
- Export Market Analysis (Export Value, Volume, and Key Destination Markets)
- Wholesale Price Trend Analysis and Forecast
- Regulatory Framework
- List of Key Players
- Logistics and Infrastructure
- Seasonality Analysis
- South Africa
- North America
Detailed Research Methodology and Data Validation
Primary Research
Mordor analysts interviewed trout farmers, feed manufacturers, seafood distributors, and regulators across Europe, North America, Asia-Pacific, and Latin America. These conversations confirmed live-weight to processed-weight ratios, price spreads by size class, survival rates, and upcoming capacity additions that were not visible in public datasets.
Desk Research
Public sources created the first layer of evidence. Production tonnage and farm-gate prices were drawn from the Food and Agriculture Organization, Eurostat aquaculture files, USDA Census of Aquaculture, and NOAA trade dashboards, which together map supply flows and price swings across continents. Scientific journals on feed conversion and water-temperature stress, plus papers from the Federation of European Aquaculture Producers and the Global Seafood Alliance, helped clarify biological and regulatory drivers.
We then tapped D&B Hoovers for company revenues, Dow Jones Factiva for deal news, Volza shipment data for export corridors, and Questel patent abstracts for innovations in recirculating systems. Many other secondary sources supported data checks; the list above is illustrative, not exhaustive.
Market-Sizing & Forecasting
One top-down path multiplies official production volumes by average selling prices to create the 2024 baseline. We verify totals with selective bottom-up samples of processor invoices and retailer pack counts. Key variables feeding the model include farm output by size band, feed cost indices, import shares, average kilo prices, and per-capita retail seafood spending. Forecasts to 2029 rely on an ARIMA time series blended with scenario analysis for climate variance and currency shifts, with assumptions refined through primary-source feedback. Gap areas in bottom-up samples are filled by applying regional yield benchmarks agreed upon during expert calls.
Data Validation & Update Cycle
Model outputs pass multi-layer variance checks against historical series, and anomalies trigger immediate re-contact with sources before supervisor sign-off. According to Mordor Intelligence, every dataset is refreshed annually, with mid-cycle updates if disease outbreaks, regulatory bans, or steep feed-price changes materially move the market.
Why Our Rainbow Trout Baseline Commands Reliability
Published estimates often diverge because firms pick different product mixes, unit conversions, price points, and refresh cadences. We keep a clear commodity focus, align prices to ex-plant level, and revisit variables every twelve months, giving clients a dependable starting point.
Key gap drivers include the mixing of other trout species, use of frozen-weight rather than live-weight equivalents, static exchange rates, and reliance on infrequent producer polls.
Benchmark comparison
| Market Size | Anonymized source | Primary gap driver |
|---|---|---|
| USD 4.58 billion (2024) | Mordor Intelligence | |
| USD 4.20 billion (2023) | Regional Consultancy A | Blends steelhead and restaurant sales |
| USD 2.50 billion (2024) | Global Consultancy B | Limited geographic coverage and single-nation price base |
| USD 6.71 billion (2025) | Trade Journal C | Aggressive volume growth and constant currency without inflation factors |
The comparison shows that our disciplined scope choices, transparent variables, and timely refresh deliver a balanced, repeatable baseline that decision-makers can trust.


Key Questions Answered in the Report
What is the current size of the rainbow trout market?
The rainbow trout market is valued at USD 5.3 billion in 2026 and is projected to reach USD 6.9 billion by 2031, reflecting a 5.42% CAGR.
Which region leads global production?
Europe leads with 33% of revenue in 2025 due to mature cold-water farming infrastructure and strict sustainability certification schemes.
Why are consumers increasingly choosing rainbow trout over other seafood options?
Rainbow trout offers a high-protein, omega-3-rich profile with lower mercury levels than many marine species, aligning with health-driven eating habits.
What technological advances are shaping future production of rainbow trout?
Recirculatory aquaculture systems (RAS) and alternative protein feeds made from insects or microbes are improving water efficiency, controlling biosecurity risks and lowering feed costs.
How does government support affect the rainbow trout industry?
Public funding for infrastructure upgrades, research grants and feed innovation initiatives helps accelerate adoption of advanced farming technologies and enhances overall industry resilience.
Page last updated on:


