Cod Fish Market Size and Share
Cod Fish Market Analysis by Mordor Intelligence
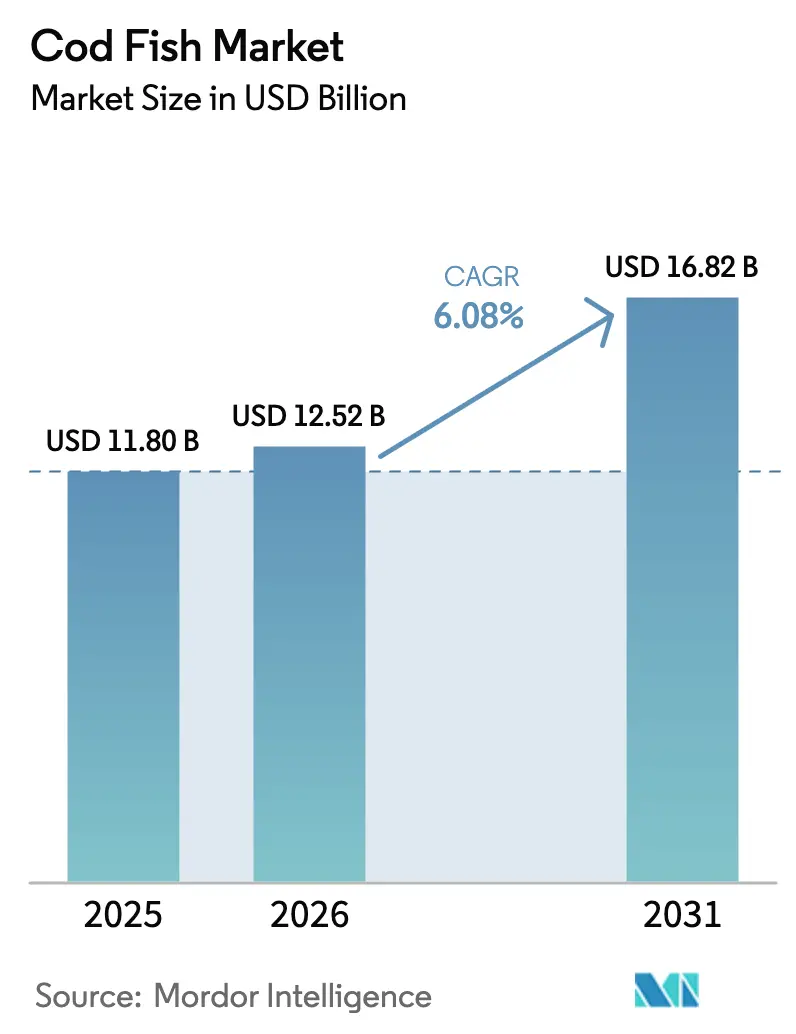
The cod market size is expected to grow from USD 11.8 billion in 2025 to USD 12.52 billion in 2026 and is forecast to reach USD 16.82 billion by 2031 at 6.08% CAGR over 2026-2031. The market expansion continues due to consumer demand for protein-rich lean fish, increasing preference for value-added convenient formats, and growing e-commerce adoption. While Europe maintains its position as the largest regional market, the Middle East shows rapid consumption growth as food service providers expand their protein offerings. Atlantic Cod dominates species sales, with Greenland Cod gaining market share due to improved Arctic accessibility, according to the Food and Agriculture Organization. Supply challenges are increasing as Barents Sea quotas decrease by 14%, resulting in the lowest wild catch volumes in 75 years. The development of aquaculture technology becomes essential for maintaining a consistent year-round supply and supporting premium market segments.
Key Report Takeaways
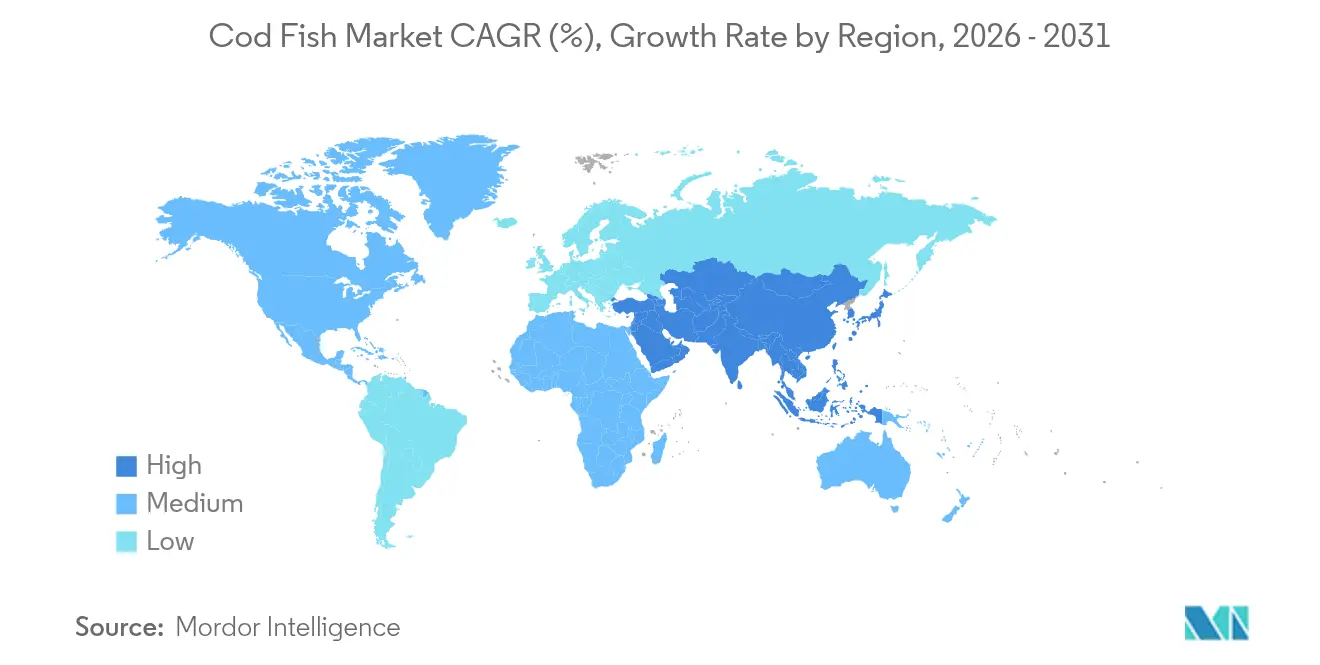
- By geography, Europe held 33.40% of market revenues in 2025, while the Middle East is projected to grow at a 6.65% CAGR until 2031.
Note: Market size and forecast figures in this report are generated using Mordor Intelligence’s proprietary estimation framework, updated with the latest available data and insights as of 2026.
Global Cod Fish Market Trends and Insights
Drivers Impact Analysis*
| Driver | (~) % Impact on CAGR Forecast | Geographic Relevance | Impact Timeline |
|---|---|---|---|
| Growing Demand for Protein-Rich, Low-Fat Seafood | +1.8% | Global, early gains in North America, Europe | Medium term (2-4 years) |
| Government Support for Sustainable Fisheries and Aquaculture | +1.2% | Asia-Pacific core, spill-over to Europe and North America | Long term (≥ 4 years) |
| Convenience-Led Surge in Frozen Cod Product Uptake | +1.5% | Global, especially North America and Europe | Short term (≤ 2 years) |
| Revitalization of Previously Dormant Wild-Cod Fisheries Spurring Supply | +2.4% | Coastal regions with historic cod fleets in Europe and North America | Medium term (2-4 years) |
| Premiumization and Traceability Demand from High-End Channels | +0.9% | Europe, North America, emerging in Middle East | Medium term (2-4 years) |
| Emerging Urban Micro-Recirculating Aquaculture Systems Near Metropolitan Distribution Networks | +1.5% | Major metropolitan areas in North America, Europe, and East Asia | Long term (≥ 4 years) |
| Source: Mordor Intelligence | |||
Growing Demand for Protein-Rich, Low-Fat Seafood
Global protein consumption increased by 40% since 2000, with lean whitefish emerging as a dietary staple. Cod provides 20 g of protein per 100 g serving while containing minimal saturated fat and low mercury levels, making it attractive to health-conscious consumers. Urban lifestyles have increased weekly seafood consumption, with industry surveys indicating that 74% of consumers plan to increase their intake. While restaurant traffic recovered in 2021, at-home consumption remained high, demonstrating the cod market's adaptability across distribution channels. Strong demand continues to support price premiums resulting from harvest limitations, maintaining the cod market's growth momentum.
Government Support for Sustainable Fisheries and Aquaculture
Governments are implementing dual strategies of restricting wild catch quotas while supporting aquaculture development. Norway aims to increase seafood export value by 50% by 2030 through industry collaboration. The United Kingdom's USD 1.75 million (EUR 1.5 million) investment in 2024 in the Sustainable Aquaculture Innovation Centre focuses on disease prevention technologies. Norway's implementation of individual transferable quotas has increased ex-vessel prices, demonstrating the compatibility of economic growth with stock conservation. The Alaska Seafood Marketing Institute's USD 10 million funding request aims to enhance domestic market presence. These policy measures support the cod market's sustained competitiveness.
Convenience-Led Surge in Frozen Cod Product Uptake
The frozen seafood segment is expanding due to improved logistics capabilities and changing consumer cooking preferences. Royal Greenland introduced recyclable packaging in January 2025, addressing regulatory compliance requirements while improving product shelf life. Research demonstrates that storing cod at −40 °C maintains its quality for over 12 months. With home-prepared seafood accounting for 59% of total consumption, the demand for retail freezer space continues to grow. The cod market is gaining additional household consumption opportunities, driving increased market penetration.
Premiumization and Traceability Demand from High-End Channels
High-end restaurants and gourmet retailers require verified product origin. Norwegian skrei maintains higher prices compared to frozen fillets due to its seasonal freshness. The Black Cod Company is developing EU farms focused on Michelin-star restaurant buyers. However, Marine Stewardship Council data indicate minimal price premiums for certain certifications, highlighting the need for refined marketing approaches. Blockchain technology and QR codes provide vessel-to-plate traceability, which is becoming a key differentiator in the cod market. This traceability also helps mitigate trade disruptions, such as China's planned 5% tariff increase on frozen imports in 2025.[1]Food and Agriculture Organization, “GLOBEFISH ‒ Market Reports on Groundfish,” FAO, fao.org
Restraints Impact Analysis*
| Restraint | (~) % Impact on CAGR Forecast | Geographic Relevance | Impact Timeline |
|---|---|---|---|
| Quota Cuts from Over-Fishing Reduce Wild-Capture Supply | -2.1% | Global, especially North Atlantic | Short term (≤ 2 years) |
| Climate Change Shifting Cod Habitats and Productivity | -1.3% | Arctic and North Atlantic, expanding globally | Long term (≥ 4 years) |
| High feed and Operating Expense in Land-Based Cod Aquaculture Systems | -0.9% | Global, particularly developed markets with high energy costs in North America and Europe | Medium term (2-4 years) |
| Growing Demand for Cost-Effective Whitefish Alternatives | -1.8% | Global, particularly price-sensitive markets in Asia-Pacific and emerging economies | Short term (≤ 2 years) |
| Source: Mordor Intelligence | |||
Quota Cuts from Overfishing Reduce Wild Capture Supply
The Barents Sea allocation for 2025 decreased by 31% to 311,587 metric tons, reaching its lowest level since 1950. ICES recommended zero catches for Kattegat cod, except for unavoidable by-catch in the lobster fishery.[2]European Union, “Council Regulation on Fishing Opportunities 2025–2026,” eur-lex.europa.eu Global landings declined from 1.3 million metric tons in 2023 to 1.1 million metric tons in 2024, affecting processors and increasing raw material costs. The Georges Bank biomass remains at 32% of the target level, necessitating a rebuilding plan with restricted commercial quotas through 2027.[3]New England Fishery Management Council, “Atlantic Cod Rebuilding Plan Status,” nefmc.orgThese reductions constrain supply and increase price volatility throughout the cod market.
Climate Change Shifting Cod Habitats and Productivity
Rising temperatures in the North Sea have reduced food availability, leading to declining cod recruitment, while Barents Sea cod stocks have temporarily increased under current warming conditions. The Marine Stewardship Council's suspension of Northeast Atlantic mackerel certifications demonstrates the governance challenges when fish populations move across national boundaries. In South Korea, warming coastal waters resulted in cod imports of 2,306 metric tons in 2023, reflecting a decline in domestic catches.[4]U.S. Department of Agriculture, “Korea: Frozen Cod Imports 2023,” USDA, usda.gov The Food and Agriculture Organization's models predict reduced maximum catch potential in tropical regions, indicating future protein security risks for countries in lower latitudes. These environmental changes create significant uncertainty for long-term cod market planning and investment decisions.
*Our forecasts treat driver/restraint impacts as directional, not additive. The impact forecasts reflect baseline growth, mix effects, and variable interactions.
Geography Analysis
Europe accounts for 33.40% of global turnover in 2025, supported by its proximity to North Atlantic fishing grounds and established culinary traditions that maintain cod as a regular household meal. Norway dominates with over 20% of the global quota, maintaining an integrated value chain from fishing fleets to processing and retail distribution. However, the 2025 Barents quota reduction to 311,587 metric tons constrains raw material availability, compelling processors to secure farmed alternatives and diverse import sources. While EU quota frameworks through 2026 provide planning stability, enhanced traceability requirements increase operational costs.
The Middle East exhibits the highest growth rate at 6.65% CAGR, with Saudi Arabia's expanding hospitality sector and Turkey's position as a distribution center for Gulf retailers driving demand. Saudi Vision 2030 tourism objectives increase hotel and restaurant seafood consumption, while higher consumer incomes encourage household purchases of chilled and frozen cod. Regional governments' investments in desalination-supported aquaculture facilities may reduce import reliance and alter market dynamics.
North America benefits from Alaska's scientific management approach, with ASMI targeting 50% domestic market share through Responsible Fisheries Management certification and traceability-focused marketing campaigns. While Russian import restrictions benefit U.S. exporters in Europe, Canadian processors lag behind Nordic competitors in automation adoption. In Asia-Pacific, China's January 2025 tariff increase from 2% to 5% on frozen cod redirects trade toward tariff-free nations, particularly in Southeast Asia. South America and Africa remain small-scale cod markets, though improving cold storage infrastructure and increasing middle-class wealth indicate potential growth in the coming decade.


Recent Industry Developments
- May 2025: Norwegian Ode has partnered with Akva Group to launch the world's first commercial deep-water cod farm, marking a significant development in offshore aquaculture engineering.
- March 2025: A consortium backed by Mazzetta Company acquired a U.S.-based whitefish and scallop processor, strengthening its vertical integration capabilities in North America.
- January 2025: Royal Greenland introduced recyclable packaging for cod products to comply with European environmental regulations.


Research Methodology Framework and Report Scope
Market Definitions and Key Coverage
Our study defines the cod fish market as all edible Atlantic, Pacific, Greenland, and other Gadus species sold in fresh, frozen, canned, or salted formats through retail and food-service channels worldwide. Values are expressed in nominal USD at the manufacturer level after standard currency conversions.
Scope exclusion: Cod liver oil, pharmaceutical extracts, and animal-feed by-products are not counted.
Segmentation Overview
- By Geography (Production Analysis (Volume), Consumption Analysis (Volume and Value), Import Analysis (Volume and Value), Export Analysis (Volume and Value), and Price Trend Analysis)
- North America
- United States
- Canada
- Mexico
- Europe
- Spain
- United Kingdom
- France
- Germany
- Italy
- Norway
- Russia
- Asia-Pacific
- China
- India
- Japan
- Australia
- South Korea
- South America
- Brazil
- Argentina
- Middle East
- Turkey
- Saudi Arabia
- United Arab Emirates
- Africa
- South Africa
- Egypt
- North America
Detailed Research Methodology and Data Validation
Primary Research
Mordor analysts interviewed processors, cold-chain operators, import brokers, and seafood buyers across Europe, North America, and East Asia, then surveyed aquaculture technologists and sustainability officers. These discussions clarified live weight-to-product yield factors, typical wholesale mark-ups, and realistic uptake of farmed cod, allowing us to cross-check desk findings and refine model assumptions.
Desk Research
We began with public datasets such as FAO FishStat capture and aquaculture volumes, Eurostat trade codes for 0302/0303, NOAA landing reports, and tariff line data released by UN Comtrade, which together reveal supply flows, quota cuts, and average export prices. Industry insights were enriched with Marine Stewardship Council stock status briefs, OECD seafood consumption dashboards, and food retail scanner notes. Company filings, investor decks, and reputable press added brand, pricing, and channel context. Subscription files from D&B Hoovers and Dow Jones Factiva supplied financial indicators and news that helped us benchmark leading processors. The sources cited here are illustrative; several other public and paid references informed data collection and verification.
Market-Sizing & Forecasting
A top-down construct starts with national capture quotas and farm output, converted to edible weight and multiplied by indicative landed prices. Results are corroborated through bottom-up roll-ups of sampled processor revenues and regional channel checks. Key variables include Barents Sea Total Allowable Catch revisions, average ex-vessel prices, farmed cod output growth, per-capita white-fish intake, e-commerce penetration in seafood retail, and currency movements. Multivariate regression, supplemented by scenario analysis for quota shocks, projects each driver, and gaps in bottom-up samples are bridged with price-volume proxies confirmed in expert calls.
Data Validation & Update Cycle
Outputs pass variance screens against time-series trade statistics and consumption surveys before senior review. We refresh every twelve months and issue interim updates when policy shifts or disease events materially alter supply or demand. A final quality check is performed immediately prior to publication so clients receive the latest view.
Why Mordor's Cod Fish Baseline Commands Reliability
Published estimates often diverge because firms vary species coverage, include or exclude liver oil, and apply distinct price conversion rules.
Key gap drivers are usually mismatched quota assumptions, inconsistent treatment of farmed tonnage, and differing refresh cadences, which are all aligned in Mordor's disciplined framework.
Benchmark comparison
| Market Size | Anonymized source | Primary gap driver |
|---|---|---|
| USD 11.80 B (2025) | Mordor Intelligence | - |
| USD 12.03 B (2024) | Global Consultancy A | Includes liver-oil revenue and broader demersal species |
| USD 10.50 B (2023) | Regional Consultancy B | Uses historic three-year average prices, omits farmed output |
| USD 11.40 B (2024) | Trade Journal C | Applies conservative capture quota scenario and partial channel coverage |
The comparison shows that when scope, price points, and refresh cadence are normalized, Mordor's balanced baseline stands closest to real traded volumes, giving decision-makers a trustworthy starting point for strategic choices.


Key Questions Answered in the Report
What is the current value of the cod market?
The cod market stands at USD 12.52 billion in 2026 and is projected to rise to USD 16.82 billion by 2031, reflecting a 6.08% CAGR.
Which region buys the most cod?
Europe leads consumption with a 33.40% revenue share in 2025, proximity to North Atlantic fishing grounds, and long-established culinary habits.
Why are cod prices so volatile?
A 31% cut in the 2025 Barents Sea quota and other stock reductions have constrained wild supply, pushing up procurement costs even as demand stays firm.
How will China’s higher tariff affect global cod trade?
The January 2025 import duty hike from 2% to 5% is likely to divert some cod shipments toward tariff-free partners in Europe and North America, reshaping trade lanes over the next few seasons.
Page last updated on:


