
Fishmeal And Fishoil Market Size and Share
Market Overview
| Study Period | 2021 - 2031 |
|---|---|
| Market Size (2026) | USD 11.17 Billion |
| Market Size (2031) | USD 16.13 Billion |
| Growth Rate (2026 - 2031) | 7.63 % |
| Fastest Growing Market | Middle East |
| Largest Market | Asia Pacific |
| Market Concentration | Medium |
Major Players
*Disclaimer: Major Players sorted in no particular order Image © Mordor Intelligence. Reuse requires attribution under CC BY 4.0. |
|
Fishmeal And Fishoil Market Analysis by Mordor Intelligence
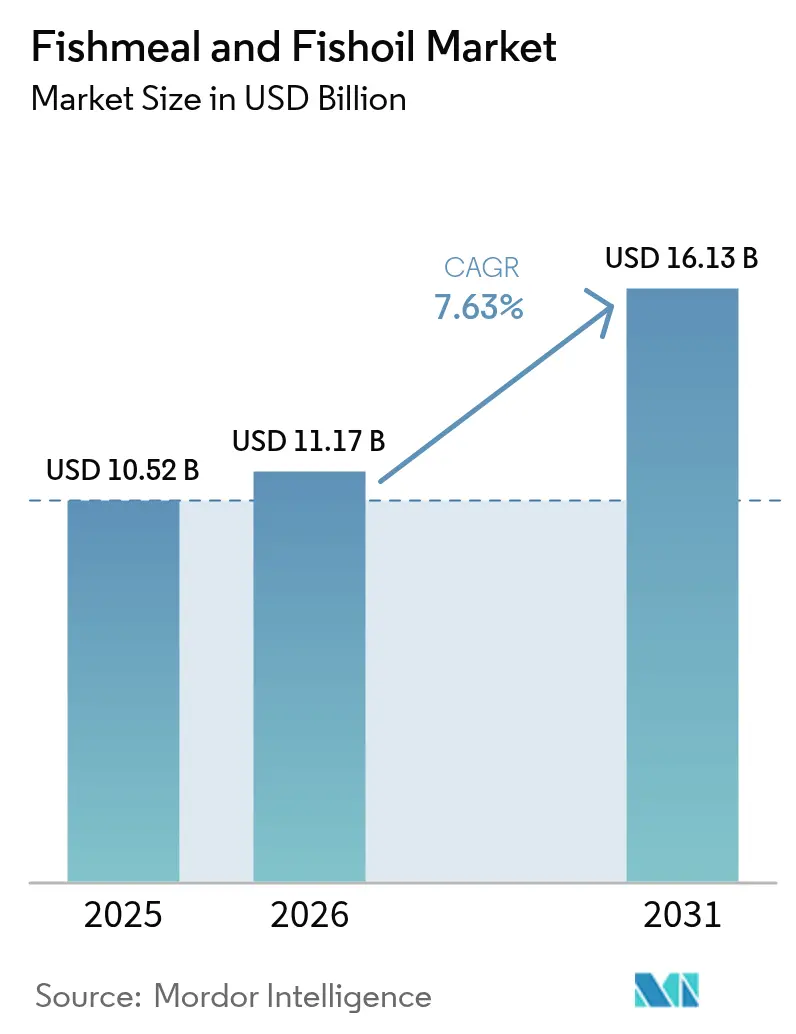
The fishmeal and fishoil market size is projected to expand from USD 10.52 billion in 2025 and USD 11.17 billion in 2026 to USD 16.13 billion by 2031, registering a CAGR of 7.63% between 2026 to 2031. Asia-Pacific maintained leadership, powered by China’s intensifying shrimp and tilapia farming and Vietnam’s marine-cage expansion, both of which align with its 2030 Blue Economy plan. Tight supply from El Niño-related quota cuts in Peru, coupled with freight bottlenecks at the Panama and Suez canals, and inflated spot premiums, reinforced the strategic shift toward certified, traceable lots that secure price advantages in Europe and North America. Feed formulators are using artificial intelligence platforms to fine-tune inclusion rates to 0.1% increments, containing costs while protecting growth performance. Government incentives for waste-to-protein rendering in Norway, Canada, and Iceland are redirecting salmon by-products into meal and oil, easing pressure on wild stocks and stabilizing long-term supply.
Key Report Takeaways
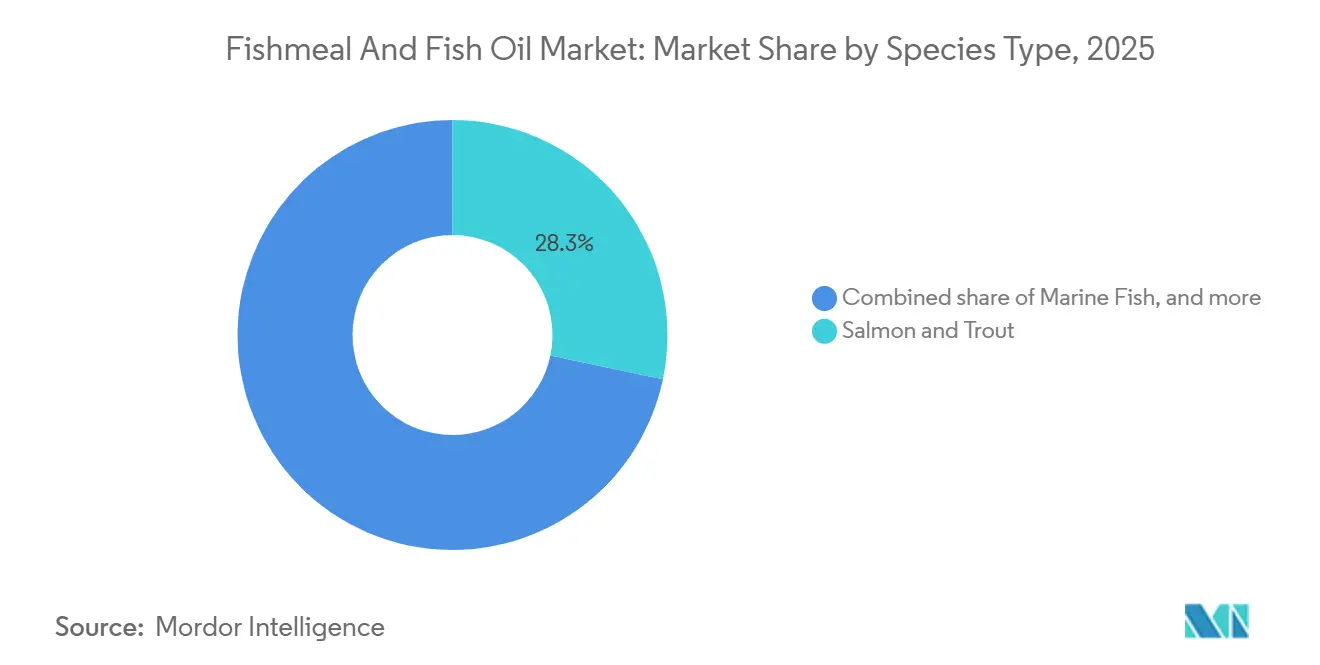
- By species, salmon and trout led with 28.3% of the fishmeal and fishoil market share in 2025, while crustacean formulations are projected to record an 8.5% CAGR through 2031.
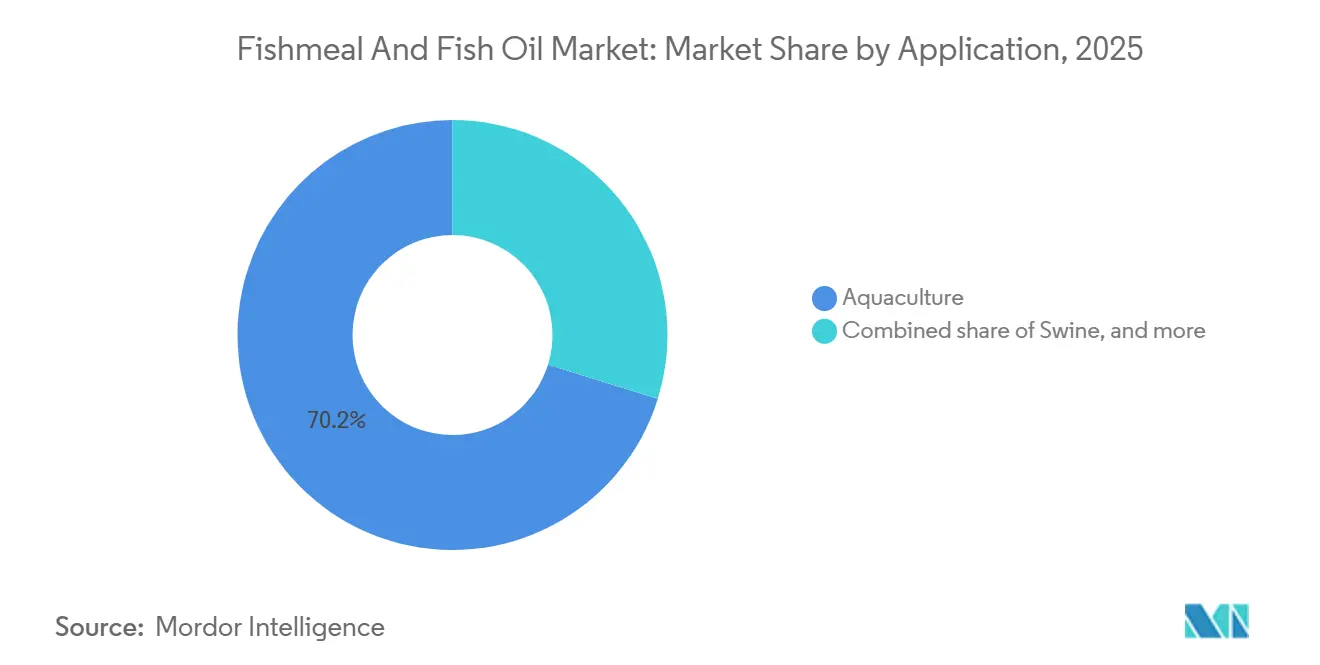
- By application, aquaculture accounted for 70.2% of the fishmeal and fishoil market size in 2025, whereas pet food is advancing at a 7.4% CAGR to 2031.
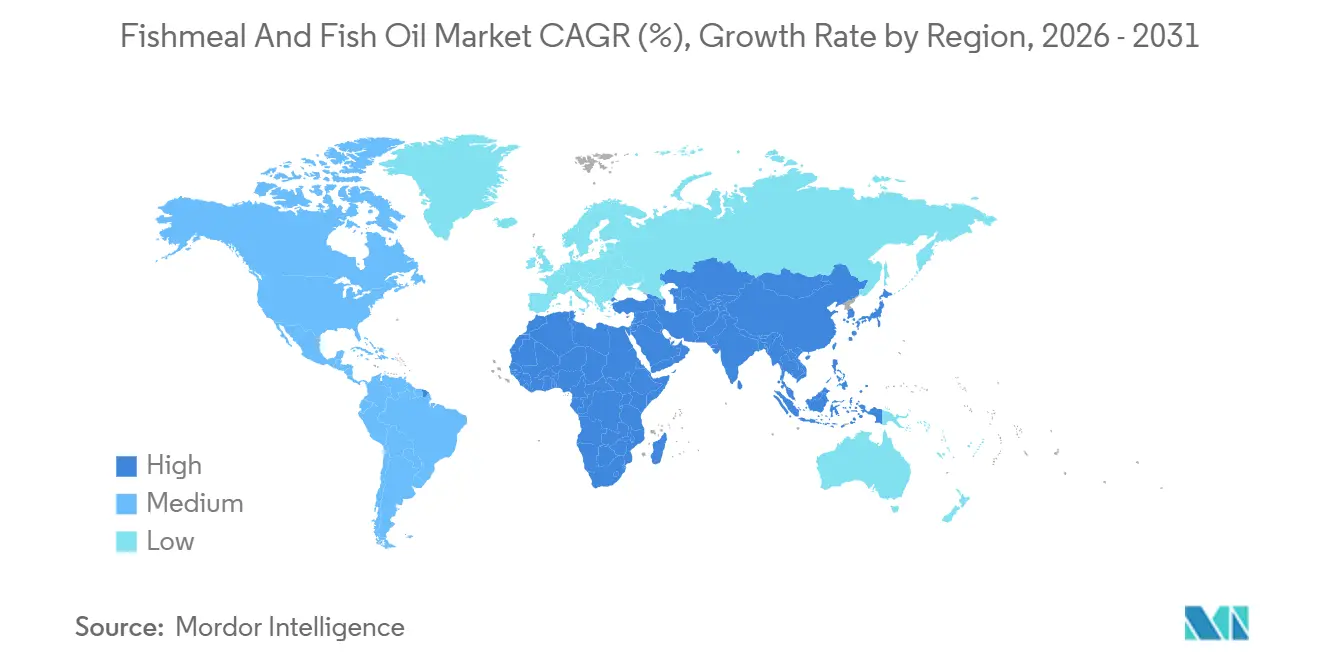
- By geography, Asia-Pacific accounted for 45.2% of revenue in 2025, and the Middle East is forecast to expand at a 7.9% CAGR between 2026 and 2031.
- Pelagia AS (Austevoll Seafood ASA / Kverva AS), Tecnológica de Alimentos S.A. (Grupo Brescia), Omega Protein Corporation (Cooke Inc.), TripleNine Group A/S, and FF Skagen A/S collectively held a significant share of the fishmeal and fishoil market in 2025.
Note: Market size and forecast figures in this report are generated using Mordor Intelligence’s proprietary estimation framework, updated with the latest available data and insights as of 2026.
Global Fishmeal And Fishoil Market Trends and Insights
Drivers Impact Analysis*
| Driver | (~) % Impact on CAGR Forecast | Geographic Relevance | Impact Timeline |
|---|---|---|---|
| Expanding aquaculture output in Asia-Pacific | +1.2% | Asia-Pacific core, spillover to Middle East and South America | Medium term (2-4 years) |
| Premiumization of salmonid and shrimp feeds | +1.0% | Norway, Chile, Scotland, Ecuador, and Vietnam | Long term (≥ 4 years) |
| Government incentives for waste-to-protein rendering | +0.8% | North America and Europe, and emerging in South America | Long term (≥ 4 years) |
| Carbon-offset premiums for certified sustainable lots | +0.8% | North America and European Union, and early adoption in Oceania | Medium term (2-4 years) |
| Rapid uptake of high-protein concentrates from by-products | +0.6% | Global, led by Europe and North America | Short term (≤ 2 years) |
| Artificial Intelligence driven precision formulation optimizing fishmeal inclusion | +0.5% | Global, concentrated in technologically advanced feed mills | Medium term (2-4 years) |
| Source: Mordor Intelligence | |||
Expanding Aquaculture Output in Asia-Pacific
China retained its position as the world's largest seafood producer in 2024, with production estimated at 74.1 million metric tons, up 4% from 2023. This growth was primarily driven by aquaculture, which rose by 4.5% year-on-year to reach 58.1 million metric tons[1]Source: USDA Foreign Agricultural Department, "China: 2025 China Fishery Products Report," fas.usda.gov. According to Vietnam Customs, the country’s total shrimp export turnover in 2025 amounted to USD 4.6 billion, representing a 19% increase compared to 2024 and marking the highest level ever recorded, and is accelerating the procurement of protein-dense diets for tilapia and seaweed juveniles[2]Source: Vietnam Association of Seafood Exporters and Producers, "Vietnam’s shrimp exports hit a record USD 4.6 billion in 2025," vasep.com.vn. Juvenile fish and shrimp show limited tolerance for plant proteins, so marine amino acid profiles remain indispensable for optimal growth. India’s coast is piloting recirculating systems for pompano and cobia that require fishmeal inclusion, exacerbating regional tightness. Rising per-capita seafood intake across Southeast Asia, projected to increase by 2028, reinforces structural growth for the fishmeal and fish oil market.
Premiumization of Salmonid and Shrimp Feeds
Norwegian producers are reformulating diets to include combined EPA (eicosapentaenoic acid) and DHA (docosahexaenoic acid), increasing the share of fishmeal in finishing rations. Ecuadorian exporters targeting United States retail price premiums are utilizing astaxanthin-rich oils derived from anchoveta and krill, driving specialty demand. This trend highlights the growing importance of high-value additives in aquaculture feed formulations. Chilean salmon farmers are shortening grow-out cycles by increasing marine protein density, achieving feed conversion ratios below 1.1. Scotland enforces low-phosphorus discharge limits, spurring uptake of enzymatically hydrolyzed meal that maintains performance while reducing effluent. These dynamics split the fishmeal and fish oil market into commodity grades for carp and tilapia versus high-specification concentrates that capture superior margins.
Carbon-Offset Premiums for Certified Sustainable Lots
MarinTrust-certified shipments commanded a premium in European spot markets as multinational feed companies incorporated traceability requirements into their contracts. Marine Stewardship Council-certified Peruvian anchoveta meal is being used for standard grades, driven by retailer demands on salmon producers to supply documented low-carbon inputs. Global fishmeal production primarily originates from assessed fisheries, as procurement frameworks at Cargill, Incorporated, and Nutreco N.V. emphasize sustainable sourcing practices. Blockchain platforms piloted in Chile let buyers verify vessel-level data and unlock green financing that lowers working-capital costs. Credentials, therefore, operate as non-tariff barriers, redefining competitive positioning in the fishmeal and fish oil market.
Rapid Uptake of High-Protein Concentrates from By-Products
European plants using enzymatic hydrolysis now achieve higher protein levels than conventional meal, allowing formulators to reduce inclusion rates without compromising amino acid density. TripleNine Group expands production by 18 thousand metric tons in 2025 to meet the requirements of Scottish and Norwegian recirculating aquaculture systems. Salmon by-product hydrolysates, when included in shrimp starter feeds, reduced early mortality. The emphasis on functional nutrition has elevated concentrates to a premium category, ensuring price stability despite the substitution of volumes by insect or single-cell proteins. In 2024, clear federal guidance in the United States eliminated regulatory uncertainty, accelerating the pace of commercialization.
Restraints Impact Analysis*
| Restraint | (~)% Impact on CAGR Forecast | Geographic Relevance | Impact Timeline |
|---|---|---|---|
| El Niño-driven volatility of Peruvian anchoveta landings | -1.2% | Global, acute in Asia-Pacific and South America | Short term (≤ 2 years) |
| Surge of insect and single-cell proteins in aquafeed recipes | -0.9% | Global, led by Europe and North America | Medium term (2-4 years) |
| Geopolitical freight bottlenecks in Panama and Suez Canals | -0.7% | Asia-Pacific and Europe trade routes | Short term (≤ 2 years) |
| Rising insurance costs for refriger-cargo due to bio-risks | -0.5% | North-South trade lanes worldwide | Medium term (2-4 years) |
| Source: Mordor Intelligence | |||
El Niño-Driven Volatility of Peruvian Anchoveta Landings
El Niño-Southern Oscillation (ENSO) events are the main factor contributing to fluctuations in Peruvian anchoveta (Engraulis ringens) landings, leading to significant and often abrupt changes in population biomass and fishing yields. In 2023, industrial anchoveta landings in Peru totaled 1.9 million metric tons, the lowest level recorded since 1999. The decline in landings and the poor condition of anchoveta that year led to the export value of fish meal and oil from Peru falling to USD 1.1 billion, the lowest in two decades, negatively impacting juvenile recruitment[3]Source: Food and Agriculture Organization of the United Nations, "El Niño impacts and policies for the fisheries sector," fao.org. Chinese buyers diverted to Morocco at premiums, squeezing feed-mill profitability. The Humboldt Current supplies roughly one-third of global fishmeal tonnage, so each quota shock reverberates through global pricing. National Oceanic and Atmospheric Administration models foresee more frequent moderate or strong El Niño events through 2035, locking volatility into the outlook. Strategic reserves and alternative-protein pipelines are becoming necessary hedges in the fishmeal and fish oil market.
Surge of Insect and Single-Cell Proteins in Aquafeed Recipes
The European Union's regulatory developments in 2024, including clarifications on the use of live insects and the ongoing authorization of insect species, have driven substantial growth in large-scale Black Soldier Fly (BSF) projects. Ynsect raised EUR 160 million (USD 175 million) in 2023 for a 200 thousand-metric-ton plant targeting Mediterranean aquafeed customers. Single-cell proteins fermented from methane received clearance for inclusion in salmon diets in Norway and Canada. Norwegian Institute of Marine Research trials showed growth parity in Atlantic salmon, but fillet omega-3 dilution of 12% to 15% in 2023, limiting penetration into premium categories. Cost savings in tilapia and carp remain compelling, eroding fishmeal share in low-margin species.
*Our forecasts treat driver/restraint impacts as directional, not additive. The impact forecasts reflect baseline growth, mix effects, and variable interactions.
Segment Analysis
By Species Type: Salmon and Trout Hold the Largest Share
Salmon and trout were the largest species segment and accounted for 28.3% of the fishmeal and fishoil market share in 2025, reflecting their dependence on high-specification marine ingredients that secure premium fillet color and omega-3 density demanded by retailers in Europe and North America. Continued product differentiation raises functional protein requirements despite formulation advances. Norwegian, Chilean, and Scottish farms collectively consumed more than 1.3 million metric tons of fishmeal in 2025, sustaining price leadership for low-ash, enzyme-hydrolyzed grades. Feed conversion ratios below 1.1 underscore the economic case for maintaining marine inputs even as insect proteins advance through trial phases. Regulators tightening discharge limits spur uptake of concentrates that reduce waste while preserving growth metrics, a niche where vertically integrated renderers enjoy higher margins.
Crustaceans are projected to be the fastest-growing segment, expanding at an 8.5% CAGR between 2026 and 2031. Rising shrimp consumption in Asia and retail premiumization in the United States are driving inclusion rates, thereby elevating the size of the fishmeal and fish oil market for crustacean diets. Ecuadorian shrimp exporters use astaxanthin-rich fish oil to differentiate color, thereby sustaining price premiums over Indian-origin shrimp. Southeast Asian growers adopting super-intensive ponds raise feed frequency, compounding volume gains. Certification pressures parallel those seen in salmonids, embedding traceability as a ticket to market access and reinforcing demand for sustainably sourced marine proteins.



By Application: Aquaculture Leads, Pet Food Climbs Fastest
Aquaculture was the largest application segment, accounting for 70.2% of the fishmeal and fishoil market size in 2025, driven by global farmed seafood surpassing wild-capture volumes. Carnivorous species exhibit limited enzymatic capacity for plant proteins, so fishmeal remains a metabolic necessity. Regulatory clarity on enzymatically treated meals in the United States and European Union stimulates investment in concentrates that lower inclusion without jeopardizing conversion. Asia-Pacific’s production targets and Middle East diversification policies anchor consistent baseline growth, even as insect and single-cell proteins nibble share in carps and tilapia.
Pet food is the fastest-growing application, forecast to grow at a 7.4% CAGR through 2031, driven by pet humanization trends in North America and Europe. Premium formulations highlight marine omega-3 benefits for joint and cognitive health, supporting retail prices above conventional kibble. Suppliers targeting this channel emphasize odor control and oxidative stability, enabling cross-category leverage of investments in high-grade fish oil refineries. Rising e-commerce penetration is accelerating consumer awareness, widening the addressable market for marine-enhanced pet nutrition.
Geography Analysis
Asia-Pacific accounted for 45.2% of the fishmeal and fishoil market in 2025, bolstered by China’s significant output and Vietnam’s export-oriented shrimp expansion. Recirculating systems proliferate in Japan and India, raising per-kilogram fishmeal intensity as farmers prioritize water quality. Subsidies provided by the South Korean government and feed import initiatives in Taiwan continue to support growth. Certified supplies from Peru and Norway are increasingly preferred as retailers prioritize traceability, boosting demand for premium grades in Asia-Pacific.
The Middle East is projected to post a 7.9% CAGR through 2031, anchored by Saudi Arabia’s Vision 2030 plan, which allocates funds to marine cage projects along the Red Sea. The United Arab Emirates subsidizes fishmeal imports, lowering landed costs and igniting farm expansion in Abu Dhabi and Fujairah. Turkey’s sea bass and sea bream producers upgrade diets to meet European Union market standards, while Egypt pushes desert-based recirculating systems to tap premium Gulf markets. Regional protein security priorities buffer demand against global price swings, creating a relatively inelastic customer base for certified suppliers.
South America continues to be a key supplier, with Peru exporting despite quota restrictions, while Chile focuses on domestic consumption for salmon grow-out. Norway has used salmon by-products through recycling, redirecting materials that would otherwise have been sent to landfills. The European Union’s Farm to Fork strategy demands full traceability by 2027, channeling trade toward certified Peruvian, Icelandic, and Danish suppliers. In North America, consumption is primarily concentrated in salmon farms located in British Columbia and Maine. This region benefits from the United States Food and Drug Administration's streamlined approval process for enzymatic concentrates. Emerging African aquaculture in Nigeria, Egypt, and South Africa increases imports, but infrastructure and financing gaps still limit scale.

Regulatory Landscape
Regulation is anchored in feed safety, animal by-product processing standards, and traceability requirements that shape cross-border trade in fishmeal and fish oil. In the European Union, processing and marketing conditions are framed by animal by-product rules, including definitions and processing standards for fishmeal and fish oil under Regulation (EU) 2017/786 amending Regulation (EU) No 142/2011, along with contaminant management. This includes detoxification pathways for fish oils and fishmeal that exceed dioxin/PCB limits under Regulation (EU) 2020/757. In parallel, EU feed additive authorisations and reauthorisations continue to be issued based on EFSA opinions, including a new set of Implementing Regulations in January-February 2026, tightening the compliance envelope for functional additives and processing aids used to stabilize oils and produce enzymatically treated meals.
In the United States, oversight spans feed ingredient and medicated-feed rules that shape formulations using marine ingredients and alternative proteins. The FDA published a draft revised guidance in April 2026 (GFI #91, VICH GL8 (R1)) on stability testing for medicated premixes intended for incorporation into animal feed. A February 2026 Federal Register update reflected animal drug approval actions from July to September 2025, reinforcing the cadence of regulatory updates premix and feed manufacturers must track. For exports to the EU, certification and documentation requirements managed through USDA APHIS processes, with coordination across agencies, remain a practical gate for market access, making quality systems, batch traceability, and compliant processing documentation central to supplier selection.
Competitive Landscape
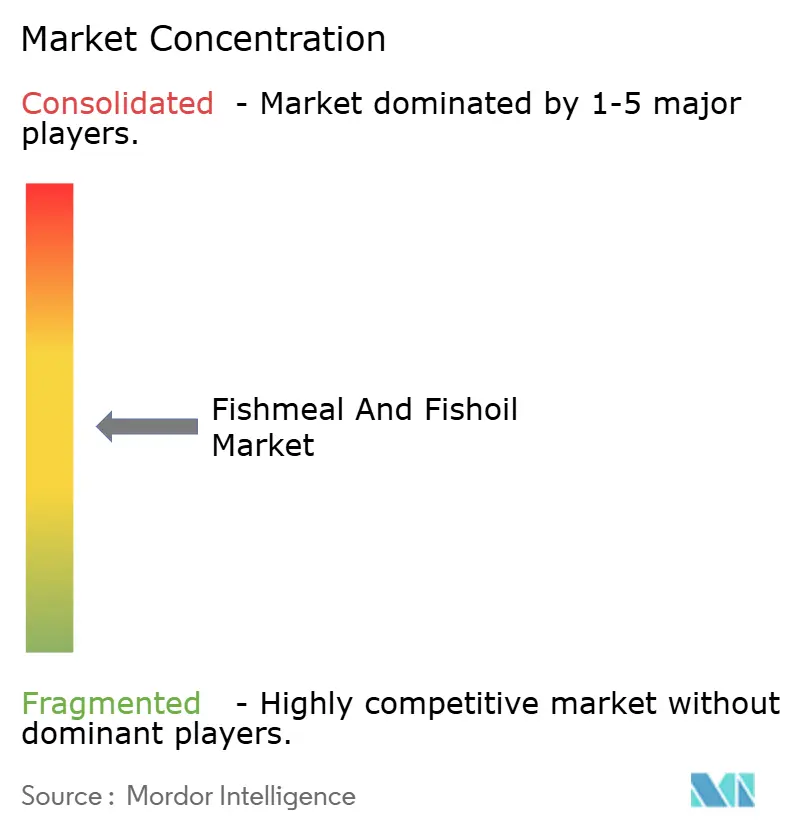
The fishmeal and fishoil market is moderately concentrated, with major companies such as Pelagia AS (Austevoll Seafood ASA / Kverva AS), Tecnológica de Alimentos S.A. (Grupo Brescia), Omega Protein Corporation (Cooke Inc.), TripleNine Group A/S, and FF Skagen A/S, collectively holding a significant share of the market in 2025. Tecnológica de Alimentos invested USD 45 million since 2024 in hydrolysis lines, raising protein to 76%, targeting premium salmonid formulators. Omega Protein Corporation relies on North American menhaden fisheries and a 10-year supply contract with BioMar, indexed to sustainability metrics. TripleNine Group A/S and FF Skagen A/S differentiate through enzymatic concentrate production and molecular distillation, yielding high-purity oils for the pharmaceutical and pet food channels.
Niche renderers in Peru, Chile, and Norway capture value by offering MarinTrust and Marine Stewardship Council-certified carbon-neutral lots that unlock price premiums with European feed mills. Blockchain platforms piloted by Chilean exporters provide vessel-level data, functioning as a barrier to entry for commodity traders lacking digital infrastructure. Patent filings tracked by the International Fishmeal and Fish Oil Organisation show 47 applications in 2025 related to enzyme processing and oxidative stabilization, signaling an innovation race focused on functional performance. Freight volatility and quota uncertainty encourage consolidation, as smaller Peruvian operators become acquisition targets for European and North American firms seeking secure raw-material access and logistics synergies.
Vertical integration covering rendering, formulation, and distribution yields cost advantages when El Niño or freight shocks tighten supply. Companies deploying artificial-intelligence formulation technologies report lower fishmeal consumption without sacrificing growth, saving more annually in large operations. Waste-to-protein incentives accelerate the entry of circular-economy players that transform salmon by-products into high-grade concentrates, while insect and single-cell protein producers challenge commodity segments but remain constrained in replicating long-chain omega-3 and pigmentation attributes necessary for premium salmon and shrimp feeds.
Fishmeal And Fishoil Industry Leaders
-
Pelagia AS (Austevoll Seafood ASA / Kverva AS)
-
Tecnológica de Alimentos S.A. (Grupo Brescia)
-
Omega Protein Corporation (Cooke Inc.)
-
TripleNine Group A/S
-
FF Skagen A/S
- *Disclaimer: Major Players sorted in no particular order

Market Opportunities and Future Outlook
Tighter marine-ingredient availability and higher price volatility are creating whitespace for two parallel strategies: (i) premium, certified, traceable fishmeal and fish oil lots that meet retailer and feed-mill sourcing rules, and (ii) greater diversification of supply through by-products and new processing capacity. Industry data points cited by IFFO in 2026 indicate supply-side pressure, including a reported 28% year-on-year decline in global fishmeal production in Q1 2026, with March 2026 down 38%, alongside commentary that annual output could fall below 5 million metric tons under persistent El Nino conditions. In this environment, procurement shifts toward MarinTrust and MSC-aligned, vessel-level traceable lots used by multinational buyers, and the economics support investments in hydrolysis, oxidative stabilization, and molecular distillation that convert constrained raw material into higher-spec concentrates for salmonid, shrimp, pet food, and nutraceutical channels.
A second opportunity track is the accelerating build-out of circular and alternative ingredient systems that reduce exposure to anchoveta shocks while maintaining performance in target species. By-products already represent a meaningful share of supply (35% of fishmeal and 57% of fish oil globally, and 44% and 74% in Asia), and government incentives for waste-to-protein rendering, noted in Norway, Canada, and Iceland in the report context, align with this shift by pulling salmon by-products into meal and oil streams. Commercial and scientific validation of substitutes is also expanding formulation toolkits: in January 2026, NaturAlleva and Innovafeed announced a commercial partnership to integrate BSFL ingredients into aquafeed for multiple species, and peer-reviewed trials in 2026 reported successful partial replacement of fishmeal using insect meal and single-cell protein at defined inclusion levels in finfish diets. Combined with AI-driven precision formulation already used by feed mills to adjust inclusion rates in small increments, these developments create room for differentiated marine-ingredient offerings that pair concentrated functional performance with documented sustainability and more stable quality.
Recent Industry Developments
- April 2026: The US Food and Drug Administration (FDA) published draft revised guidance (GFI #91, VICH GL8 (R1)) on stability testing for medicated premixes intended for incorporation into animal feed. The update tightens documentation and testing expectations for premix stability programs used by large feed producers, influencing how marine ingredients and other high-value inputs are managed across storage and processing conditions.
- June 2025: Pelagia AS acquired Fjord Solutions, expanding into sludge collection, dewatering, and processing services linked to aquaculture operations. The deal strengthens access to circular raw-material streams and places the company closer to farm-level by-product and waste-to-protein flows that are increasingly important for marine-ingredient supply resilience.
- November 2024: Cooke Inc. entered into a binding share purchase agreement to acquire Corporacion Pesquera Inca S.A.C. (Copeinca) in Peru, a major fishmeal and fish oil producer and exporter. The transaction broadens Cooke's footprint into a key anchoveta-linked supply hub and increases vertical integration options for serving aquafeed customers during quota-driven supply swings.


Research Methodology Framework and Report Scope
Market Definition and Coverage
This market covers the sales value of fishmeal and fish oil produced from whole fish and fish processing by-products, when they are sold as ingredients for feed and nutrition uses across major consuming industries.
Scope exclusions: We exclude finished compound feeds, finished supplements, and on-farm or in-house rendered material that is not commercially sold into the market.
Segmentation Overview
-
By Species Type
- Salmon and Trout
- Crustaceans
- Marine Fish
- Carps
- Tilapias
- Others
-
By Application
- Aquaculture
- Poultry
- Swine
- Pets
- Others
-
By Geography
-
North America
- United States
- Canada
- Mexico
- Rest of North America
-
Europe
- Germany
- United Kingdom
- France
- Russia
- Norway
- Spain
- Rest of Europe
-
Asia-Pacific
- China
- Japan
- India
- South Korea
- Vietnam
- Indonesia
- Rest of Asia-Pacific
-
South America
- Peru
- Brazil
- Chile
- Argentina
- Rest of South America
-
Middle East
- Saudi Arabia
- United Arab Emirates
- Turkey
- Rest of Middle East
-
Africa
- South Africa
- Egypt
- Nigeria
- Rest of Africa
-
North America
Data Sources, Market Sizing, and Validation
Desk Research
Desk work starts by mapping supply and demand signals that can be checked year over year. We rely on public production and trade references such as FAO fisheries statistics, UN Comtrade import and export series, national fisheries agencies, and customs and port authority disclosures where available. For demand context, we also review sources such as IFFO and other marine ingredient association updates, along with peer-reviewed nutrition and aquaculture papers that explain inclusion rates and substitution behavior.
To keep assumptions grounded, we cross-check major producers and buyers through annual reports, investor presentations, sustainability reports, and reputable press coverage on quotas, landings, and processing capacity. Paid subscriptions are used selectively for company financials and intelligence, shipment-level import and export checks, and patent databases to spot process shifts that may affect yields. These examples are not exhaustive, and other public sources were also reviewed for data collection, validation, and clarification.
Primary Interviews and Surveys
Primary work focuses on interviewing industry participants across the value chain, including raw material suppliers, processors, traders, feed formulators, and large end users. We use these discussions to validate conversion yields, typical product specifications, contract versus spot pricing patterns, and how demand changes when alternative proteins and oils move in price. The inputs are then reconciled across APAC, EMEA, and the Americas.
Distribution of primary research fieldwork respondents
| Company type | Respondent position | Region |
|---|---|---|
| Top tier: 25% | CXOs: 14% | APAC: 45% |
| Mid tier: 56% | Functional/Unit leaders: 38% | EMEA: 31% |
| Smaller Players: 19% | Managers: 48% | Americas: 24% |
Market-Sizing & Forecasting
Sizing is built mainly from a top-down reconstruction that links fish landings and by-product availability to fishmeal and fish oil output, then checks how much of that output is absorbed by the main consuming uses. Where needed, we translate supply into value using observed price ranges and typical spreads between fishmeal grades and fish oil specifications, and we keep currency conversion timing consistent across the model.
Results are corroborated with selective bottom-up approximations, such as rolling up sampled supplier revenues, validating traded volumes through import and export patterns, and using indicative ASP times volume checks for high-visibility corridors. Key inputs include reduction fisheries quotas and landings, by-product recovery rates, yield factors from raw fish to meal and oil, aquaculture feed production trends, and substitution pressure from other proteins and oils. For forecasting, scenario analysis is applied because supply is quota and weather sensitive, and the demand path is stress-tested using expected aquaculture output growth and inclusion-rate guidance from primary experts. When data gaps appear in smaller countries, we use proxy trade flows and regional yield benchmarks, followed by expert rechecks before finalizing the estimate.
Data Validation & Update Cycle
Validation is handled through multiple checks that compare the modeled totals against independent signals like trade balances, announced capacity changes, and price movements that should logically align with tighter or looser supply. Any large variance is reviewed, and if a mismatch cannot be explained by seasonality, quota changes, or inventory behavior, we re-contact sources and rerun the affected assumptions. Before sign-off, the work is reviewed in steps so calculations, units, and conversions remain consistent across regions.
Reports are refreshed annually, and interim updates are triggered when material events occur such as sharp quota revisions, major plant shutdowns, or abnormal price spikes. Right before delivery, a final pass is completed to incorporate the latest public releases and the most recent validation inputs.
Mordor Intelligence's Fishmeal and Fishoil Market Size Compared With Other Published Estimates
Published market numbers for fishmeal and fish oil can look different even when the topic sounds the same, because each publisher sets its own rules for what gets counted and how value is converted. In practice, the biggest differences come from whether by-product derived volumes are treated the same as whole-fish reduction, which end uses are treated as ingredient demand, and how pricing is averaged across grades and contract cycles.
Key gaps usually show up in scope and in the model inputs that drive pricing and volume. Some estimates fold in adjacent marine ingredients or finished product value, while others smooth pricing using long averages that can mute the impact of quota shocks. The spread in the table is also influenced by how quickly assumptions are refreshed after landing data, trade shifts, and feed demand signals change, and by whether conversion yields are validated with processors and formulators, which is handled differently across publishers and applied in the approach used by Mordor Intelligence.
Benchmark comparison
| Source | Market Size | Gaps in Research Methodology |
|---|---|---|
| Mordor Intelligence | USD 10.52 B (2025) | |
| Industry Publisher A | USD 10.20 B (2025) | Uses a narrower value build that appears to lean more on headline demand by region and a longer forecast window, with less visible cross-checking of yield assumptions and grade-level price dispersion in the base year. |
| Global Consultancy B | USD 13.48 B (2025) | Likely includes a broader definition of what counts as market value, potentially mixing in adjacent marine ingredient value pools or applying higher blended pricing assumptions across fish oil specifications and fishmeal grades. |
Overall, the comparison shows that the value outcome moves most when scope boundaries and price averaging choices change, especially around by-product inclusion and grade differentiation. By keeping the demand pool tied to ingredient sales and by validating yield and pricing assumptions with supply chain interviews, the final number stays traceable to a short list of repeatable checks.


Key Questions Answered in the Report
How large is the fishmeal and fish oil market in 2026?
It is estimated at USD 11.17 billion in 2026, on track to reach USD 16.13 billion by 2031.
Which species segment dominates demand for marine proteins?
Salmon and trout feeds hold the largest share, accounting for 28.3% of 2025 revenue because they require high-specification meal and oil for omega-3 density.
Why is pet nutrition emerging as a key growth channel?
Premium dog and cat products use marine omega-3s for joint and cognitive health claims, pushing the segment to a 7.4% CAGR through 2031.
What is the biggest geographic market for fishmeal and fish oil?
Asia-Pacific leads with 45.2% of global value, driven by robust aquaculture expansion in China, Vietnam, and Indonesia.
How are sustainability certifications influencing prices?
MarinTrust and Marine Stewardship Council-certified lots fetch 8 to 12% premiums in Europe and North America because feed buyers link traceability with brand commitments.
What risks threaten supply stability?
El Niño-induced quota cuts in Peru, freight bottlenecks at major canals, and rising insurance costs collectively tighten availability and elevate delivered prices.
Page last updated on:


 Your data is secure and never sold or shared.


