Fish Market Size and Share
Fish Market Analysis by Mordor Intelligence
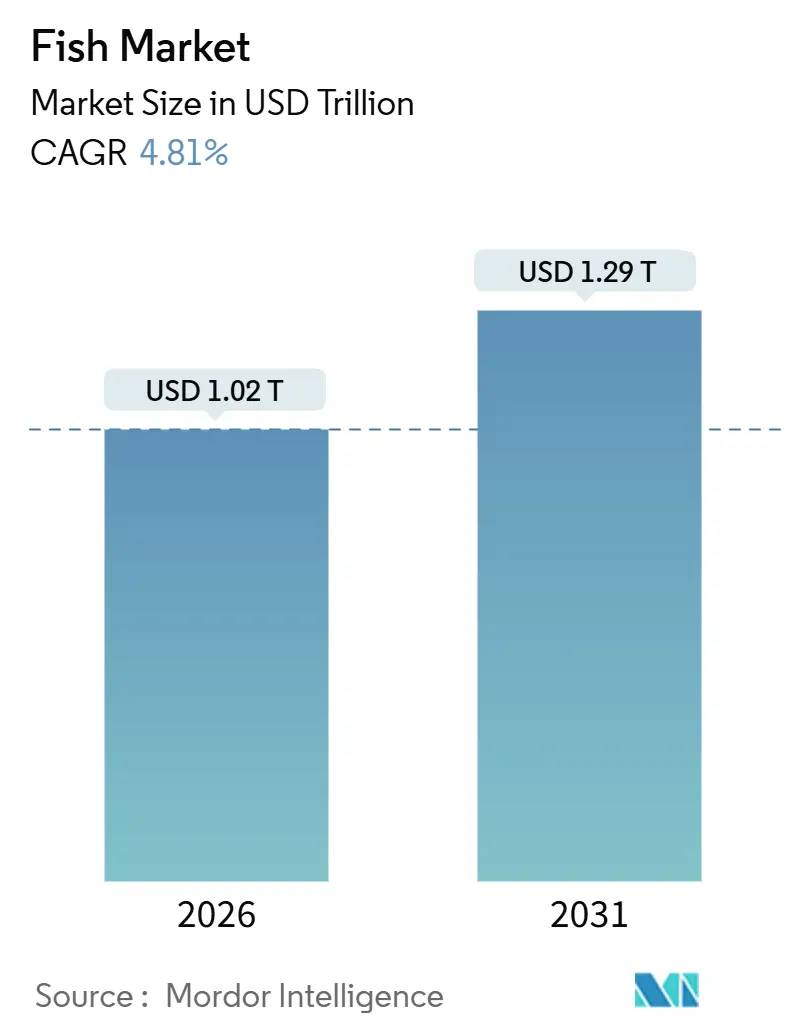
The fish market size is estimated at USD 1.02 trillion in 2026 and is projected to reach USD 1.29 trillion by 2031, advancing at a 4.81% CAGR over the forecast period. Demand is rising as health-conscious urban consumers shift from red meat to seafood, while producers increasingly adopt precision aquaculture to boost yields and reduce their environmental footprint. Artificial-intelligence (AI) monitoring, genomic broodstock selection, and closed recirculating systems are compressing production cycles and lowering feed conversion ratios, thereby expanding the fish market’s addressable supply base. Cold-chain investments in emerging economies are reducing post-harvest losses and opening inland demand corridors, whereas blockchain traceability is becoming a prerequisite for premium buyers in Japan and the European Union. On the downside, biomass volatility linked to harmful algal blooms and tighter scrutiny of antibiotic residues pose episodic shocks that could widen the performance gap between technology leaders and laggards.
Key Report Takeaways
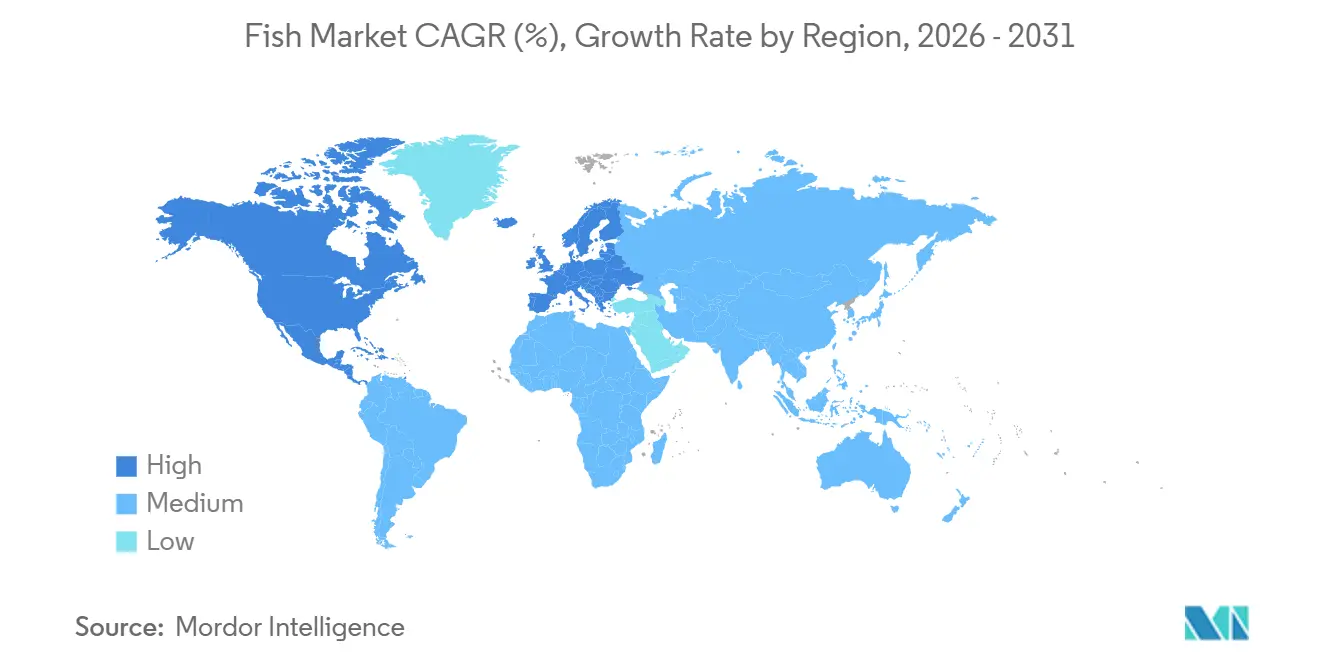
- By geography, Asia-Pacific led with a 53.20% fish market share in 2025. Africa is forecast to expand at a 6.70% CAGR through 2031.
Note: Market size and forecast figures in this report are generated using Mordor Intelligence’s proprietary estimation framework, updated with the latest available data and insights as of January 2026.
Global Fish Market Trends and Insights
Drivers Impact Analysis*
| Driver | (~) % Impact on CAGR Forecast | Geographic Relevance | Impact Timeline |
|---|---|---|---|
| Health-centric protein demand surge | +1.2% | Global, concentrated in Asia-Pacific and Africa | Medium term (2-4 years) |
| Aquaculture yield gains from AI-enabled precision farming | +0.9% | Asia-Pacific core, spillover to Europe and South America | Long term (≥ 4 years) |
| Government blue-food nutrition initiatives | +0.7% | Africa, South Asia, and Southeast Asia | Short term (≤ 2 years) |
| Expansion of cold-chain capacity in emerging economies | +0.6% | Africa, Middle East, and South America | Medium term (2-4 years) |
| Vertical-ocean farming prototypes proving scale economics | +0.5% | Europe (Norway, Scotland) and North America | Long term (≥ 4 years) |
| Under-utilized mesopelagic species commercialization | +0.3% | Global pilots in Europe and Asia-Pacific | Long term (≥ 4 years) |
| Source: Mordor Intelligence | |||


Health-Centric Protein Demand Surge
Rising household incomes and increasing awareness of omega-3 fatty acids are driving up seafood consumption in Vietnam, Nigeria, and Indonesia. Per-capita intake in Vietnam reached 42 kilograms in 2025, surpassing the combined consumption of beef and pork, while frozen tilapia sales in Lagos increased year-over-year.[1]Source: Food and Agriculture Organization, “Fishery and Aquaculture Statistics,” fao.org The American Heart Association’s two-servings-per-week guideline has been widely incorporated into school meal plans and quick-service menus, reinforcing preference for fish over red meat. Because the fish market delivers a lower greenhouse-gas footprint than ruminant livestock, sustainability-minded consumers in Scandinavia and the United Kingdom are gravitating toward certified seafood lines. Meeting this surge demands responsible stock management to prevent overfishing and habitat loss, keeping long-run fish market growth on a balanced path.
Aquaculture Yield Gains from AI-Enabled Precision Farming
Machine-vision cameras and dissolved-oxygen sensors now monitor thousands of cages, enabling automated feeding and early detection of disease. SalMar’s salmon farms in Norway cut chemical treatments in half after deploying AI-guided freshwater baths that suppress sea lice outbreaks [2]Source: SalMar ASA, “Quarterly Presentation Q4 2025,” salmar.no. In China, predictive analytics enabled a leading tilapia hatchery to achieve a 1.1 feed conversion ratio, a 9% improvement over legacy practices. Faster growth cycles improve inventory turns and working-capital efficiency, underpinning wider fish market adoption. Smallholder operators in Southeast Asia and Africa remain capital-constrained, which risks entrenching a productivity divide that could exacerbate regional cost disparities.
Government Blue-Food Nutrition Initiatives
Public-sector programs are embedding fish into nutrition strategies to combat protein deficiency. India’s Pradhan Mantri Matsya Sampada Yojana has earmarked INR 200 billion (USD 2.4 billion) through 2025 for landing-center upgrades and inland cold storage, ensuring a baseline demand for domestic producers [3]Source: Ministry of Fisheries, Animal Husbandry and Dairying, India, “PMMSY Dashboard,” dof.gov.in. Egypt aims to produce 2.5 million metric tons of farmed fish by 2030, supplying school lunches for approximately 12 million children annually. The endorsement of the Blue Transformation roadmap by 87 Food and Agriculture Organization member states elevates fish to a status of staple food. By lowering market risk, these initiatives catalyze private investment and accelerate fish market penetration across low-income regions.
Expansion of Cold-Chain Capacity in Emerging Economies
Grid-tied and solar-powered refrigeration is lengthening shelf life and connecting inland retail nodes. Kenya installed 14 solar cold rooms around Lake Victoria in 2025, extending the freshness of Nile perch from 3 days to 14 days. Peru lifted insulated-truck capacity by 22% the same year, trimming spoilage to 11% and enhancing export yields. A USD 350 million World Bank facility is co-financing similar projects across sub-Saharan Africa, unlocking new addressable demand for the fish market. Reliable cold chains also enable compliance with stricter food safety regulations in premium import markets.
Restraints Impact Analysis*
| Restraint | (~) % Impact on CAGR Forecast | Geographic Relevance | Impact Timeline |
|---|---|---|---|
| Intensifying climate-linked biomass volatility | -0.8% | Global, acute in South America and Asia-Pacific coastal zones | Short term (≤ 2 years) |
| Antimicrobial-resistance scrutiny on aquaculture therapeutics | -0.5% | Asia-Pacific, spillover to South America | Medium term (2-4 years) |
| Trade-policy shocks and seafood tariffs | -0.4% | Global, concentrated in North America and Europe import corridors | Short term (≤ 2 years) |
| Micro- and nano-plastic contamination concerns | -0.3% | Global, heightened in Europe and North America | Long term (≥ 4 years) |
| Source: Mordor Intelligence | |||
Intensifying Climate-Linked Biomass Volatility
Warming oceans are shifting migration routes and spawning windows, eroding catch predictability. Chile lost 120,000 metric tons of salmon to harmful algal blooms in 2025, resulting in an 18% price decrease. North Atlantic mackerel moved 200 kilometers northward between 2021 and 2025, straining quota negotiations among Iceland, Norway, and the European Union. The Intergovernmental Panel on Climate Change projects 15-25% declines in tropical reef species by 2040 under current emissions trajectories. Producers must diversify species portfolios and invest in land-based systems to buffer climate exposure, but financing hurdles constrain smaller operators.
Antimicrobial-Resistance Scrutiny on Aquaculture Therapeutics
Intensive aquaculture systems rely on antibiotics to control bacterial infections, yet overuse accelerates resistance gene transmission that poses risks to human medicine. The European Medicines Agency's 2025 surveillance detected quinolone residues in 12% of imported Asian shrimp samples, prompting the European Union to tighten maximum residue limits and mandate third-party audits for non-member exporters. The World Health Organization aims to phase out prophylactic antibiotics by 2030, prompting the fish industry to shift toward vaccines and probiotics. Compliance costs risk squeezing smallholders and accelerating consolidation.
*Our forecasts treat driver/restraint impacts as directional, not additive. The impact forecasts reflect baseline growth, mix effects, and variable interactions.
Geography Analysis
The Asia-Pacific region accounted for 53.2% of the global fish market share in 2025, driven by China's substantial farmed output and Indonesia's extensive tilapia and milkfish production networks. Regional growth is projected to continue through 2031, supported by efficiency improvements that counterbalance slowing demand in Japan and South Korea. China's National Aquaculture Green Development Plan aims to implement zero-discharge recirculating systems in 30% of inland farms by 2028, requiring an investment of USD 12 billion to maintain the market share of local producers. While United States tariffs impacted Vietnam's pangasius exports in 2025, processors swiftly shifted focus to Middle Eastern markets, demonstrating supply chain adaptability.
Africa is the fastest-growing region, with an annual growth rate of 6.7% projected through 2031, driven by Egypt’s Nile tilapia production and Nigeria’s anticipated doubling of catfish output by 2025. Subsidized feed and hatchery duty exemptions are fostering industry expansion, while the African Union’s concessional financing of USD 1.2 billion supports hatchery construction and extension services. Only a small quantity of regional fish is transported through refrigerated channels, which limits quality and export opportunities. Addressing this issue is essential for the overall growth of the fish market.
Europe, South America, North America, and the Middle East collectively account for the remaining share of the fish market size. However, stricter fjord stocking limits are driving investments toward land-based aquaculture systems. Chile experienced a decline in salmon production due to harmful algal blooms, while Peru reduced its anchovy quota because of weak juvenile recruitment, highlighting the vulnerabilities of wild-capture fisheries. In 2025, the United States imported significant quantities of seafood, primarily shrimp, salmon, and tuna, with Ecuador and India serving as key suppliers. Middle Eastern markets, led by Saudi Arabia, the United Arab Emirates, and Turkey, are diversifying supply chains beyond traditional Asian exporters, with African tilapia and South American salmon gaining traction in retail and food-service channels.

Competitive Landscape
The fish market is leaving ample room for regional specialists and technology disruptors. Mowi, Thai Union, and Maruha Nichiro utilize vertical integration, spanning from genetics to retail, to protect their margins. Mowi’s Danish recirculating pilot achieved a 1.05 feed conversion ratio and 98% survival rate in 2025, validating land-based economics as capital costs decline. Thai Union’s blockchain platform now tags 40% of its tuna throughput, aligning with European certification demands, while Maruha Nichiro has rolled out similar systems for its longline fisheries.
Offshore aquaculture and cellular seafood represent emerging competitive frontiers. SalMar’s Ocean Farm 1 recorded 12% lower mortality than coastal pens, and the firm partnered with Bakkafrost to deploy four semi-submersible cages in the Faroe Islands by 2027. The United States Food and Drug Administration’s 2024 guidance provided a regulatory map, though compliance favors well-capitalized entrants. Automation is spreading across processing plants, where AI-driven filleting lines and vision grading systems are cutting labor costs by double digits. Taken together, these moves illustrate a shift in the fish market from volume competition toward differentiation based on traceability, technology, and sustainability.
Smaller players are emphasizing organic certification, direct-to-consumer e-commerce, and species diversification. Scottish sea-trout farmers and Mediterranean seabass producers garner 30-50% price premiums over commodity salmon, showing that niche positioning can deliver outsized returns even in a scale-driven fish industry. Cooperative clusters in Vietnam and India are pooling resources to invest in shared hatcheries and cold storage, giving them better leverage over input costs and export logistics.
Recent Industry Developments
- January 2025: Mowi completed the EUR 625 million (USD 718.81 million) acquisition of an additional 46% stake in Nova Sea, a move that significantly strengthens its position in the aquaculture industry. This acquisition increases Mowi's global harvest capacity to 572,000 metric tons, further enhancing its ability to meet growing demand for seafood products worldwide.
- April 2024: Silver Bay Seafoods has acquired Trident Seafoods’ Ketchikan processing facility. This acquisition increases Silver Bay’s capacity to support salmon fisheries in the Southeast region.
- November 2023: SalMar ASA and Bakkafrost have revealed a joint venture to develop offshore aquaculture sites in the Faroe Islands, with an investment of NOK 2.8 billion (USD 260 million) to deploy four semi-submersible cages by 2027. The initiative aims to produce 40,000 metric tons of salmon annually in exposed ocean conditions, addressing coastal environmental limitations.


Research Methodology Framework and Report Scope
Market Definitions and Key Coverage
Our study defines the global fish market as the aggregate value of wild-caught and farm-raised finfish that enter food and feed supply chains, measured at wholesale parity and expressed in constant 2024 US dollars. This coverage spans production, trade, and on-shore first-sale transactions, thereby aligning tonnage with price-tracked value streams across all continents.
Scope exclusion: crustaceans, mollusks, aquatic plants, and non-food commodities such as fishmeal derived from by-products are out of scope.
Segmentation Overview
- By Geography
- North America
- United States
- Production Analysis (Production Volume)
- Consumption Analysis (Consumption Value and Volume)
- Import Market Analysis (Import Value, Volume, and Key Supplying Markets)
- Export Market Analysis (Export Value, Volume, and Key Destination Markets)
- Wholesale Price Trend Analysis and Forecast
- Regulatory Framework
- List of Key Players
- Logistics and Infrastructure
- Seasonality Analysis
- Canada
- Production Analysis (Production Volume)
- Consumption Analysis (Consumption Value and Volume)
- Import Market Analysis (Import Value, Volume, and Key Supplying Markets)
- Export Market Analysis (Export Value, Volume, and Key Destination Markets)
- Wholesale Price Trend Analysis and Forecast
- Regulatory Framework
- List of Key Players
- Logistics and Infrastructure
- Seasonality Analysis
- Mexico
- Production Analysis (Production Volume)
- Consumption Analysis (Consumption Value and Volume)
- Import Market Analysis (Import Value, Volume, and Key Supplying Markets)
- Export Market Analysis (Export Value, Volume, and Key Destination Markets)
- Wholesale Price Trend Analysis and Forecast
- Regulatory Framework
- List of Key Players
- Logistics and Infrastructure
- Seasonality Analysis
- United States
- Europe
- Norway
- Production Analysis (Production Volume)
- Consumption Analysis (Consumption Value and Volume)
- Import Market Analysis (Import Value, Volume, and Key Supplying Markets)
- Export Market Analysis (Export Value, Volume, and Key Destination Markets)
- Wholesale Price Trend Analysis and Forecast
- Regulatory Framework
- List of Key Players
- Logistics and Infrastructure
- Seasonality Analysis
- United Kingdom
- Production Analysis (Production Volume)
- Consumption Analysis (Consumption Value and Volume)
- Import Market Analysis (Import Value, Volume, and Key Supplying Markets)
- Export Market Analysis (Export Value, Volume, and Key Destination Markets)
- Wholesale Price Trend Analysis and Forecast
- Regulatory Framework
- List of Key Players
- Logistics and Infrastructure
- Seasonality Analysis
- Netherlands
- Production Analysis (Production Volume)
- Consumption Analysis (Consumption Value and Volume)
- Import Market Analysis (Import Value, Volume, and Key Supplying Markets)
- Export Market Analysis (Export Value, Volume, and Key Destination Markets)
- Wholesale Price Trend Analysis and Forecast
- Regulatory Framework
- List of Key Players
- Logistics and Infrastructure
- Seasonality Analysis
- Russia
- Production Analysis (Production Volume)
- Consumption Analysis (Consumption Value and Volume)
- Import Market Analysis (Import Value, Volume, and Key Supplying Markets)
- Export Market Analysis (Export Value, Volume, and Key Destination Markets)
- Wholesale Price Trend Analysis and Forecast
- Regulatory Framework
- List of Key Players
- Logistics and Infrastructure
- Seasonality Analysis
- Spain
- Production Analysis (Production Volume)
- Consumption Analysis (Consumption Value and Volume)
- Import Market Analysis (Import Value, Volume, and Key Supplying Markets)
- Export Market Analysis (Export Value, Volume, and Key Destination Markets)
- Wholesale Price Trend Analysis and Forecast
- Regulatory Framework
- List of Key Players
- Logistics and Infrastructure
- Seasonality Analysis
- France
- Production Analysis (Production Volume)
- Consumption Analysis (Consumption Value and Volume)
- Import Market Analysis (Import Value, Volume, and Key Supplying Markets)
- Export Market Analysis (Export Value, Volume, and Key Destination Markets)
- Wholesale Price Trend Analysis and Forecast
- Regulatory Framework
- List of Key Players
- Logistics and Infrastructure
- Seasonality Analysis
- Norway
- Asia-Pacific
- China
- Production Analysis (Production Volume)
- Consumption Analysis (Consumption Value and Volume)
- Import Market Analysis (Import Value, Volume, and Key Supplying Markets)
- Export Market Analysis (Export Value, Volume, and Key Destination Markets)
- Wholesale Price Trend Analysis and Forecast
- Regulatory Framework
- List of Key Players
- Logistics and Infrastructure
- Seasonality Analysis
- India
- Production Analysis (Production Volume)
- Consumption Analysis (Consumption Value and Volume)
- Import Market Analysis (Import Value, Volume, and Key Supplying Markets)
- Export Market Analysis (Export Value, Volume, and Key Destination Markets)
- Wholesale Price Trend Analysis and Forecast
- Regulatory Framework
- List of Key Players
- Logistics and Infrastructure
- Seasonality Analysis
- Indonesia
- Production Analysis (Production Volume)
- Consumption Analysis (Consumption Value and Volume)
- Import Market Analysis (Import Value, Volume, and Key Supplying Markets)
- Export Market Analysis (Export Value, Volume, and Key Destination Markets)
- Wholesale Price Trend Analysis and Forecast
- Regulatory Framework
- List of Key Players
- Logistics and Infrastructure
- Seasonality Analysis
- Vietnam
- Production Analysis (Production Volume)
- Consumption Analysis (Consumption Value and Volume)
- Import Market Analysis (Import Value, Volume, and Key Supplying Markets)
- Export Market Analysis (Export Value, Volume, and Key Destination Markets)
- Wholesale Price Trend Analysis and Forecast
- Regulatory Framework
- List of Key Players
- Logistics and Infrastructure
- Seasonality Analysis
- Myanmar
- Production Analysis (Production Volume)
- Consumption Analysis (Consumption Value and Volume)
- Import Market Analysis (Import Value, Volume, and Key Supplying Markets)
- Export Market Analysis (Export Value, Volume, and Key Destination Markets)
- Wholesale Price Trend Analysis and Forecast
- Regulatory Framework
- List of Key Players
- Logistics and Infrastructure
- Seasonality Analysis
- Japan
- Production Analysis (Production Volume)
- Consumption Analysis (Consumption Value and Volume)
- Import Market Analysis (Import Value, Volume, and Key Supplying Markets)
- Export Market Analysis (Export Value, Volume, and Key Destination Markets)
- Wholesale Price Trend Analysis and Forecast
- Regulatory Framework
- List of Key Players
- Logistics and Infrastructure
- Seasonality Analysis
- China
- South America
- Chile
- Production Analysis (Production Volume)
- Consumption Analysis (Consumption Value and Volume)
- Import Market Analysis (Import Value, Volume, and Key Supplying Markets)
- Export Market Analysis (Export Value, Volume, and Key Destination Markets)
- Wholesale Price Trend Analysis and Forecast
- Regulatory Framework
- List of Key Players
- Logistics and Infrastructure
- Seasonality Analysis
- Brazil
- Production Analysis (Production Volume)
- Consumption Analysis (Consumption Value and Volume)
- Import Market Analysis (Import Value, Volume, and Key Supplying Markets)
- Export Market Analysis (Export Value, Volume, and Key Destination Markets)
- Wholesale Price Trend Analysis and Forecast
- Regulatory Framework
- List of Key Players
- Logistics and Infrastructure
- Seasonality Analysis
- Peru
- Production Analysis (Production Volume)
- Consumption Analysis (Consumption Value and Volume)
- Import Market Analysis (Import Value, Volume, and Key Supplying Markets)
- Export Market Analysis (Export Value, Volume, and Key Destination Markets)
- Wholesale Price Trend Analysis and Forecast
- Regulatory Framework
- List of Key Players
- Logistics and Infrastructure
- Seasonality Analysis
- Chile
- Middle East
- Saudi Arabia
- Production Analysis (Production Volume)
- Consumption Analysis (Consumption Value and Volume)
- Import Market Analysis (Import Value, Volume, and Key Supplying Markets)
- Export Market Analysis (Export Value, Volume, and Key Destination Markets)
- Wholesale Price Trend Analysis and Forecast
- Regulatory Framework
- List of Key Players
- Logistics and Infrastructure
- Seasonality Analysis
- Turkey
- Production Analysis (Production Volume)
- Consumption Analysis (Consumption Value and Volume)
- Import Market Analysis (Import Value, Volume, and Key Supplying Markets)
- Export Market Analysis (Export Value, Volume, and Key Destination Markets)
- Wholesale Price Trend Analysis and Forecast
- Regulatory Framework
- List of Key Players
- Logistics and Infrastructure
- Seasonality Analysis
- United Arab Emirates
- Production Analysis (Production Volume)
- Consumption Analysis (Consumption Value and Volume)
- Import Market Analysis (Import Value, Volume, and Key Supplying Markets)
- Export Market Analysis (Export Value, Volume, and Key Destination Markets)
- Wholesale Price Trend Analysis and Forecast
- Regulatory Framework
- List of Key Players
- Logistics and Infrastructure
- Seasonality Analysis
- Saudi Arabia
- Africa
- Egypt
- Production Analysis (Production Volume)
- Consumption Analysis (Consumption Value and Volume)
- Import Market Analysis (Import Value, Volume, and Key Supplying Markets)
- Export Market Analysis (Export Value, Volume, and Key Destination Markets)
- Wholesale Price Trend Analysis and Forecast
- Regulatory Framework
- List of Key Players
- Logistics and Infrastructure
- Seasonality Analysis
- Nigeria
- Production Analysis (Production Volume)
- Consumption Analysis (Consumption Value and Volume)
- Import Market Analysis (Import Value, Volume, and Key Supplying Markets)
- Export Market Analysis (Export Value, Volume, and Key Destination Markets)
- Wholesale Price Trend Analysis and Forecast
- Regulatory Framework
- List of Key Players
- Logistics and Infrastructure
- Seasonality Analysis
- South Africa
- Production Analysis (Production Volume)
- Consumption Analysis (Consumption Value and Volume)
- Import Market Analysis (Import Value, Volume, and Key Supplying Markets)
- Export Market Analysis (Export Value, Volume, and Key Destination Markets)
- Wholesale Price Trend Analysis and Forecast
- Regulatory Framework
- List of Key Players
- Logistics and Infrastructure
- Seasonality Analysis
- Egypt
- North America
Detailed Research Methodology and Data Validation
Primary Research
Mordor analysts ran semi-structured interviews and short surveys with processors, aquaculture growers, exporters, and cold-chain logisticians across Asia-Pacific, Europe, and the Americas.
These conversations validated farm-gate pricing spreads, verified live-weight-to-edible-weight conversion factors, and clarified policy shifts such as EU IUU regulations that cannot be captured through desk research alone.
Desk Research
We began with structured reviews of open datasets from the FAO FishStat, UN Comtrade customs filings, and the latest OECD-FAO Agricultural Outlook. These offered harmonized production, consumption, and price series by species group.
National sources such as NOAA Fisheries, China's Ministry of Agriculture, Eurostat, and India's Department of Fisheries strengthened country splits, while peer-reviewed journals clarified feed-conversion ratios and climate impacts.
Subscription platforms, D&B Hoovers for company revenues and Dow Jones Factiva for trade-press signal checks, rounded out trend validation.
This list is illustrative; many additional repositories informed data cleaning and cross-checks.
Market-Sizing & Forecasting
We rebuild 2024-base values through a top-down reconstruction of FAO output and bilateral trade, netting re-exports and adjusting for average ex-vessel pricing, which is then corroborated with selective bottom-up roll-ups of publicly listed harvester revenues and sampled average-selling-price × volume checks.
Key model drivers include aquaculture output growth, per-capita fish intake, capture quota revisions, wholesale price spreads, and feed cost ratios.
A multivariate regression framework links these variables to value expansion, while scenario analysis tests shocks such as El Niño events.
Data gaps, common in small artisanal fleets, are bridged with regional proxy ratios reviewed by local experts before lock-in.
Data Validation & Update Cycle
Outputs pass three-tier variance scans, senior-peer review, and anomaly re-contacts.
Models refresh annually; interim updates trigger when quotas change, major disease outbreaks occur, or currency swings exceed preset thresholds.
Clients therefore receive a freshly verified view each time a download is delivered.
Why Mordor's Global Fish Baseline Commands Reliability
Published estimates vary because firms pick different aquatic species baskets, price anchors, and refresh cadences.
We flag these factors upfront so buyers understand where numbers diverge before decisions are made.
Benchmark comparison
| Market Size | Anonymized source | Primary gap driver |
|---|---|---|
| USD 1.09 trillion (2025) | Mordor Intelligence | - |
| USD 386.99 billion (2025) | Global Consultancy A | Combines fish with shellfish yet reports only retail-level revenues |
| USD 251.8 billion (2025) | Industry Portal B | Focuses on fresh fish segment and omits frozen and processed flows |
| USD 163.589 billion (2025) | Regional Consultancy C | Tracks freshwater species only and excludes marine capture |
The comparison shows that once scope, value chain node, and species coverage are normalized, Mordor's disciplined variable selection yields the broadest yet traceable baseline, offering planners a dependable starting point for strategy and budgeting.


Key Questions Answered in the Report
How large is the fish market in 2026?
The fish market size is estimated at USD 1.02 trillion in 2026, driven by robust demand in Asia-Pacific and rapid growth in Africa.
What is the projected growth rate for fish market between 2026 and 2031?
What is the projected growth rate for the fish market between 2026 and 2031?
Which region commands the largest share of commercial seafood today?
Asia-Pacific held a 53.20% fish market share in 2025, anchored by China, India, and Indonesia.
Why are offshore cages important for future salmon supply?
Semi-submersible cages such as Ocean Farm 1 reduce coastal zoning conflicts, cut mortality by double digits, and promise competitive production costs.
How is antibiotic scrutiny affecting exporters?
Stricter residue limits in Europe have led to shipment rejections worth USD 140 million for some Asian shrimp producers, forcing a shift toward alternative health management tools.
Page last updated on:


