Freshwater Fish Market Size and Share
Freshwater Fish Market Analysis by Mordor Intelligence
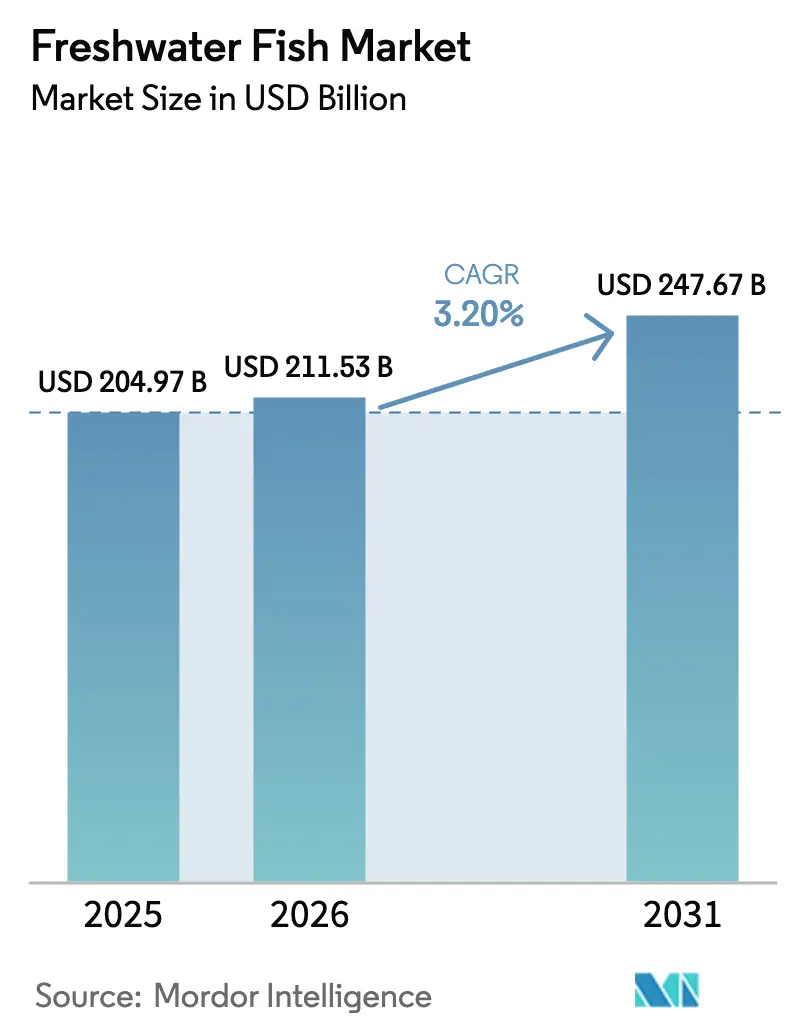
The freshwater fish market was valued at USD 204.97 billion in 2025 and is estimated to grow from USD 211.53 billion in 2026 and is projected to USD 247.67 billion by 2031, reflecting a 3.2% CAGR over the forecast period. Farmed production already represents more than 85% of total supply as aquaculture continues to displace wild-capture output in 2025[1]Source: Food and Agriculture Organization, “Water Use Efficiency in Aquaculture Systems – Global Assessment 2025,” fao.org. Demand growth is strongest where urban middle-class households value lean animal protein, while supply growth is anchored in Asia-Pacific pond and cage expansions, selective breeding gains, and investments in recirculating aquaculture systems (RAS). Competitive dynamics favor operators that combine cost-efficient feed conversion, strict biosecurity, and third-party certification, since retailers in Europe and North America now require verifiable sustainability credentials for shelf placement. Parallel trends include rapid cold-chain penetration in Africa, water-footprint scrutiny by institutional investors, and localized disease outbreaks that periodically disrupt high-density farms. These factors collectively support steady growth, with the freshwater fish market projected to maintain moderate margins for producers utilizing technology.
Key Report Takeaways
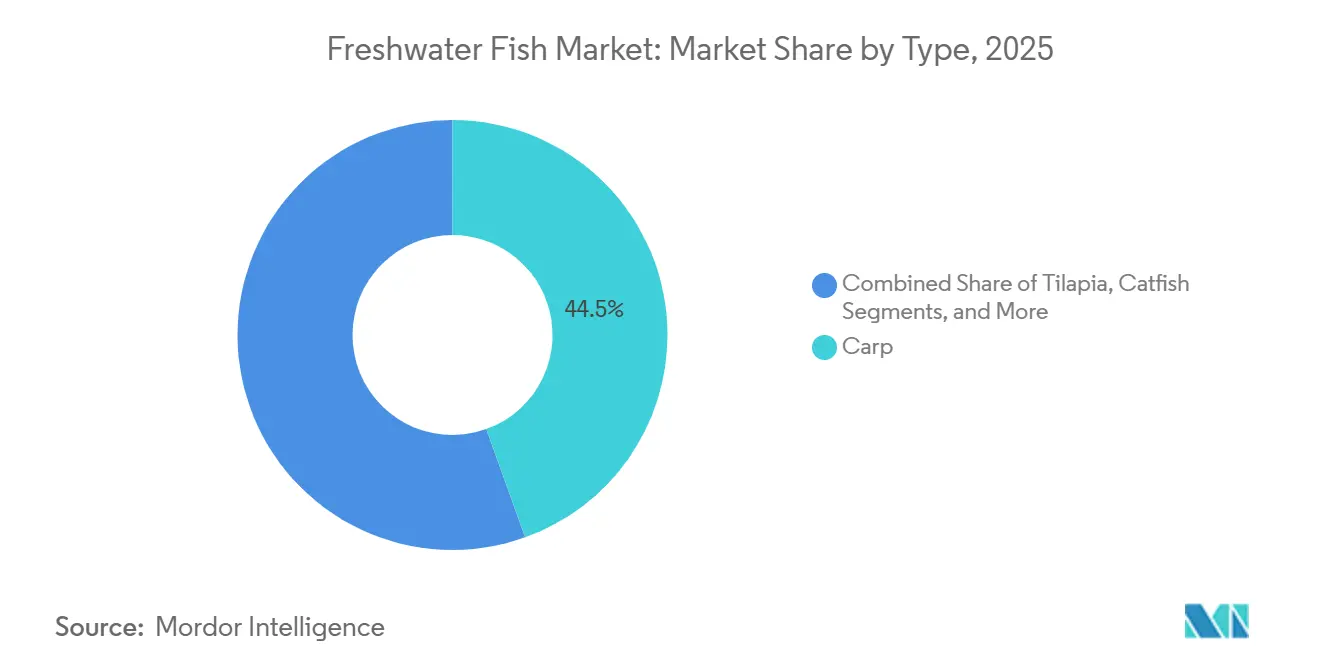
- By type, carps led with 44.50% of the freshwater fish market share in 2025, while tilapia is forecast to expand at a 6.90% CAGR through 2031.
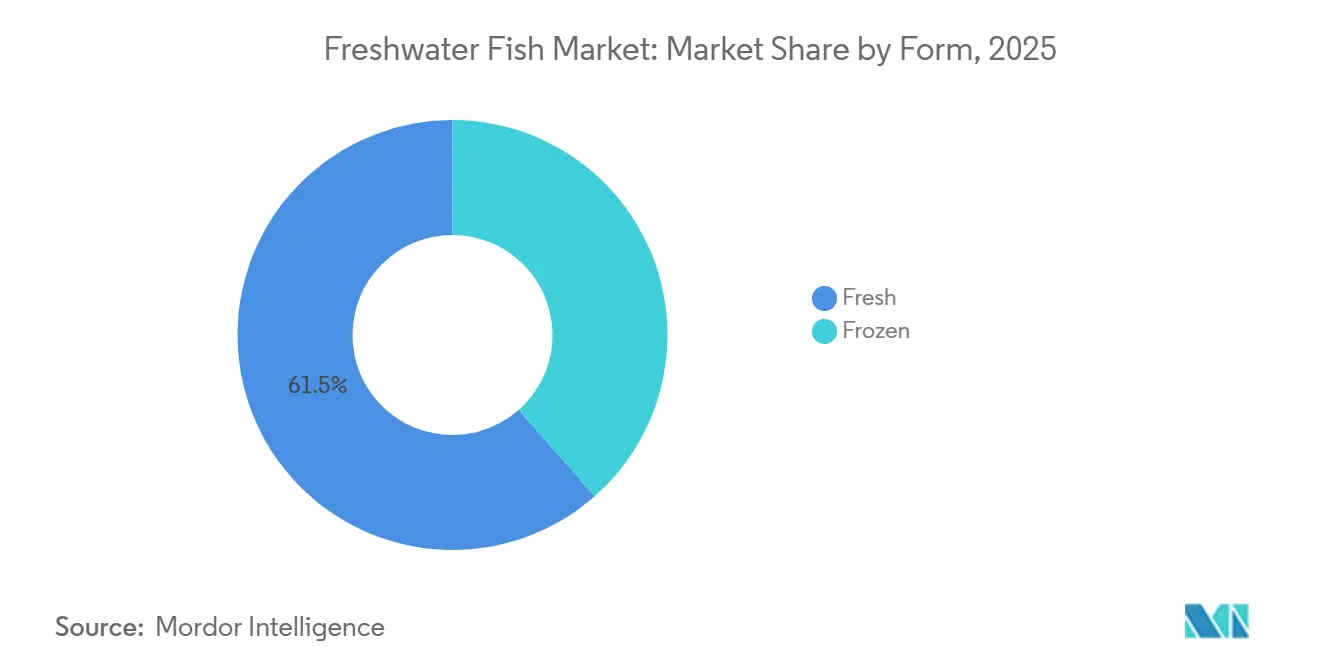
- By form, fresh products captured 61.50% of the freshwater fish market size in 2025, and frozen formats are advancing at a 5.40% CAGR from 2026 to 2031.
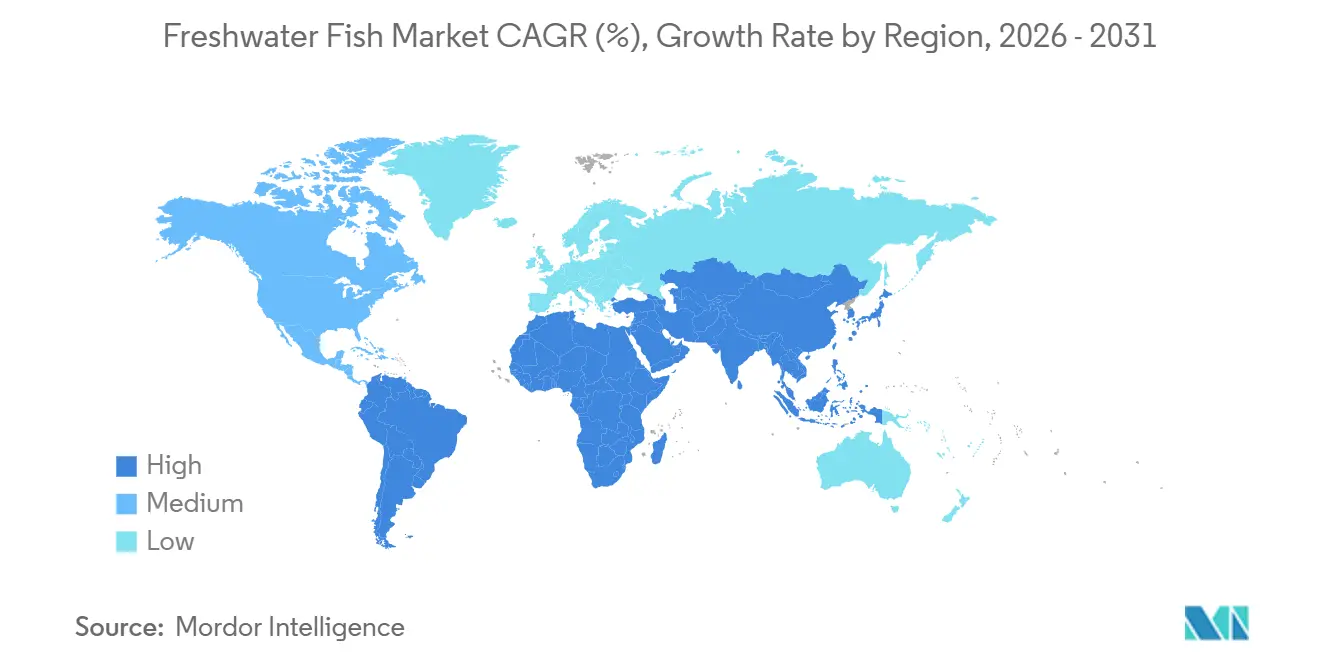
- By geography, Asia-Pacific accounted for a 70.80% of the freshwater fish market size in 2025, whereas Africa is the fastest-growing region, with a 5.80% CAGR through 2031.
Note: Market size and forecast figures in this report are generated using Mordor Intelligence’s proprietary estimation framework, updated with the latest available data and insights as of January 2026.
Global Freshwater Fish Market Trends and Insights
Drivers Impact Analysis*
| Driver | (~) % Impact on CAGR Forecast | Geographic Relevance | Impact Timeline |
|---|---|---|---|
| Rising global demand for lean animal protein | +0.8% | Global, peak in Asia-Pacific, North America, and Europe | Medium term (2–4 years) |
| Expansion of aquaculture capacity in Asia-Pacific | +1.2% | Asia-Pacific core, spillover to Middle East and Africa | Long term (≥ 4 years) |
| Government incentives for sustainable aquaculture | +0.6% | Asia-Pacific, Europe, and South America | Medium term (2–4 years) |
| Advances in breeding and feed technologies | +0.7% | Global early rollout in North America, Europe, and Asia-Pacific | Long term (≥ 4 years) |
| ESG-driven preference for low-water-footprint proteins | +0.4% | North America, Europe, and emerging in Asia-Pacific cities | Long term (≥ 4 years) |
| Rapid rollout of urban RAS hatcheries near megacities | +0.5% | Asia-Pacific, North America, and select European hubs | Short term (≤ 2 years) |
| Source: Mordor Intelligence | |||
Rising Global Demand for Lean Animal Protein
Health-conscious consumers are choosing lean protein, and freshwater fish supplies a low-fat option rich in omega-3 fatty acids. Per-capita consumption exceeded 24 kilograms in Asia-Pacific and reached 9.3 kilograms in North America during 2025[2]Source: United States Department of Agriculture, “Dietary Guidelines for Americans 2020-2025,” dietaryguidelines.gov. The United States Department of Agriculture (USDA) Dietary Guidelines recommend two seafood servings each week, prompting hospitals and schools to expand fish menus. Retailers reacted by adding private-label tilapia and catfish Stock Keeping Units (SKUs), boosting shelf space 12% year over year in major United States grocery chains. Middle-class households in India and Indonesia also elevated fish intake as incomes rose and fish remained price-competitive with poultry and pork. Together, these factors lift baseline demand and underpin steady sales growth for certified suppliers.
Expansion of Aquaculture Capacity in Asia-Pacific
By 2030, China, India, and Indonesia are projected to expand their inland and cage-based aquaculture capacities significantly. These efforts are supported by policy frameworks emphasizing modernization, productivity improvements, and supply chain efficiency. India’s Pradhan Mantri Matsya Sampada Yojana (PMMSY) earmarked USD 3.1 billion (INR 260 billion) to boost inland output by 70% by 2027. Indonesia saw 9% annual output growth from 2024 to 2025, driven by improved hatchery networks. Expanding infrastructure is streamlining supply chains and driving vertical integration. In 2026, SmartGreen Aquaculture launched India’s first premium inland trout-farming facility in Telangana state, investing USD 6 million to demonstrate tech-enabled trout farming in non-traditional regions.
Government Incentives for Sustainable Aquaculture
Public-sector incentives are driving the transition to sustainable and regulated freshwater aquaculture systems. In Europe, the European Maritime, Fisheries and Aquaculture Fund (EMFAF) allocates approximately USD 6.6 billion (EUR 6.1 billion) for 2021–2027, prioritizing low-carbon production, technological modernization, and environmental compliance in line with the European Green Deal. In emerging regions, governments are linking incentives to sustainability rather than production growth. Brazil rewards certification, traceability, and formalization in inland aquaculture, aligning with global standards. In Chile, regulatory momentum in 2025 approved 57 projects focused on fisheries governance, water management, and environmental compliance. These incentives lower barriers for sustainable technologies, improve regulatory certainty, and support consolidation toward compliant operators.
Advances in Breeding and Feed Technologies
Genomic selection shortened the generation intervals of tilapia and catfish while reducing feed conversion ratios (FCR) by 15%. WorldFish trials showed that genetically improved farmed tilapia (GIFT) exhibit significantly faster growth than many traditional, non-improved strains. This leads to shorter production cycles and enhanced feed conversion efficiency[3]Source: WorldFish Center, “GIFT Performance Trials 2025,” worldfishcenter.org. Feed makers introduced insect meal, algae protein, and microbiome-optimized formulations. Cargill, Incorporated's Latitude plant-based diets trim marine-ingredient use by 40%. Skretting’s AquaCare Probiotic, a probiotic water-care solution, cut antibiotic use in catfish farms. Digital feeding systems that use computer vision and AI for real-time biomass and behavior monitoring have demonstrated improved feed distribution accuracy and reduced feed waste compared to traditional methods, thereby enhancing water quality and margins.
Restraints Impact Analysis*
| Restraint | (~) % Impact on CAGR Forecast | Geographic Relevance | Impact Timeline |
|---|---|---|---|
| Disease outbreaks and biosecurity risks | −0.6% | Global, acute in Asia-Pacific and emerging African zones | Short term (≤ 2 years) |
| Volatile feed ingredient prices | −0.4% | Global, pronounced in import-dependent Middle East, Africa, and South America | Medium term (2–4 years) |
| Tightening effluent-discharge regulations | −0.3% | Europe, North America, and stricter in Asia-Pacific cities | Long term (≥ 4 years) |
| Plant-based fish substitutes in institutional catering | −0.2% | North America and Europe early adopters | Medium term (2–4 years) |
| Source: Mordor Intelligence | |||
Disease Outbreaks and Biosecurity Risks
High-density farming is elevating pathogen risk. Streptococcus agalactiae is a bacterial pathogen affecting tilapia and other farmed fish in Southeast Asia, linked to higher mortality and economic risks in intensive aquaculture with high stocking density and poor biosecurity[4]Source: World Organisation for Animal Health, “Aquatic Animal Health Code 2025,” woah.org. In 2025, Koi Herpesvirus (KHV) significantly reduced carp production in Indonesia, highlighting ongoing biosecurity challenges. Although the World Organisation for Animal Health updated its disease surveillance guidelines in 2025, diagnostic coverage remains inconsistent, particularly in rural areas of Asia and Africa. Vaccines developed by Merck Animal Health can reduce Streptococcus-related mortality by up to 70%, but adoption is limited by inadequate cold-chain infrastructure and high per-dose costs. Consequently, the capital requirements for modern biosecurity improvements place a disproportionate burden on smallholders, driving sector consolidation in favor of larger, better-financed aquaculture producers.
Volatile Feed Ingredient Prices
Volatile feed ingredient prices continue to pose a structural challenge for freshwater aquaculture, where feed accounts for 50–60% of total production costs and significantly impacts farm-level margins. Climate-induced supply disruptions led to a 22% increase in soybean meal prices between January 2024 and June 2025, following drought-affected harvests in Brazil and Argentina. Similarly, reduced anchovy landings in Peru drove fishmeal prices to approximately USD 1,850 per metric ton by late 2024. In 2025, corn futures experienced significant volatility, ranging from USD 4.20 to USD 5.80 per bushel, complicating feed mills' forward procurement. While alternative proteins provide diversification opportunities, their 15–25% price premiums hinder widespread adoption in the near term. Consequently, unhedged small-scale producers in cost-sensitive markets are compelled to halt production during prolonged periods of input-cost pressure, underscoring the sector's susceptibility to feed-price volatility.
*Our forecasts treat driver/restraint impacts as directional, not additive. The impact forecasts reflect baseline growth, mix effects, and variable interactions.
Segment Analysis
By Type: Carps Anchor Volume, Tilapia Drives Growth
Carps accounted for 44.50% of the freshwater fish market share in 2025, reflecting their dominance in Asian polyculture systems that efficiently recycle nutrients. Tilapia is projected to register a 6.90% CAGR to 2031, outpacing other species due to RAS scalability and strong acceptance in Africa and the Middle East, where boneless fillets are valued. Hybrid catfish strains sustain the United States output of more than 100,000 metric tons under the United States Department of Agriculture (USDA) inspection program, strengthening domestic branding. Trout farming in Chile and Norway has increasingly focused on premium consumer segments, achieving higher farm-gate prices compared to mass-market freshwater species such as tilapia. Genetic advances reinforce competitive shifts, as KHV-resistant carp strains and salinity-tolerant genetically improved farmed tilapia (GIFT) extend viable farm sites.
Continued genomic selection is narrowing the cost gap between tilapia and carp. WorldFish has conducted multiple studies demonstrating that genetically improved farmed tilapia (GIFT) achieves higher survival rates and better performance than unimproved strains across various environmental conditions, including brackish and variable-salinity waters. In the United States, catfish farmers have been using hybrid strains for over a decade. These strains require lower dissolved oxygen levels, reducing the need for aeration and energy costs while maintaining stocking densities. In China, national carp breeding programs have introduced disease-resistant and stress-tolerant lines, increasingly adopted by commercial hatcheries to mitigate biosecurity risks in high-density pond farming. These genetic improvements have enhanced resilience, reduced losses, and boosted productivity in freshwater aquaculture. These innovations are anticipated to support multi-species portfolios while enabling tilapia to gain a greater share along the value chain.


By Form: Fresh Dominates, Frozen Gains Institutional Traction
Fresh formats accounted for 61.50% of the freshwater fish market size in 2025, as live-fish retail remained customary in Asia-Pacific wet markets. Frozen products are tracking a 5.40% CAGR through 2031, supported by expanding cold chains in Africa and growing institutional demand for shelf-stable inventory. Blast-freezing to −40 °C within 2 hours maintains texture, allowing frozen tilapia fillets to be priced within 10% of fresh in Europe and North America. The European Union Catch Documentation Scheme makes traceability easier for centrally processed frozen fish, tilting import demand toward frozen formats.
Asia-Pacific urban RAS installations are driving new preferences by enabling same-day harvest and delivery, especially in megacities such as Shanghai and Jakarta. However, in export-oriented zones, processors that deploy blast-freezers near farms capture margin premiums by shipping traceable frozen fillets to North American and European buyers. The divergent patterns indicate coexistence, as frozen growth will ride cold-chain expansion and import regulations, while fresh will retain primacy in cultures that equate live product with quality.
Geography Analysis
Asia-Pacific accounted for a 70.80% share of the market in 2025, as China’s integrated chain keeps farm-gate prices for carp and tilapia below USD 2.50 per kilogram, sustaining mass-market access. India’s PMMSY funding from 2021-2025 of USD 3.1 billion (INR 260 billion) supports biofloc ponds and reservoir cages aimed at increasing production by 70% by 2027. Indonesia’s annual output rose 9% from 2024 to 2025, driven by stronger hatchery networks.
Africa is registering the highest growth at 5.80% CAGR to 2031, led by Egypt and Nigeria. Egypt approved 120 farm licenses and added to aquaculture production in 2025 under tax-holiday incentives for Best Aquaculture Practices (BAP)-certified producers. Nigeria launched a USD 0.14 million (NGN 200 million) aquaculture fund in 2024 to finance pond and hatchery upgrades. Cold-chain deficits still cause 15–20% live-haul mortality, yet improving road links and ice-plant installations are narrowing the gap.
North America and Europe grow more slowly, reflecting mature demand and stricter effluent rules. The United States imports frozen tilapia mainly from China and Indonesia. European Union states have been significant importers of certified freshwater fish, with sustainability certification (such as Aquaculture Stewardship Council (ASC) or BAP) effectively required by many major retail chains to maintain market access. South America's growth is led by Brazil’s 662,230 metric tons of tilapia production in 2024, leveraging hydropower reservoirs, and Chile’s 54,117 metric tons of trout exports. The Middle East favors RAS and brackish-water tilapia due to water scarcity, and Iran is planning to expand aquaculture through subsidy-backed feed and fingerling programs. Regional heterogeneity suggests that global suppliers must tailor species, form, and certification strategies to local resource and policy contexts.

Competitive Landscape
The aquaculture industry is characterized by a dynamic competitive landscape driven by innovation, sustainability, and regulatory frameworks. Hatchery leaders Genomar and Tropical Aquaculture Products monetize proprietary genetics, charging 20–30% premiums for disease-resistant fingerlings. Feed giants Cargill Aqua Nutrition, Skretting, and BioMar influence cost curves, as feed accounts for the majority of grow-out expenses. Processors such as Regal Springs integrate farms with processing and chilled logistics assets, supplying United States retailers such as Walmart and Costco.
Technology firms AKVA Group and Pentair Advanced Energy Solutions (AES) supply RAS hardware, sensors, and machine-learning feeders that cut waste by 10–15%. Patent filings for aquaculture tech grew 34% between 2023 and 2025, with 187 United States patents granted for RAS and feed innovations. Certification bodies such as the Aquaculture Stewardship Council and Global Aquaculture Alliance set the gatekeeping rules for premium retail access, catalyzing convergence toward ISO 14001 and Life Cycle Assessment benchmarks.
Disruptive entrants include Bluu Seafood and Wildtype, which secured regulatory nods for cell-cultured fish in 2024-2025, though commercial volumes are minimal. Retailers are also shifting power downstream through private labels that demand predictable volumes and verified sustainability. Capital flows increasingly reward closed-loop urban RAS projects, while commodity pond farms consolidate or exit under rising biosecurity and effluent costs. The competitive outlook, therefore, hinges on the speed of technology adoption, compliance with certification requirements, and access to patient environmental, social, and governance (ESG)-aligned capital.
Recent Industry Developments
- January 2026: India’s Department of Fisheries launched structured aquaculture capacity-building programs for 2025–2027, covering advanced hatchery operations, RAS, biofloc systems, cage culture, and ornamental breeding, to scale sustainable freshwater fish farming across community and commercial producers.
- January 2026: India inaugurated its first integrated RAS trout farming facility in Hyderabad, employing advanced recirculating technology to breed and raise cold-water trout species, demonstrating scalable freshwater aquaculture for non-traditional geographies and enhancing genetic/production capacity for trout.
- December 2025: Egypt expanded large-scale tilapia hatchery capacity using temperature-controlled RAS facilities in Port Said, boosting fry production and supporting plans for up to 150,000 metric tons of annual tilapia output, with smaller hatchery improvements also advanced to strengthen seed supply and biosecurity.


Global Freshwater Fish Market Report Scope
The Freshwater Fish Market Report is Segmented by Type (Carps, Tilapia, Catfish, and More), by Form (Fresh and Frozen), and by Geography (North America, South America, Europe, Asia-Pacific, and More). The Report Includes Production Analysis (Volume), Consumption Analysis (Value and Volume), Import Analysis (Value and Volume), Regulatory Framework, List of Key Players, and Logistics and Infrastructure. The Market Forecasts are Provided in Terms of Value (USD) and Volume (Metric Tons).
| Carps |
| Tilapia |
| Catfish |
| Freshwater Salmonids |
| Other Species |
| Fresh |
| Frozen |
| North America | United States | Production Analysis (Production Volume) |
| Consumption Analysis (Consumption Value and Volume) | ||
| Import Market Analysis (Import Value, Volume, and Key Supplying Markets) | ||
| Export Market Analysis (Export Value, Volume, and Key Destination Markets) | ||
| Wholesale Price Trend Analysis and Forecast | ||
| Regulatory Framework | ||
| List of Key Players | ||
| Logistics and Infrastructure | ||
| Canada | Production Analysis (Production Volume) | |
| Consumption Analysis (Consumption Value and Volume) | ||
| Import Market Analysis (Import Value, Volume, and Key Supplying Markets) | ||
| Export Market Analysis (Export Value, Volume, and Key Destination Markets) | ||
| Wholesale Price Trend Analysis and Forecast | ||
| Regulatory Framework | ||
| List of Key Players | ||
| Logistics and Infrastructure | ||
| South America | Brazil | Production Analysis (Production Volume) |
| Consumption Analysis (Consumption Value and Volume) | ||
| Import Market Analysis (Import Value, Volume, and Key Supplying Markets) | ||
| Export Market Analysis (Export Value, Volume, and Key Destination Markets) | ||
| Wholesale Price Trend Analysis and Forecast | ||
| Regulatory Framework | ||
| List of Key Players | ||
| Logistics and Infrastructure | ||
| Chile | Production Analysis (Production Volume) | |
| Consumption Analysis (Consumption Value and Volume) | ||
| Import Market Analysis (Import Value, Volume, and Key Supplying Markets) | ||
| Export Market Analysis (Export Value, Volume, and Key Destination Markets) | ||
| Wholesale Price Trend Analysis and Forecast | ||
| Regulatory Framework | ||
| List of Key Players | ||
| Logistics and Infrastructure | ||
| Europe | Germany | Production Analysis (Production Volume) |
| Consumption Analysis (Consumption Value and Volume) | ||
| Import Market Analysis (Import Value, Volume, and Key Supplying Markets) | ||
| Export Market Analysis (Export Value, Volume, and Key Destination Markets) | ||
| Wholesale Price Trend Analysis and Forecast | ||
| Regulatory Framework | ||
| List of Key Players | ||
| Logistics and Infrastructure | ||
| United Kingdom | Production Analysis (Production Volume) | |
| Consumption Analysis (Consumption Value and Volume) | ||
| Import Market Analysis (Import Value, Volume, and Key Supplying Markets) | ||
| Export Market Analysis (Export Value, Volume, and Key Destination Markets) | ||
| Wholesale Price Trend Analysis and Forecast | ||
| Regulatory Framework | ||
| List of Key Players | ||
| Logistics and Infrastructure | ||
| Spain | Production Analysis (Production Volume) | |
| Consumption Analysis (Consumption Value and Volume) | ||
| Import Market Analysis (Import Value, Volume, and Key Supplying Markets) | ||
| Export Market Analysis (Export Value, Volume, and Key Destination Markets) | ||
| Wholesale Price Trend Analysis and Forecast | ||
| Regulatory Framework | ||
| List of Key Players | ||
| Logistics and Infrastructure | ||
| France | Production Analysis (Production Volume) | |
| Consumption Analysis (Consumption Value and Volume) | ||
| Import Market Analysis (Import Value, Volume, and Key Supplying Markets) | ||
| Export Market Analysis (Export Value, Volume, and Key Destination Markets) | ||
| Wholesale Price Trend Analysis and Forecast | ||
| Regulatory Framework | ||
| List of Key Players | ||
| Logistics and Infrastructure | ||
| Asia-Pacific | China | Production Analysis (Production Volume) |
| Consumption Analysis (Consumption Value and Volume) | ||
| Import Market Analysis (Import Value, Volume, and Key Supplying Markets) | ||
| Export Market Analysis (Export Value, Volume, and Key Destination Markets) | ||
| Wholesale Price Trend Analysis and Forecast | ||
| Regulatory Framework | ||
| List of Key Players | ||
| Logistics and Infrastructure | ||
| India | Production Analysis (Production Volume) | |
| Consumption Analysis (Consumption Value and Volume) | ||
| Import Market Analysis (Import Value, Volume, and Key Supplying Markets) | ||
| Export Market Analysis (Export Value, Volume, and Key Destination Markets) | ||
| Wholesale Price Trend Analysis and Forecast | ||
| Regulatory Framework | ||
| List of Key Players | ||
| Logistics and Infrastructure | ||
| Indonesia | Production Analysis (Production Volume) | |
| Consumption Analysis (Consumption Value and Volume) | ||
| Import Market Analysis (Import Value, Volume, and Key Supplying Markets) | ||
| Export Market Analysis (Export Value, Volume, and Key Destination Markets) | ||
| Wholesale Price Trend Analysis and Forecast | ||
| Regulatory Framework | ||
| List of Key Players | ||
| Logistics and Infrastructure | ||
| Vietnam | Production Analysis (Production Volume) | |
| Consumption Analysis (Consumption Value and Volume) | ||
| Import Market Analysis (Import Value, Volume, and Key Supplying Markets) | ||
| Export Market Analysis (Export Value, Volume, and Key Destination Markets) | ||
| Wholesale Price Trend Analysis and Forecast | ||
| Regulatory Framework | ||
| List of Key Players | ||
| Logistics and Infrastructure | ||
| Middle East | Iran | Production Analysis (Production Volume) |
| Consumption Analysis (Consumption Value and Volume) | ||
| Import Market Analysis (Import Value, Volume, and Key Supplying Markets) | ||
| Export Market Analysis (Export Value, Volume, and Key Destination Markets) | ||
| Wholesale Price Trend Analysis and Forecast | ||
| Regulatory Framework | ||
| List of Key Players | ||
| Logistics and Infrastructure | ||
| Turkey | Production Analysis (Production Volume) | |
| Consumption Analysis (Consumption Value and Volume) | ||
| Import Market Analysis (Import Value, Volume, and Key Supplying Markets) | ||
| Export Market Analysis (Export Value, Volume, and Key Destination Markets) | ||
| Wholesale Price Trend Analysis and Forecast | ||
| Regulatory Framework | ||
| List of Key Players | ||
| Logistics and Infrastructure | ||
| Africa | Egypt | Production Analysis (Production Volume) |
| Consumption Analysis (Consumption Value and Volume) | ||
| Import Market Analysis (Import Value, Volume, and Key Supplying Markets) | ||
| Export Market Analysis (Export Value, Volume, and Key Destination Markets) | ||
| Wholesale Price Trend Analysis and Forecast | ||
| Regulatory Framework | ||
| List of Key Players | ||
| Logistics and Infrastructure | ||
| Nigeria | Production Analysis (Production Volume) | |
| Consumption Analysis (Consumption Value and Volume) | ||
| Import Market Analysis (Import Value, Volume, and Key Supplying Markets) | ||
| Export Market Analysis (Export Value, Volume, and Key Destination Markets) | ||
| Wholesale Price Trend Analysis and Forecast | ||
| Regulatory Framework | ||
| List of Key Players | ||
| Logistics and Infrastructure | ||
| By Type | Carps | ||
| Tilapia | |||
| Catfish | |||
| Freshwater Salmonids | |||
| Other Species | |||
| By Form | Fresh | ||
| Frozen | |||
| By Geography | North America | United States | Production Analysis (Production Volume) |
| Consumption Analysis (Consumption Value and Volume) | |||
| Import Market Analysis (Import Value, Volume, and Key Supplying Markets) | |||
| Export Market Analysis (Export Value, Volume, and Key Destination Markets) | |||
| Wholesale Price Trend Analysis and Forecast | |||
| Regulatory Framework | |||
| List of Key Players | |||
| Logistics and Infrastructure | |||
| Canada | Production Analysis (Production Volume) | ||
| Consumption Analysis (Consumption Value and Volume) | |||
| Import Market Analysis (Import Value, Volume, and Key Supplying Markets) | |||
| Export Market Analysis (Export Value, Volume, and Key Destination Markets) | |||
| Wholesale Price Trend Analysis and Forecast | |||
| Regulatory Framework | |||
| List of Key Players | |||
| Logistics and Infrastructure | |||
| South America | Brazil | Production Analysis (Production Volume) | |
| Consumption Analysis (Consumption Value and Volume) | |||
| Import Market Analysis (Import Value, Volume, and Key Supplying Markets) | |||
| Export Market Analysis (Export Value, Volume, and Key Destination Markets) | |||
| Wholesale Price Trend Analysis and Forecast | |||
| Regulatory Framework | |||
| List of Key Players | |||
| Logistics and Infrastructure | |||
| Chile | Production Analysis (Production Volume) | ||
| Consumption Analysis (Consumption Value and Volume) | |||
| Import Market Analysis (Import Value, Volume, and Key Supplying Markets) | |||
| Export Market Analysis (Export Value, Volume, and Key Destination Markets) | |||
| Wholesale Price Trend Analysis and Forecast | |||
| Regulatory Framework | |||
| List of Key Players | |||
| Logistics and Infrastructure | |||
| Europe | Germany | Production Analysis (Production Volume) | |
| Consumption Analysis (Consumption Value and Volume) | |||
| Import Market Analysis (Import Value, Volume, and Key Supplying Markets) | |||
| Export Market Analysis (Export Value, Volume, and Key Destination Markets) | |||
| Wholesale Price Trend Analysis and Forecast | |||
| Regulatory Framework | |||
| List of Key Players | |||
| Logistics and Infrastructure | |||
| United Kingdom | Production Analysis (Production Volume) | ||
| Consumption Analysis (Consumption Value and Volume) | |||
| Import Market Analysis (Import Value, Volume, and Key Supplying Markets) | |||
| Export Market Analysis (Export Value, Volume, and Key Destination Markets) | |||
| Wholesale Price Trend Analysis and Forecast | |||
| Regulatory Framework | |||
| List of Key Players | |||
| Logistics and Infrastructure | |||
| Spain | Production Analysis (Production Volume) | ||
| Consumption Analysis (Consumption Value and Volume) | |||
| Import Market Analysis (Import Value, Volume, and Key Supplying Markets) | |||
| Export Market Analysis (Export Value, Volume, and Key Destination Markets) | |||
| Wholesale Price Trend Analysis and Forecast | |||
| Regulatory Framework | |||
| List of Key Players | |||
| Logistics and Infrastructure | |||
| France | Production Analysis (Production Volume) | ||
| Consumption Analysis (Consumption Value and Volume) | |||
| Import Market Analysis (Import Value, Volume, and Key Supplying Markets) | |||
| Export Market Analysis (Export Value, Volume, and Key Destination Markets) | |||
| Wholesale Price Trend Analysis and Forecast | |||
| Regulatory Framework | |||
| List of Key Players | |||
| Logistics and Infrastructure | |||
| Asia-Pacific | China | Production Analysis (Production Volume) | |
| Consumption Analysis (Consumption Value and Volume) | |||
| Import Market Analysis (Import Value, Volume, and Key Supplying Markets) | |||
| Export Market Analysis (Export Value, Volume, and Key Destination Markets) | |||
| Wholesale Price Trend Analysis and Forecast | |||
| Regulatory Framework | |||
| List of Key Players | |||
| Logistics and Infrastructure | |||
| India | Production Analysis (Production Volume) | ||
| Consumption Analysis (Consumption Value and Volume) | |||
| Import Market Analysis (Import Value, Volume, and Key Supplying Markets) | |||
| Export Market Analysis (Export Value, Volume, and Key Destination Markets) | |||
| Wholesale Price Trend Analysis and Forecast | |||
| Regulatory Framework | |||
| List of Key Players | |||
| Logistics and Infrastructure | |||
| Indonesia | Production Analysis (Production Volume) | ||
| Consumption Analysis (Consumption Value and Volume) | |||
| Import Market Analysis (Import Value, Volume, and Key Supplying Markets) | |||
| Export Market Analysis (Export Value, Volume, and Key Destination Markets) | |||
| Wholesale Price Trend Analysis and Forecast | |||
| Regulatory Framework | |||
| List of Key Players | |||
| Logistics and Infrastructure | |||
| Vietnam | Production Analysis (Production Volume) | ||
| Consumption Analysis (Consumption Value and Volume) | |||
| Import Market Analysis (Import Value, Volume, and Key Supplying Markets) | |||
| Export Market Analysis (Export Value, Volume, and Key Destination Markets) | |||
| Wholesale Price Trend Analysis and Forecast | |||
| Regulatory Framework | |||
| List of Key Players | |||
| Logistics and Infrastructure | |||
| Middle East | Iran | Production Analysis (Production Volume) | |
| Consumption Analysis (Consumption Value and Volume) | |||
| Import Market Analysis (Import Value, Volume, and Key Supplying Markets) | |||
| Export Market Analysis (Export Value, Volume, and Key Destination Markets) | |||
| Wholesale Price Trend Analysis and Forecast | |||
| Regulatory Framework | |||
| List of Key Players | |||
| Logistics and Infrastructure | |||
| Turkey | Production Analysis (Production Volume) | ||
| Consumption Analysis (Consumption Value and Volume) | |||
| Import Market Analysis (Import Value, Volume, and Key Supplying Markets) | |||
| Export Market Analysis (Export Value, Volume, and Key Destination Markets) | |||
| Wholesale Price Trend Analysis and Forecast | |||
| Regulatory Framework | |||
| List of Key Players | |||
| Logistics and Infrastructure | |||
| Africa | Egypt | Production Analysis (Production Volume) | |
| Consumption Analysis (Consumption Value and Volume) | |||
| Import Market Analysis (Import Value, Volume, and Key Supplying Markets) | |||
| Export Market Analysis (Export Value, Volume, and Key Destination Markets) | |||
| Wholesale Price Trend Analysis and Forecast | |||
| Regulatory Framework | |||
| List of Key Players | |||
| Logistics and Infrastructure | |||
| Nigeria | Production Analysis (Production Volume) | ||
| Consumption Analysis (Consumption Value and Volume) | |||
| Import Market Analysis (Import Value, Volume, and Key Supplying Markets) | |||
| Export Market Analysis (Export Value, Volume, and Key Destination Markets) | |||
| Wholesale Price Trend Analysis and Forecast | |||
| Regulatory Framework | |||
| List of Key Players | |||
| Logistics and Infrastructure | |||


Key Questions Answered in the Report
How large is the freshwater fish market in 2026?
The freshwater fish market size stood at USD 211.53 billion in 2026 and is forecast to reach USD 247.67 billion by 2031.
Which species lead global freshwater fish market?
Carps remain the anchor with 44.50% of 2025 revenue, while tilapia is the fastest-growing species with a projected 6.90% CAGR through 2031.
Why is Asia-Pacific so dominant in freshwater fish supply?
Subsidies, cheap labor, and established pond networks in China, India, and Indonesia give Asia-Pacific 70.80% of global consumption value and maintain cost leadership.
What role do sustainability certifications play in market access?
Certifications such as Aquaculture Stewardship Council and Best Aquaculture Practices are now prerequisites for shelf space in European and North American retailers, driving investment toward compliant facilities.
How are feed costs affecting producer margins?
Feed accounts for up to 60% of farming expenses, and recent volatility in soy, corn, and fishmeal prices has squeezed small producers, prompting a shift toward insect and algae proteins.
Are plant-based fish substitutes a serious threat?
Volumes are still low, but institutional trials in North America and Europe are expanding. If alternative proteins reach price parity with frozen tilapia, they could dampen demand in food-service channels.
Page last updated on:


