Tuna Fish Market Size and Share
Tuna Fish Market Analysis by Mordor Intelligence
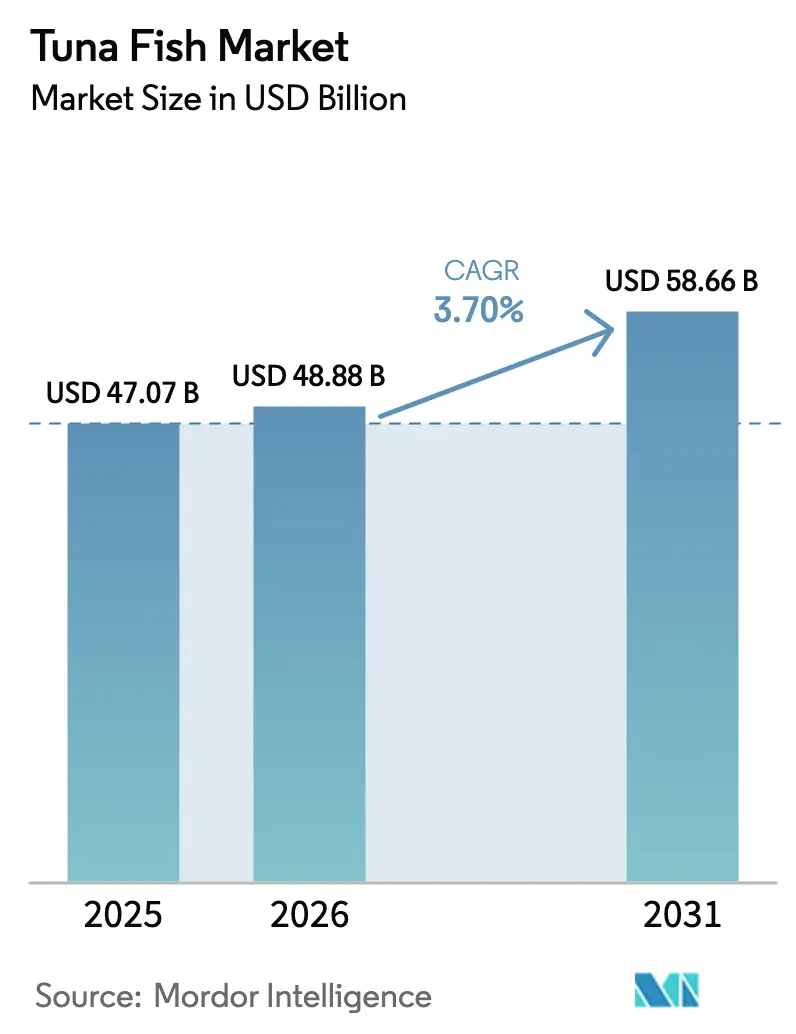
The tuna fish market size was valued at USD 47.07 billion in 2025 and estimated to grow from USD 48.88 billion in 2026 to reach USD 58.66 billion by 2031, at a CAGR of 3.7% during the forecast period (2026-2031). Growing sushi-grade demand, recovering bluefin quotas, and the commercialization of closed-cycle hatchery technology underpin this expansion. Asia-Pacific remains the volume and value anchor, yet the Middle East now delivers the fastest growth as Turkey and the United Arab Emirates scale offshore cages. Mandatory electronic traceability in the European Union and the United States is concentrating volumes with certified operators, while retail Scope-3 carbon targets accelerate investment in low-footprint land-based systems. Competitive focus is shifting from capture-based ranching to full-cycle aquaculture, which removes wild-juvenile reliance and stabilizes input costs.
Key Report Takeaways
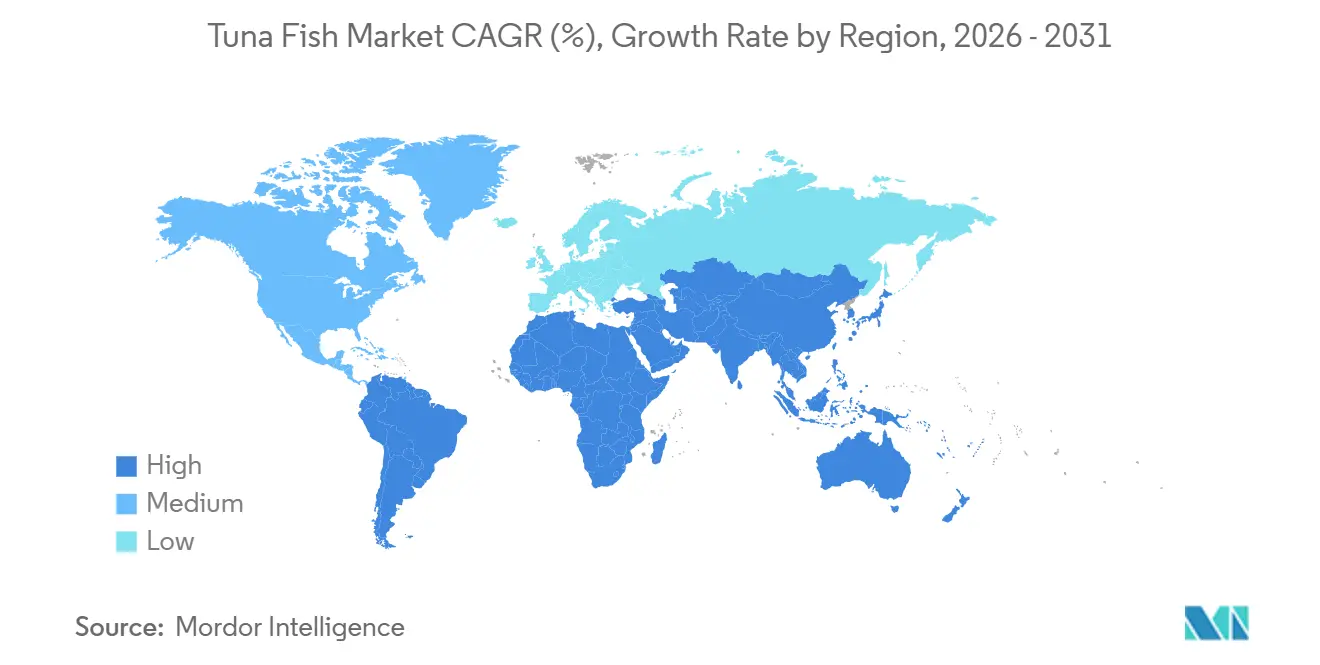
- By geography, the Asia-Pacific contributed 43.0% of the tuna fish market size in 2025, and the Middle East is projected to grow the fastest at a 7.6% CAGR to 2031.
Note: Market size and forecast figures in this report are generated using Mordor Intelligence’s proprietary estimation framework, updated with the latest available data and insights as of January 2026.
Global Tuna Fish Market Trends and Insights
Drivers Impact Analysis*
| Driver | (~) % Impact on CAGR Forecast | Geographic Relevance | Impact Timeline |
|---|---|---|---|
| Recovery of bluefin quotas post-stock-rebuilding | +1.2% | Europe, Asia-Pacific, North America | Medium term (2-4 years) |
| Rising global demand for sushi-grade protein | +1.8% | Global, with concentration in Asia-Pacific, North America, Europe | Short term (≤ 2 years) |
| Commercialization of closed-cycle hatchery technology | +1.5% | Asia-Pacific, Europe, Oceania | Long term (≥ 4 years) |
| Mandatory e-BCD (Electronic Bluefin Catch Document) and e-CDS (Electronic Catch Documentation Scheme) Traceability in Major Importing Blocs | +1.0% | Europe, North America, with spillover to Asia-Pacific exporters | Medium term (2-4 years) |
| Surrogate micro-tuna broodstock shortening generation time | +0.6% | Asia-Pacific, Europe | Long term (≥ 4 years) |
| Retail Scope-3 carbon targets favoring low-footprint seafood | +0.7% | Europe, North America | Medium term (2-4 years) |
| Source: Mordor Intelligence | |||
Recovery of Bluefin Quotas Post-Stock-Rebuilding
Pacific bluefin biomass climbed to 23.2% of unfished levels in 2024, enabling an 8% increase in ranching capacity across Japan, Mexico, and the United States through 2027[1]Source: National Oceanic and Atmospheric Administration Fisheries, “Pacific Bluefin Tuna Stock Assessment,” noaa.gov. In the Atlantic, the International Commission for the Conservation of Atlantic Tunas (ICCAT) lifted European Union bluefin allocations by 17% in November 2025, releasing an extra 2,800 metric tons that Spanish and Maltese operators quickly pre-sold to Japanese trading houses at fixed premiums. Vertically integrated firms that own fishing vessels and cages capture value at every stage, whereas smaller ranchers remain price-takers in the spot fingerling market. Electronic catch documentation now acts as a compliance moat, consolidating certified operators and stabilizing fingerling prices, which had previously required costly hedging strategies.
Rising Global Demand for Sushi-Grade Protein
Japan’s first tuna auction of 2024 logged a winning bid of JPY 114 million (USD 760,000) for a 238-kilogram bluefin, signaling durable premium pricing. Hotel, restaurant, and catering recovery lifted sushi-grade tuna use by 14% year-over-year in North America and Europe during 2024 as chains such as Nobu secured long-term supply contracts. Retail penetration advanced too, with German supermarkets launching pre-portioned sashimi certified under the Marine Stewardship Council. Farmed supply offers year-round availability and stable fat content, reducing menu-planning risk and insulating gross margins during inflationary stretches.
Commercialization of Closed-Cycle Hatchery Technology
Spain's Instituto Español de Oceanografía achieved the first successful closed-cycle bluefin tuna spawning in captivity at its Mazarrón facility in July 2023, the first closed-cycle bluefin success in Europe. Kindai University now licenses its protocols across Asia-Pacific, while Australia’s Clean Seas sourced 100% of 2024 fingerlings from its own hatchery. Eliminating wild juveniles lifts biosecurity, aligns stocking with demand, and paves the way for selective breeding that improves feed efficiency. Capital intensity is high with USD 15 million for a 500,000-fry facility, but the barrier supports early movers and deters low-cost entrants.
Mandatory e-BCD (Electronic Bluefin Catch Document) and e-CDS (Electronic Catch Documentation Scheme) Traceability in Major Importing Blocs
European Union (EU) Regulation 2023/2833 has required electronic Bluefin Catch Documents since January 2024, and the CATCH database will automate cross-border checks from 2026[2]Source: Publications Office of the European Union "Regulation (EU) 2023/2833 on Electronic Catch Documentation." eur-lex.europa.eu. The United States Seafood Import Monitoring Program added similar obligations, lifting compliance costs by USD 0.08 per kilogram[3]Source: National Oceanic and Atmospheric Administration Fisheries, “Pacific Bluefin Tuna Stock Assessment,” noaa.gov. Certified operators amortize these systems across volume, whereas spot-market ranchers incur expenses shipment by shipment. Retailers now embed e-BCD compliance into contracts, turning regulation into a market-access prerequisite. Together, these traceability mandates are accelerating market consolidation toward large, certified operators while squeezing out non-compliant ranchers, thereby reshaping the tuna fish market toward fewer, more transparent, and higher-value supply chains.
Restraints Impact Analysis*
| Restraint | (~) % Impact on CAGR Forecast | Geographic Relevance | Impact Timeline |
|---|---|---|---|
| Extremely High Fish In Fish Out (FIFO) Ratios and Forage-Fish Dependence | -1.4% | Global, acute in Asia-Pacific and Mediterranean | Short term (≤ 2 years) |
| Regional Fisheries Management Organization (RFMO) caps on capture-based juvenile sourcing | -1.1% | Asia-Pacific, Mediterranean, North America | Medium term (2-4 years) |
| Intensified antibiotic-residue surveillance at borders | -0.8% | Asia-Pacific exporters to Europe and North America | Short term (≤ 2 years) |
| Rising offshore-cage insurance costs from severe storms | -0.6% | Asia-Pacific, Middle East | Medium term (2-4 years) |
| Source: Mordor Intelligence | |||
Extremely High Fish In Fish Out (FIFO) Ratios and Forage-Fish Dependence
Tuna require 15 to 20 kilograms of forage fish to gain 1 kilogram, the worst input ratio in aquaculture. Anchovy and sardine prices jumped 22% in 2024 after El Niño disrupted Peruvian and Chilean stocks, raising feed cost share to as high as 65% of operating expenses. Substituting lower-quality fishmeal dulls flesh color and fat content, jeopardizing sashimi premiums. The EU Farm to Fork Strategy proposes capping fishmeal inclusion at 30% by 2027, a ceiling that tuna cannot meet without novel protein inputs. Margin compression hinders reinvestment in technology that could improve feed efficiency.
Intensified Antibiotic-Residue Surveillance at Borders
United States Food and Drug Administration (FDA) and European Union border inspections rejected significant imported tuna shipments in 2024 for detectable florfenicol residues, as zero-tolerance policies tightened in response to antimicrobial-resistance concerns[4]Source: United States Food and Drug Administration, “Import Alert on Aquaculture Products,” fda.gov. Rejections incur demurrage, cold storage, and destruction fees that can exceed shipment value, bankrupting smaller exporters. EU Regulation 2019/6 demands documented withdrawal periods, lengthening grow-out cycles, and raising working capital needs. Ranchers lacking on-site veterinary staff struggle to comply, diverting uncertified volumes into lower-margin canned outlets.
*Our forecasts treat driver/restraint impacts as directional, not additive. The impact forecasts reflect baseline growth, mix effects, and variable interactions.
Geography Analysis
Asia-Pacific's 43.0% share in 2025 positions the region as the market's gravitational center, with Japan's sashimi culture, China's urbanization, and Indonesia's ranching infrastructure. Thailand plays a dual role as a leading global export hub, while Japan stands as the largest high-value consumer market for fresh sashimi-grade tuna. Regional growth is further supported by Indonesia's significant raw material production and the rising middle class in China and Southeast Asia, which is driving demand for convenient, high-protein diets. To ensure a stable future supply, key players such as Dongwon Industries and Maruha Nichiro are investing in full-cycle aquaculture and blockchain traceability to comply with strict international sustainability standards.
The Middle East is projected to rise fastest at 7.6% CAGR as the UAE leverages re-export logistics. Saudi Arabia’s Vision 2030 pumps USD 500 million into cages, though warm-water stress and hatchery deficits temper near-term output. Qatar and Oman test pilot projects with Spanish and Australian know-how. In Europe, Spain and Malta maintain quota advantages, and EU e-BCD rules consolidate certified players. French and Italian restaurant growth bolsters demand, and UK supermarkets add carbon labels that pressure offshore operators to adopt renewable energy.
North America’s tuna consumption is driven by strong sushi demand in major United States coastal cities and Canadian metropolitan markets, though growth is constrained by strict environmental permitting and public opposition to near-shore aquaculture. In South America, demand is led by Brazil’s expanding sushi culture and Argentina’s niche premium seafood segment, but infrastructure gaps and purchasing-power limits restrict wider penetration. Chile’s pilot bluefin ranches target both domestic and Asian markets but face biological constraints that reduce efficiency compared with Mediterranean producers. Africa’s tuna consumption is largely concentrated in canned and processed products, with only limited demand for fresh sashimi outside a few South African urban markets. South Africa is experimenting with bluefin ranching aimed at Asian premium buyers, but technical constraints mean producers still depend heavily on wild juveniles.


Competitive Landscape
The tuna fish market consists of a select group of multinational conglomerates engaged in the global supply chain, encompassing activities from fishing fleets to retail branding. Japanese incumbents Maruha Nichiro and Nippon Suisan anchor production by pairing Kindai-sourced fry with privileged access to Toyosu auctions, a channel that locks in price premiums. In the Mediterranean, Spain’s Ricardo Fuentes and Malta’s AJD Tuna leverage ICCAT quota rights and multi-year fattening cycles to dominate bluefin exports bound for Tokyo and Dubai. Together, these vertically integrated firms capture value across catching, grow-out, and processing, squeezing spot-market ranchers that rely on costly wild juveniles.
Technology investment is emerging as the main competitive wedge. Australia’s Clean Seas now sources 100% of its fry from an in-house hatchery and runs AI-driven feeding programs that cut waste by 12%, a mix that helps the company meet Scope-3 carbon thresholds demanded by European retailers. Spain’s Instituto Español de Oceanografía holds patents for closed-cycle spawning and has begun licensing them to commercial farms, positioning the country as an intellectual-property hub for bluefin genetics.
Regional newcomers are exploiting white-space opportunities that incumbents cannot fully address. Turkish and Emirati operators, backed by sovereign-wealth funds, are adding deep-water cages in the Aegean and Gulf that supply fast-growing restaurant markets and enjoy tariff-free access to the European Union. South Korea’s Dongwon and Germany’s Next Tuna are trialing floating recirculating systems that cut land costs while hitting carbon-footprint targets set by Marine Stewardship Council updates. Rising storm-insurance premiums in typhoon belts are steering capital toward these temperate and land-based projects, widening the cost gap between well-capitalized innovators and smaller ranchers exposed to extreme-weather risk. Competitive dynamics therefore hinge on access to quota, mastery of hatchery science and the ability to finance climate-resilient infrastructure.
Recent Industry Developments
- April 2025: BlueNalu expanded its collaboration with Nomad Foods, aiming to bring cell-cultivated seafood to markets in the UK and EU, riding the wave of growing consumer interest in alternative bluefin toro.
- June 2024: The National Oceanic and Atmospheric Administration (NOAA) confirmed Pacific bluefin biomass recovery, enabling 8% more ranching capacity through 2027.
- January 2024: Japan’s first tuna auction saw a JPY 114 million (USD 760,000) bid for a single 238-kilogram bluefin, confirming ultra-premium demand for tuna fish.


Research Methodology Framework and Report Scope
Market Definitions and Key Coverage
According to Mordor Intelligence, the tuna fish market covers all fresh, frozen, and chilled fillet formats derived from skipjack, yellowfin, bigeye, albacore, and bluefin landings, valued at ex-factory prices before any further processing.
We explicitly exclude canned, tinned, and other processed tuna products from this assessment.
Segmentation Overview
-
Geography
-
North America
-
United States
- Production Analysis (Production Volume)
- Consumption Analysis (Consumption Value and Volume)
- Import Market Analysis (Import Value, Volume, and Key Supplying Markets)
- Export Market Analysis (Export Value, Volume, and Key Destination Markets)
- Wholesale Price Trend Analysis and Forecast
- Regulatory Framework
- List of Key Players
- Logistics and Infrastructure
- Seasonality Analysis
-
Canada
- Production Analysis (Production Volume)
- Consumption Analysis (Consumption Value and Volume)
- Import Market Analysis (Import Value, Volume, and Key Supplying Markets)
- Export Market Analysis (Export Value, Volume, and Key Destination Markets)
- Wholesale Price Trend Analysis and Forecast
- Regulatory Framework
- List of Key Players
- Logistic and Infrastructure
- Seasonality Analysis
-
United States
-
South America
-
Brazil
- Production Analysis (Production Volume)
- Consumption Analysis (Consumption Value and Volume)
- Import Market Analysis (Import Value, Volume, and Key Supplying Markets)
- Export Market Analysis (Export Value, Volume, and Key Destination Markets)
- Wholesale Price Trend Analysis and Forecast
- Regulatory Framework
- List of Key Players
- Logistic and Infrastructure
- Seasonality Analysis
-
Argentina
- Production Analysis (Production Volume)
- Consumption Analysis (Consumption Value and Volume)
- Import Market Analysis (Import Value, Volume, and Key Supplying Markets)
- Export Market Analysis (Export Value, Volume, and Key Destination Markets)
- Wholesale Price Trend Analysis and Forecast
- Regulatory Framework
- List of Key Players
- Logistic and Infrastructure
- Seasonality Analysis
-
Brazil
-
Europe
-
Germany
- Production Analysis (Production Volume)
- Consumption Analysis (Consumption Value and Volume)
- Import Market Analysis (Import Value, Volume, and Key Supplying Markets)
- Export Market Analysis (Export Value, Volume, and Key Destination Markets)
- Wholesale Price Trend Analysis and Forecast
- Regulatory Framework
- List of Key Players
- Logistic and Infrastructure
- Seasonality Analysis
-
United Kingdom
- Production Analysis (Production Volume)
- Consumption Analysis (Consumption Value and Volume)
- Import Market Analysis (Import Value, Volume, and Key Supplying Markets)
- Export Market Analysis (Export Value, Volume, and Key Destination Markets)
- Wholesale Price Trend Analysis and Forecast
- Regulatory Framework
- List of Key Players
- Logistic and Infrastructure
- Seasonality Analysis
-
France
- Production Analysis (Production Volume)
- Consumption Analysis (Consumption Value and Volume)
- Import Market Analysis (Import Value, Volume, and Key Supplying Markets)
- Export Market Analysis (Export Value, Volume, and Key Destination Markets)
- Wholesale Price Trend Analysis and Forecast
- Regulatory Framework
- List of Key Players
- Logistic and Infrastructure
- Seasonality Analysis
-
Spain
- Production Analysis (Production Volume)
- Consumption Analysis (Consumption Value and Volume)
- Import Market Analysis (Import Value, Volume, and Key Supplying Markets)
- Export Market Analysis (Export Value, Volume, and Key Destination Markets)
- Wholesale Price Trend Analysis and Forecast
- Regulatory Framework
- List of Key Players
- Logistic and Infrastructure
- Seasonality Analysis
-
Russia
- Production Analysis (Production Volume)
- Consumption Analysis (Consumption Value and Volume)
- Import Market Analysis (Import Value, Volume, and Key Supplying Markets)
- Export Market Analysis (Export Value, Volume, and Key Destination Markets)
- Wholesale Price Trend Analysis and Forecast
- Regulatory Framework
- List of Key Players
- Logistic and Infrastructure
- Seasonality Analysis
-
Germany
-
Asia-Pacific
-
China
- Production Analysis (Production Volume)
- Consumption Analysis (Consumption Value and Volume)
- Import Market Analysis (Import Value, Volume, and Key Supplying Markets)
- Export Market Analysis (Export Value, Volume, and Key Destination Markets)
- Wholesale Price Trend Analysis and Forecast
- Regulatory Framework
- List of Key Players
- Logistic and Infrastructure
- Seasonality Analysis
-
Japan
- Production Analysis (Production Volume)
- Consumption Analysis (Consumption Value and Volume)
- Import Market Analysis (Import Value, Volume, and Key Supplying Markets)
- Export Market Analysis (Export Value, Volume, and Key Destination Markets)
- Wholesale Price Trend Analysis and Forecast
- Regulatory Framework
- List of Key Players
- Logistic and Infrastructure
- Seasonality Analysis
-
Indonesia
- Production Analysis (Production Volume)
- Consumption Analysis (Consumption Value and Volume)
- Import Market Analysis (Import Value, Volume, and Key Supplying Markets)
- Export Market Analysis (Export Value, Volume, and Key Destination Markets)
- Wholesale Price Trend Analysis and Forecast
- Regulatory Framework
- List of Key Players
- Logistic and Infrastructure
- Seasonality Analysis
-
Philippines
- Production Analysis (Production Volume)
- Consumption Analysis (Consumption Value and Volume)
- Import Market Analysis (Import Value, Volume, and Key Supplying Markets)
- Export Market Analysis (Export Value, Volume, and Key Destination Markets)
- Wholesale Price Trend Analysis and Forecast
- Regulatory Framework
- List of Key Players
- Logistic and Infrastructure
- Seasonality Analysis
-
Papua New Guinea
- Production Analysis (Production Volume)
- Consumption Analysis (Consumption Value and Volume)
- Import Market Analysis (Import Value, Volume, and Key Supplying Markets)
- Export Market Analysis (Export Value, Volume, and Key Destination Markets)
- Wholesale Price Trend Analysis and Forecast
- Regulatory Framework
- List of Key Players
- Logistic and Infrastructure
- Seasonality Analysis
-
China
-
Middle East
-
Turkey
- Production Analysis (Production Volume)
- Consumption Analysis (Consumption Value and Volume)
- Import Market Analysis (Import Value, Volume, and Key Supplying Markets)
- Export Market Analysis (Export Value, Volume, and Key Destination Markets)
- Wholesale Price Trend Analysis and Forecast
- Regulatory Framework
- List of Key Players
- Logistic and Infrastructure
- Seasonality Analysis
-
United Arab Emirates
- Production Analysis (Production Volume)
- Consumption Analysis (Consumption Value and Volume)
- Import Market Analysis (Import Value, Volume, and Key Supplying Markets)
- Export Market Analysis (Export Value, Volume, and Key Destination Markets)
- Wholesale Price Trend Analysis and Forecast
- Regulatory Framework
- List of Key Players
- Logistic and Infrastructure
- Seasonality Analysis
-
Turkey
-
Africa
-
South Africa
- Production Analysis (Production Volume)
- Consumption Analysis (Consumption Value and Volume)
- Import Market Analysis (Import Value, Volume, and Key Supplying Markets)
- Export Market Analysis (Export Value, Volume, and Key Destination Markets)
- Wholesale Price Trend Analysis and Forecast
- Regulatory Framework
- List of Key Players
- Logistic and Infrastructure
- Seasonality Analysis
-
South Africa
-
North America
Detailed Research Methodology and Data Validation
Primary Research
Mordor analysts spoke with Indonesian long-line operators, Japanese wholesalers, EU importer groups, Gulf retail buyers, and bluefin ranching specialists. These conversations verified catch-to-price conversions, clarified skipjack-to-yellowfin substitution, and stress-tested regional growth assumptions.
Desk Research
We began by extracting global catch and aquaculture volumes from FAO FishStat, ICCAT, and the Western & Central Pacific Fisheries Commission. Trade values were mapped through UN Comtrade and ITC Trademap, and consumer price series came from Eurostat and the US Bureau of Labor Statistics. Peer-reviewed journals on biomass resilience and FAO 'State of World Fisheries' reports clarified ecological constraints. Paid tools such as D&B Hoovers checked supplier revenues, while Dow Jones Factiva tracked quota or tariff shifts. The sources above are illustrative, and many additional references fed into data cleansing and triangulation.
Market-Sizing & Forecasting
A top-down model converts verified tonnage to value through weighted landing prices, then is cross-checked with a selective bottom-up roll-up of processor revenues and sampled ASP x volume. Core inputs include MSC-certified quota use, per-capita tuna intake, skipjack share in total landings, farmed bluefin output, exchange-rate shifts, and wholesale price spreads. Multivariate regression with ARIMA overlays captures biomass swings and income elasticity, while scenario analysis adjusts for policy shocks. Data gaps in supplier roll-ups are bridged with regional proxy margins confirmed during expert calls.
Data Validation & Update Cycle
Before sign-off, our team compares model outputs with ISSF stock reports and NOAA import alerts, flags anomalies, and passes the file through tiered peer review. Models refresh every twelve months, with interim tweaks triggered by quota reallocations or sharp price moves, so clients receive the latest calibrated view.
Why Mordor's Tuna Fish Market Baseline Commands Reliability
Published estimates often diverge because firms choose different product mixes, pricing levels, and refresh cadences.
Key gap drivers include rival studies valuing only canned formats, using retail shelf prices, or relying on factory-gate definitions that understate the premium fresh segment. External pages reviewed show USD 44.17 billion for 2025, USD 47.18 billion for 2024, and USD 36.12 billion for 2025.
Benchmark comparison
| Market Size | Anonymized source | Primary gap driver |
|---|---|---|
| USD 48.20 B (2025) | Mordor Intelligence | - |
| USD 44.17 B (2025) | Global Consultancy A | Excludes bluefin and uses three-year-old catch data |
| USD 47.18 B (2024) | Trade Journal B | Values retail shelf sales and lacks currency normalization |
| USD 36.12 B (2025) | Industry Association C | Reports factory-gate value, omitting fresh and frozen segments |
The comparison underscores how our disciplined scope, dual-path modeling, and annual refresh deliver a balanced, transparent baseline that decision-makers can trust.


Key Questions Answered in the Report
How large is the tuna fish market in 2026?
The tuna fish market size is USD 48.88 billion in 2026 and is on course to reach USD 58.66 billion by 2031.
What is the anticipated CAGR for tuna fish market through 2031?
The overall market is projected to grow at a 3.7% CAGR through 2031.
Which region leads tuna fish market production?
Asia-Pacific leads the market with a share of 43.0% of the market size in 2025.
Why are closed-cycle hatcheries important?
They remove dependence on wild juveniles, stabilize supply and satisfy traceability and carbon-footprint requirements.
What regulatory change is shaping the European market?
EU Regulation 2023/2833 mandates electronic catch documents, steering demand toward certified operations.
How are storms affecting offshore farms?
Rising cyclone frequency has pushed insurance premiums up 40%, trimming margins for operators in typhoon belts.
Page last updated on:


