Qatar Courier, Express, And Parcel (CEP) Market Size and Share
Market Overview
| Study Period | 2018 - 2031 |
|---|---|
| Forecast Data Period | 2026 - 2031 |
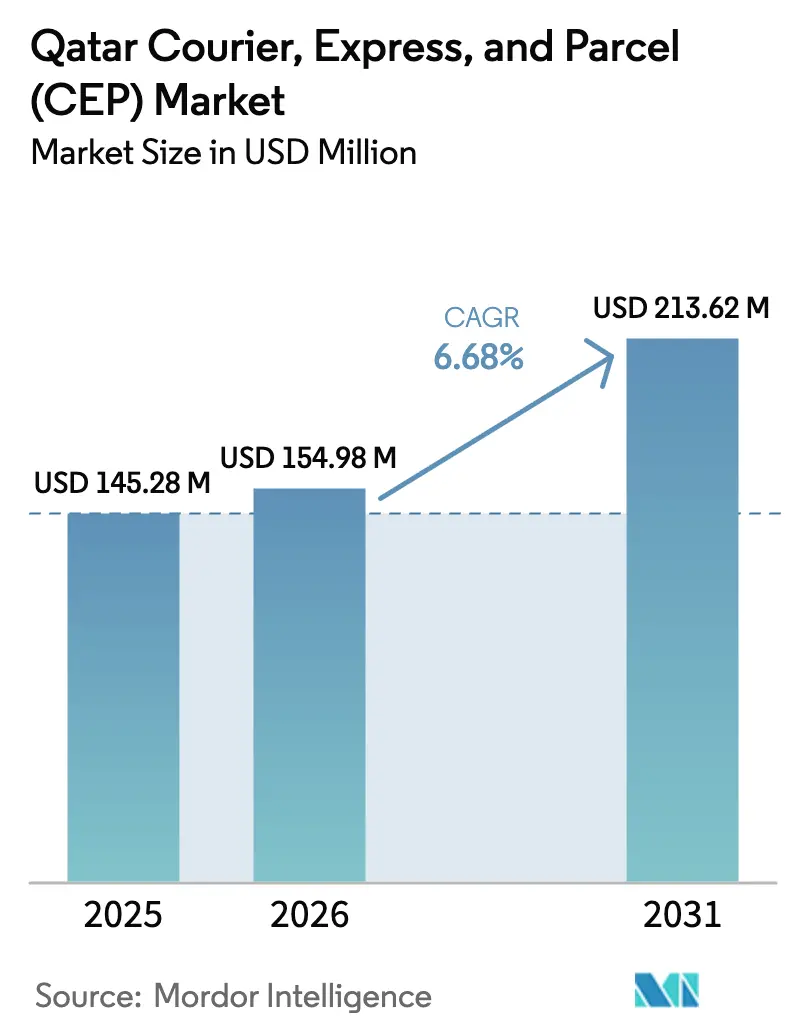
| Base Year Market Size (2025) | USD 145.28 Million |
| Market Size (2026) | USD 154.98 Million |
| Market Size (2031) | USD 213.62 Million |
| Growth Rate (2026 - 2031) | 6.68% CAGR |
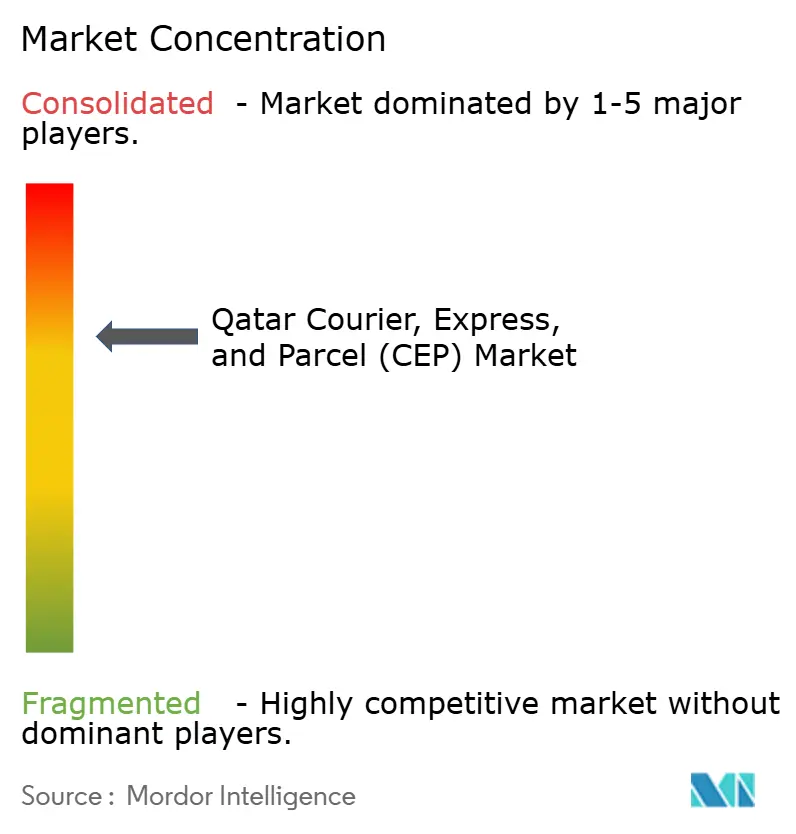
| Market Concentration | Medium |
Major Players *Disclaimer: Major Players sorted in no particular order Image © Mordor Intelligence. Reuse requires attribution under CC BY 4.0. | |
Qatar Courier, Express, And Parcel (CEP) Market Analysis by Mordor Intelligence
The Qatar courier, express, and parcel market size is expected to grow from USD 145.28 million in 2025 to USD 154.98 million in 2026 and is forecast to reach USD 213.62 million by 2031 at 6.68% CAGR over 2026-2031. Driven by Hamad International Airport’s 12% cargo-throughput jump in 2024, government digitization of addresses, free-zone incentives, and rising e-commerce volumes, the market benefits from Doha’s location within an eight-hour flight radius of 70% of the global population. Same-day delivery demand from food-tech and quick-commerce platforms, combined with AI-enabled route optimization, is tilting the competitive focus toward Express services. Strategic partnerships—such as Qatar Airways Cargo’s tie-ups with Cainiao, IAG Cargo, and MASkargo—add international capacity, while electrification pilots in free zones align last-mile fleets with Qatar’s sustainability agenda. Labor-quota tightening under Qatarization Law No. 12 of 2024 and ID-based customs checks temper near-term growth, but authorized-economic-operator programs and digital customs upgrades are gradually easing friction.
Key Report Takeaways
- By destination, domestic services held 63.52% of Qatar courier, express, and parcel market share in 2025; international shipments are projected to expand at a 6.93% CAGR between 2026-2031.
- By speed of delivery, non-express commanded 70.42% of the Qatar courier, express, and parcel market size in 2025, while express is advancing at a 7.43% CAGR between 2026-2031.
- By model, business-to-consumer (B2C) led with 57.84% share in 2025; consumer-to-consumer (C2C) posts the fastest 3.44% CAGR between 2026-2031.
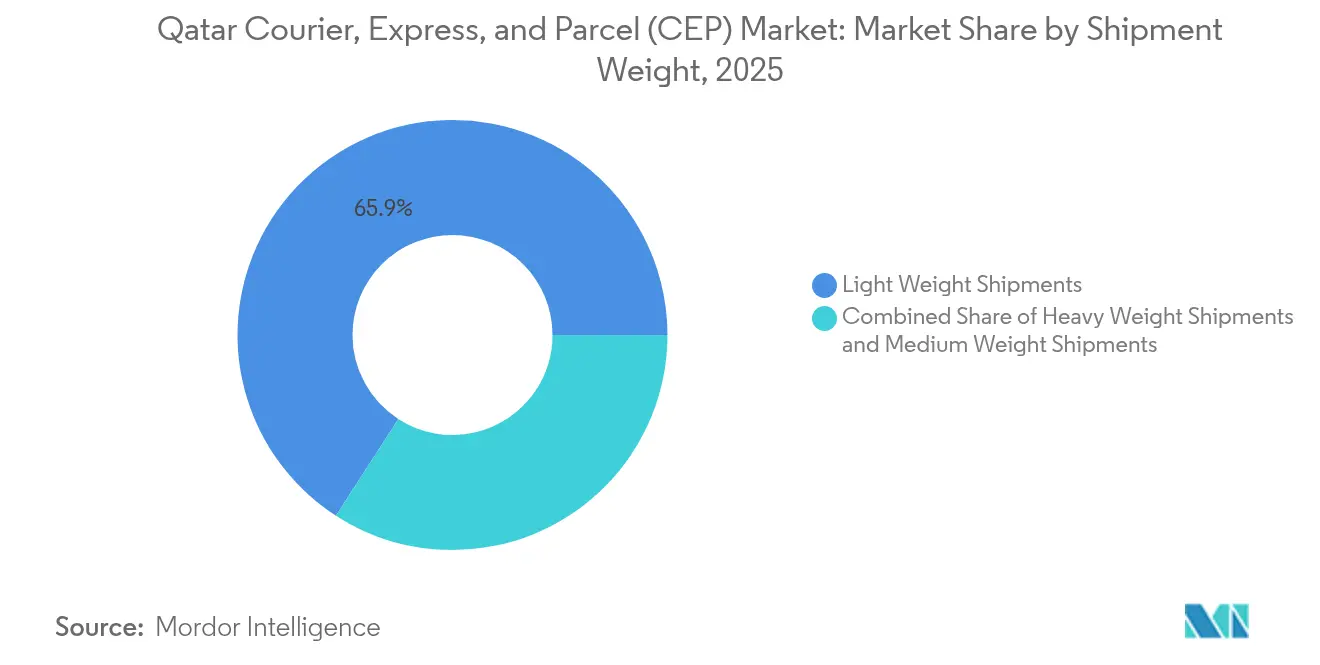
- By shipment weight, light weight parcels accounted for 65.88% share in 2025; heavy weight parcels register a 5.27% CAGR between 2026-2031.
- By mode of transport, air transport captured a 35.32% share in 2025; road transport is growing at a 6.76% CAGR between 2026-2031 on rising last-mile volumes.
- By end user industry, e-commerce retained 42.56% share in 2025; healthcare is projected to climb at 7.02% CAGR between 2026-2031 owing to cold-chain demand.
Note: Market size and forecast figures in this report are generated using Mordor Intelligence’s proprietary estimation framework, updated with the latest available data and insights as of 2026.
Qatar Courier, Express, And Parcel (CEP) Market Trends and Insights
Drivers Impact Analysis*
| Driver | (~) % Impact on CAGR Forecast | Geographic Relevance | Impact Timeline |
|---|---|---|---|
| Rapid B2C e-commerce expansion post-World Cup | +1.8% | National, concentrated in Doha and Lusail | Medium term (2-4 years) |
| Government address-digitisation and QARS completion | +1.5% | National, with early gains in Dafna and West Bay | Short term (≤ 2 years) |
| Same-day delivery demand from food-tech and quick-commerce apps | +1.2% | Urban centers, primarily Doha metropolitan area | Short term (≤ 2 years) |
| Trade-lane repositioning via Hamad Int'l Airport free-zone incentives | +0.9% | National, with spillover to GCC region | Long term (≥ 4 years) |
| AI-driven route-optimization lowering unit delivery costs | +0.7% | National, with early adoption in free zones | Medium term (2-4 years) |
| Electrification incentives for last-mile fleets | +0.6% | National, aligned with Qatar's sustainability goals | Long term (≥ 4 years) |
| Source: Mordor Intelligence | |||


Rapid B2C E-Commerce Expansion Post-World Cup
Regional e-commerce sales are forecast to reach USD 10,957 billion by 2033, fueling parcel-volume growth and intensifying service-level competition. Saudi platform Jahez’s USD 320 million takeover of Qatar’s Snoonu in July 2025 underscores cross-border investor appetite and accelerates consolidation efficiencies. The forthcoming unified GCC tourist visa is expected to raise intra-GCC parcel flows, leveraging Doha’s proximity to USD 8.5 trillion of aggregate GDP markets[1]Invest Qatar, “Discover Opportunities – Why to Invest in Qatar,” invest.qa. Hamad International Airport’s cargo capacity and Qatar Airways Cargo’s e-commerce lanes provide time-definite connectivity to Asia and Europe. As volumes climb, operators invest in automated sorters and micro-fulfillment centers to sustain rapid-delivery promises.
Government Address Digitization and QARS Completion
Nationwide digital-address rollout is replacing legacy PO-Box systems, enabling precise geolocation, narrow delivery windows, and real-time tracking—key prerequisites for same-day fulfillment[2]Gulf Times, “QFZ, Quantiphi Sign Partnership for AI-First Digital Engineering Hub,” gulf-times.com. Courier firms benefit from shorter driver dwell times and reduced failed-delivery costs, while regulators gain end-to-end visibility for customs and security. The Dafna pilot zone serves as a testbed for premium delivery tiers before full national coverage. Integration with smart-city platforms aligns with Qatar National Vision 2030, underpinning predictive-logistics proof-of-concepts. Retailers tap the system’s APIs to embed checkout-level address validation, improving first-attempt success rates and raising customer-experience benchmarks.
Same-Day Delivery Demand from Food-Tech and Quick-Commerce Apps
More than 90% of CEOs in Qatar adopted generative-AI solutions during 2024, enabling dynamic inventory placement and 30-minute delivery windows for groceries, pharma, and electronics. Jahez-Snoonu integration expands dark-store networks across Doha and Lusail, a geography whose urban density supports micro-fulfillment economics. Real-time telemetry from 5G rollouts feeds AI engines that continually refresh bike-courier routes, lowering per-drop costs. Pharmaceutical suppliers leverage these networks for controlled deliveries, supporting the healthcare segment’s 7.11% CAGR (2025-2030). Consumer preferences continue to migrate toward on-demand convenience, locking in premium-priced express tariffs.
Trade-Lane Repositioning via Hamad International Airport Free-Zone Incentives
Hamad International handled 2.6 million tons of cargo in 2024, a 12% rise that reflects trade diversions triggered by Red Sea disruptions. The 4 km² Ras Bufontas Airport Free Zone offers 20-year tax holidays and 100% foreign ownership, attracting integrators seeking a GCC consolidation node. Quantiphi’s AI-sorting hub, launched in May 2024, pairs Google Cloud analytics with robotics to lift sortation productivity by 25%. Joint-business accords among Qatar Airways Cargo, IAG Cargo, and MASkargo announced in April 2025 unlock pooled capacity and synchronized schedules, giving shippers more lift options during peak e-commerce seasons[3]Qatar Airways, “Qatar Airways Cargo, IAG Cargo and MASkargo Announce Intention to Launch a Global Cargo Joint Business,” qatarairways.com.
Restraints Impact Analysis*
| Restraint | (~) % Impact on CAGR Forecast | Geographic Relevance | Impact Timeline |
|---|---|---|---|
| Stringent ID-based customs clearance on inbound parcels | -0.8% | National, particularly affecting international segments | Short term (≤ 2 years) |
| Limited warehousing land inside Doha core | -0.5% | Doha metropolitan area, with spillover effects | Medium term (2-4 years) |
| High reliance on expatriate riders amid tighter labor quotas | -0.7% | National, with acute impact in urban delivery zones | Medium term (2-4 years) |
| Volatile cross-border air-freight rates linked to LNG cycle | -0.4% | International routes, affecting express premium services | Short term (≤ 2 years) |
| Source: Mordor Intelligence | |||
Stringent ID-Based Customs Clearance on Inbound Parcels
Qatar Customs’ Al Nadeeb platform mandates personal-ID and commodity-code verification for every inbound parcel, extending dwell times relative to regional peers[4]The Peninsula, “Customs Create Safe Environment for All Procedures,” thepeninsulaqatar.com. Multi-agency checks covering Industrial Security and Passports add friction, particularly for low-value e-commerce imports. Duty-exemption approvals for temporary entries require pre-clearance from the Exemptions Directorate, complicating just-in-time inventory. Milaha’s authorized economic operator status shows that compliance investment can cut clearance timelines by 40%, offering a blueprint for other providers. Customs’ own digitization roadmap may ease bottlenecks over the medium term, but near-term capacity planning must account for possible service-level hits.
High Reliance on Expatriate Riders Amid Labor Quotas
Law No. 12 of 2024 caps expatriate riders, yet 94% of the delivery workforce is foreign, pushing operators to upskill and recruit nationals at premium wages. Training subsidies are limited, so carriers redirect capital toward AI-dispatch systems and e-bikes that reduce headcount needs. The Qatar Free Zones Authority’s collaboration with the Autonomous e-Mobility Forum accelerates trials of electric vans and sidewalk robots, signaling regulatory openness to labor-saving tech. Short-term cost spikes are likely, but automation can improve unit economics over the forecast window.
*Our forecasts treat driver/restraint impacts as directional, not additive. The impact forecasts reflect baseline growth, mix effects, and variable interactions.
Segment Analysis
By End User Industry: Healthcare Outpaces Others
E-commerce held a 42.56% share in 2025, yet healthcare parcels will advance at a 7.02% CAGR between 2026-2031, reflecting cold-chain protocols for vaccines and biologics. BFSI depends on secure-document flows aligned with Doha’s status as a financial hub. Manufacturing volumes rise on diversification agendas and SME export programs. Energy, petrochemicals, and government agencies round out demand, securing balanced sector exposure for carriers.
Pharma shippers require GDP-compliant packaging and continuous temperature telemetry, driving investments in passive containers and validated cool-rooms. E-commerce platforms migrate to omnichannel models, holding safety stock in Doha micro-sites to meet two-hour delivery pledges. Banking clients adopt blockchain e-AWBs to safeguard compliance documents, while manufacturers use predictive stocking for MRO spares.


By Destination: International Growth Outpaces Domestic
International shipments are projected to grow at a 6.93% CAGR between 2026-2031, eclipsing domestic expansion, even though domestic held 63.52% of Qatar courier, express, and parcel market share in 2025. Qatar Airways Cargo’s deepening partnership with Cainiao links Doha to China’s fulfillment hubs, reinforcing the network’s Asia-bound lift. Ras Bufontas Free Zone’s cross-docking platforms let integrators recast Doha as a trans-shipment node for GCC and African markets. Unified GCC visa policies and airline stakes in RwandAir and Airlink extend reach into underserved African corridors. Domestic activity benefits from address digitization and compact geography, but cross-border lanes capture higher yields and drive service innovation.
Short-haul e-commerce parcels dominate international volumes; high-value electronics and fashion flow east-west via Doha’s 24-hour-clearance promise. Customs reliability and 20-year tax holidays lure regional HQs, while multi-modal routing through Umm Alhoul Port cushions air-freight volatility. Domestic growth concentrates in Doha and Lusail, where on-demand groceries and pharma anchor last-mile volumes. As the international mix tilts upward, carriers rebalance fleets toward belly-hold capacity and freighters optimized for e-commerce densification.
By Speed of Delivery: Express Demand Accelerates
Express services will climb at a 7.43% CAGR between 2026-2031, narrowing the share gap with Non-Express, which controlled 70.42% of the Qatar courier, express, and parcel market size in 2025. Government address digitization and AI-route optimization reduce last-mile uncertainty, enabling premium pricing for two-hour windows. Healthcare’s 7.02% CAGR between 2026-2031 adds temperature-controlled express lanes for biologics. Non-Express retains relevance for bulk B2B and economy e-commerce tiers, leveraging Umm Alhoul’s 32 km² logistics park for pallet-level consolidation.
Snoonu’s integration with Jahez highlights the express pivot as same-day grocery and pharmacy services expand. Quantiphi’s AI hub cuts sort-to-dispatch times by 25%, shrinking Express' operating costs. Non-Express players deploy hybrid models that upsell same-day upgrades during checkout, preserving base volumes while capturing price-elastic demand for speed.
By Shipment Weight: Light Parcels Lead the Mix
Light parcels accounted for 65.88% of revenues in 2025; heavy-parcel volumes grow at a 5.27% CAGR between 2026-2031 as construction and industrial projects gather pace. E-commerce miniaturization keeps average parcel weight below 3 kg, enabling electric-bike delivery and reducing emissions. Heavy parcels tied to LNG plant upgrades encourage investment in specialized lifting gear and compliance training. Medium parcels benefit from SME exports of value-added foods and fashion.
Fleet planning reflects this mix: operators expand e-bike and small-van assets for urban light-parcel density, while retaining liftgate trucks for industrial consignments. AI-based package-dimensioning tools optimize sort plans, minimizing air-void and cutting per-piece costs. Free-zone warehousing allows SKUs to be clustered by weight class, raising pick-and-pack productivity.
By Mode of Transport: Road Rising Against Air
Air retained a 35.32% share in 2025, yet road transport is set for a 6.76% CAGR between 2026-2031 on tighter urban delivery cycles and GCC road-corridor upgrades. Hamad International’s belly-hold space continues to anchor time-critical exports, but cross-border trucking gains traction for cost-sensitive lanes, especially into Saudi Arabia and the UAE. The Autonomous e-Mobility Forum’s EV pilots in free zones signal a policy push toward electric vans for the last mile.
Maritime options via Umm Alhoul Port’s feeder links provide air-to-sea mode shifts when freight rates spike. Integrators deploy AI dispatch that dynamically weighs speed versus cost, steering volumes between modes. Road corridor reliability improves with GCC customs harmonization, cutting border wait times and bolstering deferred-parcel propositions.
By Model: B2C Dominates but C2C Builds Niche
B2C represented 57.84% of 2025 values, underpinned by robust e-commerce inflows, yet C2C is posting a 3.44% CAGR between 2026-2031 as social-commerce platforms proliferate. Direct-to-consumer brands use Doha-based micro-fulfillment to shorten delivery windows region-wide. B2B demand links to North Field LNG expansion, driving spare-parts logistics. C2C growth spikes during tourist seasons, topping 4 million visitors as peer-to-peer sellers leverage address digitization for doorstep trades.
Operators introduce flat-rate small-packet services with digital-locker pickup to tap C2C economics. B2B lanes adopt subscription-based inventory-replenishment models synced with manufacturers. Higher B2C parcel density sustains drone-delivery pilots, while C2C resilience offers volume smoothing during retail slowdowns.
Geography Analysis
Doha metropolitan area absorbs the lion’s share of parcel traffic, leveraging QARS-enabled home-delivery across 99 zones. Lusail City’s smart-infrastructure backbone hosts pilot autonomous-delivery corridors. Industrial zones—Ras Laffan, Mesaieed, and Al Karaana—inject heavy-parcel flows tied to LNG and petrochemicals. Free zones diversify network risk: Ras Bufontas supports air-side cross-docking, while Umm Alhoul’s 32 sq km handles maritime volumes with direct highway links.
Qatar’s strategic locus within 3,000 km of USD 8.5 trillion GDP markets underpins hub status for east-west trade lanes. Airline stakes in RwandAir and Airlink extend reach into high-growth African e-commerce corridors. Unified GCC visa policy and new Salwa border facilities streamline truck flows to Saudi Arabia. Compact geography shortens last-mile runs, enabling courier fleets to average five delivery rounds per shift, above GCC norms.
Political stability and AA sovereign ratings foster capex inflow; FedEx’s 1,249 m² logistics hub launch in July 2025 exemplifies confidence in Doha’s role as a regional gateway. Regulatory modernization—including WCO-aligned customs codes—improves cross-border predictability. Free-zone rent incentives and power subsidies tilt total-cost economics in Doha’s favor compared with peer hubs such as Dubai South and King Abdullah Economic City.
Competitive Landscape
The Qatar courier, express, and parcel market is moderately consolidated: global integrators such as DHL, FedEx, UPS, and Aramex jostle with local specialists Snoonu and Qatar Post. Generative-AI adoption hit 90% among Qatari CEOs in 2024, amplifying the tech arms race in predictive routing and automated sortation. Qatar Airways Cargo leverages joint-business pacts with IAG Cargo and MASkargo to pool capacity and expand cross-booking options. Jahez’s USD 320 million Snoonu purchase added market clout in same-day groceries, illustrating cross-border consolidation dynamics.
Milaha’s AEO accreditation with customs delivers clearance times up to 40% faster, highlighting compliance as a differentiator. Free-zone incentives—covering up to 40% project costs—lure overseas entrants and spark alliances; FedEx’s new hub in Ras Bufontas exemplifies this magnetism.
EV adoption, supported by the Autonomous e-Mobility Forum collaboration, emerges as the next battleground for cost and carbon leadership. Despite pockets of consolidation, tier-2 domestic couriers retain niche plays in specialty segments such as medical samples and luxury goods, keeping overall rivalry intense.
Qatar Courier, Express, And Parcel (CEP) Industry Leaders
Qatar Post
Aramex
DHL Group
FedEx
United Parcel Service (UPS)
- *Disclaimer: Major Players sorted in no particular order

Recent Industry Developments
- July 2025: FedEx opened a 1,249 m² regional logistics facility inside Qatar Free Zones, integrating warehousing with global network connectivity.
- June 2024: Qatar Airways Cargo and MASkargo signed an MoU for a joint cargo business, aligning schedules between Doha and Kuala Lumpur.
- February 2024: DHL Supply Chain and Saudi Aramco established ASMO, a procurement-and-logistics JV for energy clients across MENA.
- February 2024: UPS purchased two Boeing 747-8 freighters from Qatar Airways, to be inducted in early 2025 for fleet modernization.


Qatar Courier, Express, And Parcel (CEP) Market Report Scope
Domestic, International are covered as segments by Destination. Express, Non-Express are covered as segments by Speed Of Delivery. Business-to-Business (B2B), Business-to-Consumer (B2C), Consumer-to-Consumer (C2C) are covered as segments by Model. Heavy Weight Shipments, Light Weight Shipments, Medium Weight Shipments are covered as segments by Shipment Weight. Air, Road, Others are covered as segments by Mode Of Transport. E-Commerce, Financial Services (BFSI), Healthcare, Manufacturing, Primary Industry, Wholesale and Retail Trade (Offline), Others are covered as segments by End User Industry.| Domestic |
| International |
| Express |
| Non-Express |
| Business-to-Business (B2B) |
| Business-to-Consumer (B2C) |
| Consumer-to-Consumer (C2C) |
| Heavy Weight Shipments |
| Light Weight Shipments |
| Medium Weight Shipments |
| Air |
| Road |
| Others |
| E-Commerce |
| Financial Services (BFSI) |
| Healthcare |
| Manufacturing |
| Primary Industry |
| Wholesale and Retail Trade (Offline) |
| Others |
| Destination | Domestic |
| International | |
| Speed of Delivery | Express |
| Non-Express | |
| Model | Business-to-Business (B2B) |
| Business-to-Consumer (B2C) | |
| Consumer-to-Consumer (C2C) | |
| Shipment Weight | Heavy Weight Shipments |
| Light Weight Shipments | |
| Medium Weight Shipments | |
| Mode of Transport | Air |
| Road | |
| Others | |
| End User Industry | E-Commerce |
| Financial Services (BFSI) | |
| Healthcare | |
| Manufacturing | |
| Primary Industry | |
| Wholesale and Retail Trade (Offline) | |
| Others |


Market Definition
- Courier, Express, and Parcel - The Courier, Express, and Parcel services, often called as CEP Market, refers to the logistics and postal service providers which specialize in moving small goods (parcels/packages). It captures the overall market size (USD) and market volume (number of parcels) of (1) the shipments/parcels/packages which are under 70kgs/ 154lbs weight, (2) Business Customer packages viz. Business-to-Business (B2B) & Business-to-Consumer (B2C) as well as private customer packages (C2C), (3) non-express parcel delivery services (Standard and Deferred) as well as express parcel delivery services (Day-Definite-Express and Time-Definite-Express), (4) domestic as well as international shipments.
- Demographics - To analyse total addressable market demand, population growth & forecasts have been studied and presented in this industry trend. It represents population distribution across categories like gender (male/female), development area (urban/rural), major cities among other key parameters like population density and final consumption expenditure (growth and share % of GDP). This data has been used for assessing the fluctations in demand & consumption expenditure, and the major hotspots (cities) of potential demand.
- Domestic Courier Market - Domestic Courier Market refers to the CEP shipments wherein the origin and destination is within the boundary of the geography studied (country or region as per the scope of report). It captures the market size (USD) and market volume (number of parcels) of (1) the shipments/parcels/packages which are under 70kgs/ 154lbs weight, including light weight shipments, medium weight shipments and heavy weight shipments (2) Business Customer packages viz. Business-to-Business (B2B) & Business-to-Consumer (B2C) as well as private customer packages (C2C), (3) non-express parcel delivery services (Standard and Deferred) as well as express parcel delivery services (Day-Definite-Express and Time-Definite-Express).
- E-Commerce - This end user industry segment captures the external (outsourced) logistics expenditure incurred by the e-tailers, through online sales channel, on Courier, Express, and Parcel (CEP) services. The scope includes (i) the supply chain of a company's online customer orders being fulfilled, (ii) the process of getting a product from the point of manufacturing to the point at which it is delivered to consumers. It involves managing inventory (deferred as well as time critical), shipping, and distribution.
- Export Trends and Import Trends - Overall logistics performance of an economy is positively and significantly (statistically) correlated to its trade performance (exports and imports). Hence, in this industry trend, total value of trade, major commodities/ commodity groups and the major trade partners, for the studied geography (country or region as per the scope of report) have been analysed alongside the impact of major trade/logistics infrastructure investments & regulatory environment.
- Financial Services (BFSI) - This end user industry segment captures the external (outsourced) logistics expenditure incurred by the BFSI players, on Courier, Express, and Parcel (CEP) services. CEP is important to the financial services industry in shipping of confidential documents and files. The establishments in this sector are engaged in (i) financial transactions (that is, transactions involving the creation, liquidation, or change in ownership of financial assets) or in facilitating financial transactions, (ii) financial intermediation, (iii) the pooling of risk by underwriting annuities and insurance, (iv) providing specialized services that facilitate or support financial intermediation, insurance and employee benefit programs, and (v) monetary control - the monetary authorities.
- Fuel Price - Fuel price spikes can cause delays and diruption for logistics service providers (LSPs), while drops in the same can result in higher short-term profitability and increased market rivalry to offer consumers with the best deals. Hence, the fuel price variations have been studied over the review period and presented along with the causes as well as market impacts.
- GDP Distribution by Economic Activity - Nominal Gross Domestic Product and distribution of the same, across major economic sectors in the geography studied (country or region as per scope of the report) have been studied and presented in this industry trend. As GDP is positively related to the profitability and growth of logistics industry, this data has been used in adjunction to the input-output tables/ supply-use tables for analyzing the potential major contributing sectors towards the logistics demand.
- GDP Growth by Economic Activity - Growth of Nominal Gross Domestic Product across major economic sectors, for the geography studied (country or region as per scope of the report) have been presented in this industry trend. This data has been utilized for assessing the growth of logistics demand from all the market end users (economic sectors considered here).
- Healthcare - This end user industry segment captures the external (outsourced) logistics expenditure incurred by the Healthcare players (Hospitals, clinics, mrdical centres) , on Courier, Express, and Parcel (CEP) services. The scope includes CEP services involved in the defrerred as well time critical movement of medical goods & supplies (surgical supplies and instruments, including gloves, masks, syringes, equipment). The establishments in this sector (i) include the ones providing medical care exclusively (ii) deliver services by trained professionals (iii) involve processes, including labor inputs of health practitioners with the requisite expertise (iv) are defined based on the educational degree held by the practitioners included in the industry.
- Inflation - Variations in both Wholesale Price Inflation (YoY change in producer price index) and Consumer Price Inflation have been presented in this industry trend. This data has been used to assess the inflationary environment as it plays a vital role in smooth functioning of the supply chain, directly impacting the logistics operational cost components e.g., pricing of tyres, driver wages & benefits, energy/fuel prices, maintenace costs, toll charges, warehousing rents, custom brokerage, forwarding rates, courier rates etc. hence impacting the overall freight and logistics market.
- Infrastructure - As infrastructure plays a vital role in an economy's logistics performance, variables like length of roads, distribution of road length by surface category (paved v/s unpaved), distribution of road length by road classification (expressways v/s highways v/s other roads), rail length, volume of containers handled by major ports and tonnage handled by major airports have been analysed and presented in this industry trend.
- International Express Service Market - International Express Service Market refers to the CEP shipments wherein the origin or destination is not within the boundary of the geography studied (country or region as per the scope of report). It captures the market size (USD) and market volume (number of parcels) of (1) the shipments/parcels/packages which are under 70kgs/ 154lbs weight, including light weight shipments, medium weight shipments and heavy weight shipments (ii) Inter-Region as well as Intra-Region Shipments
- Key Industry Trends - The report section named "Key Industry Trends" include all the key variables/parameters studied to better analyze the market size estimates and forecasts. All the trends have been presented in the form of data points (time series or latest available data points) along with analysis of the paramter in the form of concise market relevant commentary, for the geography studied (country or region as per the scope of report).
- Key Strategic Moves - The action taken by a company to differentiate from its competitor or used as a general strategy is referred to as a key strategic move (KSM). This includes (1) Agreements (2) Expansions (3) Financial Restructuring (4) Mergers and Acquisitions (5) Partnerships, and (6) Product Innovations. Key players (Logistics Service Providers, LSPs) in the market have been shortlisted, their KSM have been studied and presented in this section.
- Logistics Performance - Logistics Performance and Logistics Costs are the backbone of trade, and influences trade costs, making countries compete globally. Logistics performance is influenced by market wide adopted supply chain management strategies, government services, investments & policies, fuel/ energy costs, inflationary environment etc. Hence, in this industry trend, the logistics performance of the geography studied (country/ region as per the scope of report) has been analysed and presented over the review period.
- Manufacturing - This end user industry segment captures the external (outsourced) logistics expenditure incurred by the Manufacturing industry (including Hi-Tech/Technology) players, on Courier, Express, and Parcel (CEP) services. The end user players considered are the establishments primarily engaged in the chemical, mechanical or physical transformation of materials or substances into new products. Logistics Service Providers (LSPs) play a crucial role in maintaining a smooth flow of raw materials across the supply chain, enabling timely delivery of finished goods to distributors or end customers and storing & supplying the raw materials to clients for just-in-time manufacturing.
- Other End Users - Other end user segment captures the external (outsourced) logistics expenditure incurred by the construction, real estate, educational services, and professional services (administrative, waste management, legal, architectural, engineering, design, consulting, scientific R&D), on Courier, Express, and Parcel (CEP) services. Logistics Service Providers (LSPs) plays a crucial role in the reliable movement of time critical supplies and documents to/from these industries such as transporting any equipment or resources required, shipping confidential documents and files.
- Primary Industry - This end user industry segment captures the external (outsourced) logistics expenditure incurred by the AFF (Agriculture, Fishing, and Forestry) and Extraction indsutry (Oil &Gas, Quarrying and Mining) players, on Courier, Express, and Parcel (CEP) services. The end user players considered are the establishments (i) primarily engaged in growing crops, raising animals, harvesting timber, harvesting fish & other animals from their natural habitats and providing related support activities; (ii) that extract naturally occurring mineral solids, such as coal and ores; liquid minerals, such as crude petroleum; and gases, such as natural gas. Herein, Logistics Service Providers (LSPs) (i) play a crucial role in acquisition, storage, handling, transportation, and distribution activities for the optimal & continuous flow of inputs (seeds, pesticides, fertilizers, equipment, and water) from manufacturers or suppliers to the producers and smooth flow of output (produce, agro-goods) to distributors/ consumers; (ii) cover entire phases from upstream to downstream and play a crucial role in the transportation of machinery, drilling equipments, extracted minerals, crude oil & natural gas and refined/ processed products from one place to another. This includes both termperature controlled and non-temperature controlled logistics, as and when required according to the shelf life of goods being transported or stored.
- Producer Price Inflation - It indicates inflation from viewpoint of the producers viz. the average selling price received for their output over a period of time. Annual change (YoY) of producer price index is reported as wholesale price inflation in the "Inflation" industry trend. As WPI captures dynamic price movements in most comprehensive way, it is widely used by governments, banks, industry, business circles and is deemed important in formulation of trade, fiscal and other economic policies. The data has been used in adjunction to consumer price inflation for better understanding the inflationary environment.
- Segmental Revenue - Segmental Revenue has been triangulated or computed and presented for all the major players in the market. It refers to the courier, express, and parcel (CEP) market specific revenue earned by the company, over the base year of study, in the geography studied (country or region as per the scope of report). It is computed through the study and analysis of major parameters like financials, service portfolio, employee strength, fleet size, investments, number of countries present in, major economies of concern, etc. that have been reported by the company in its annual reports, webpage. For companies having scarce financial disclosures, paid databases like D&B Hoovers, Dow Jones Factiva have been resorted to and verified through industry/expert interactions.
- Transport and Storage Sector GDP - Value and growth of Transport and Storage Sector GDP has a direct relation to the freight and logistics market size. Hence, this variable has been studied and presented over the review period, in value terms (USD) and as share % of total GDP, in this industry trend. The data has been supported by concise and relevant commentary around the investments, developments, and current market scenario.
- Trends in E-Commerce Industry - Enhanced internet connectivity and boom in smartphone penetration, coupled with increasing disposable incomes, has led to a phenomenal growth in the e-commerce market globally. Online shoppers require fast and efficient delivery of their orders leading to an increase in the demand for logistics services especially e-commerce fulfilment services. Hence, the Gross Merchandise Value (GMV), historial and projected growth, breakup of major commodity groups in e-commerce industry for the studied geography (country or region as per scope of the report) have been analysed and presented in this industry trend.
- Trends in Manufacturing Industry - Manufacturing industry involves the transformation of raw materials into finished products, while logistics industry ensures the efficient flow of raw materials to the factory, and the transport of manufactured products to the distributors & consumers. Demand-Supply of both industries are highly cross-linked and critical for a seamless supply chain. Hence, the Gross Value Added (GVA), breakup of GVA into major manufacturing sectors, and growth of manufacturing industry over the review period have been analysed and presented, in this industry trend.
- Wholesale and Retail Trade (Offline) - This end user industry segment captures the external (outsourced) logistics expenditure incurred by the wholesalers and retailers, through offline sales channel, on Courier, Express, and Parcel (CEP) services. The end user players considered are the establishments primarily engaged in wholesaling or retailing merchandise, generally without transformation, and rendering services incidental to the sale of merchandise. Logistics Service Providers (LSPs) plays a crucial role in the reliable movement of supplies to and finished products from production houses to the distributors and finally to the end customer covering activites like material sourcing, transportation, order fulfillment, warehousing & storage, demand forecasting, inventory management etc.
| Keyword | Definition |
|---|---|
| Axle Load | The axle load refers to the total load (weight) bearing on the roadway through wheels connected to a given axle. Across the globe, there are systems in place to ensure axle load monitoring, wherein surpassing the defined limits set by the concerned regulatory authority can lead to penalty/fine. For transportation of goods via road this can be an important determinant of costs as knowledge about the axle load limits can be used to (i) load the vehicle optimally for maximizing profits (ii) avoid exceeding the same and hence the probable fines associated (iii) avoid wear and tear of the vehicle (iv) avoid damage to pavement resulting in noticeable public maintenance and repair costs (v) achieve better turnaround time. |
| Back Haul | Backhaul is the return movement of a transport vehicle from its original destination to its original point of departure, and can include full, partial, or empty truck loads (all or part of the way) depending on the visibility of the local freight ecosystem. In this regard, transportation of empty containers to the point of origin, known as deadheading is also a significant factor, considering the supply/container shortages across the geographies, resulting in cost escalation and under optimized profit potential attainment. Generally, the carriers offer discounts on the backhaul, to secure freight for the trip. |
| Bill of Lading (BOL) | A bill of lading is a legal contract document issued by a carrier to a shipper to acknowledge reception of their cargo, and is evidence for the contract of carriage between the two parties. Broadly it details the (i) type, quantity, and other specifications of the goods being carried (ii) destination, and terms & conditions of the shipment (iii) carrier and drivers with all the necessary information to process the shipment, which can be used for insurance and customs clearance purposes (iv) assurance that the consignment is damage-free and ready to be shipped to the consignee. In this regard, a house bill of lading (HBL) is a document issued by a freight forwarder or a non-vessel operating common carrier (NVOCC) to acknowledge receipt of items for shipment (to a shipper). If shipments from several shippers are involved a master bill of lading (MBL) might be involved which is a consolidated version of the same for all the shipments being taken care of by the carrier (to a common destination) and might be issued by the carrier to the freight forwarder or the shipper (depending on who books the transport). |
| Bunkering | Bunkering is the process of supplying fuel to power the propulsion system of a ship. It includes the logistics of loading and distributing the fuel among available shipboard tanks. In this regard, (i) Bunker fuel is technically any type of fuel oil used aboard ships. It gets its name from the containers on ships and in ports that it is stored in; in the days of steam they were coal bunkers but now they are bunker-fuel tanks, (ii) Bunker refers to the spaces (Tank) on board a vessel to store fuel, (iii) Bunker trader refers to a person dealing in trade of bunker (fuel), (iv) Bunker call is made when a cargo ship anchors or berths in a port to take on bunker oil or supplies, (v) Bunkering service is the supply of a requested quality and quantity of bunkers to a ship. Bunkering is signficant from point of view of freight rates applicable to the shipper as Bunker Contribution (BUC)/ Fuel Adjustment Factor (FAF)/ Bunker Adjustment Factor (BAF) are applied by shipping lines to offset the effect of fluctuations in the cost of bunkers. |
| Cabotage | Transport by a vehicle registered in a country, performed on the national territory of another country. Cabotage law may restrict domestic cargo traffic to be carried in its own nationally registered, and sometimes built and crewed vehicles, though regulations vary across industries/commodity groups/countries and sometimes specify maximum allowable percentage of cabotage that can be serviced by foreign registered fleet. |
| C-commerce | Collaborative commerce (also known as C-commerce), (i) describes electronically enabled business interactions among an enterprise’s internal personnel, business partners and customers throughout a trading community (industry, industry segment, supply chain or supply chain segment); (ii) is the optimization of supply and distribution channels to capitalize on the global economy by using new technology efficiently. Advantages of C-commerce, to detail few include (i) maximization of organization's efficiency and profitability (ii) technology integration with physical channels to allow companies to work together (iii) increased information exchange such as inventory and product specifications, using the web as an intermediary (iv) increased competitiveness by reaching a broader audience. Examples of C-commerce, also known as peer-to-peer commerce, include (i) companies that allow consumers to rent things from each other, or marketplaces, such as Meta (formerly Facebook) Marketplace, that allow the sale of used goods; (ii) DoorDash teamed up with many national brands, such as McDonald’s and Chipotle, to offer fast food delivery, building their business model on c-commerce. They have since expanded their delivery service from restaurants to retailers and even offer 'fleets' of drivers to businesses. |
| Courier | A business/company that delivers packages/parcels/shipments (upto 70 kgs) including quick door to door pickup and delivery service for goods or documents, domestically or internationally, on a commercial contract basis. Example, DHL Group, FedEx, United Parcel Service of America, Inc., USPS, International Distributions Services, J&T Express, SF Express among several others |
| Cross docking | Cross docking is a practice in logistics management that includes unloading incoming delivery vehicles and loading the materials directly into outbound delivery vehicles, omitting traditional warehouse logistical practices and saving time and money. It requires close synchronization of both inbound and outbound movements. It is highly significant in reduction of costs pertaining to warehousing & storage (and the associated Value Added Services). |
| Cross Trade | International transport between two different countries performed by a vehicle registered in a third country. A third country is a country other than the country of loading/embarkation and the country of unloading/disembarkation. Cross Trade law may restrict international cargo traffic to be carried by respective country's registered vehicles, and sometimes built and crewed vehicles, though regulations vary across industries/commodity groups/countries and sometimes specify maximum allowable percentage of cross trade that can be serviced by foreign registered fleet. |
| Customs Clearance | The process of declaring and clearing cargoes through customs. It includes the procedures involved in getting cargo released by Customs through designated formalities such as presenting import license/permit, payment of import duties and other required documentations by the nature of the cargo. In this regard, a customs broker is a person or company licensed by the respective department of the country to act on behalf of freight importers and exporters. |
| Dangerous Goods | Dangerous goods (or hazardous materials or HAZMAT) include flammable liquids/solids, gases (compressed, liquified, dissolved under pressure), corrosives, oxidising substances, explosive substances and articles, substances which on contact with water emit flammable gasses, organic peroxides, toxic substances, infectious substances, radioactive materials, miscellaneous dangerous goods and articles. |
| First mile Delivery | First mile delivery refers to the (i) first stage of the freight/shipment/cargo/courier transportation (ii) the transportation of goods from a merchant’s premises or warehouse to the next fulfillment centre/warehouse/hub from where the goods are forwarded (iii) shipping goods from local distribution centers to stores (For retailers) (iv) transportation of finished goods from a plant or a factory to a distribution center (For manufacturers), (v) pick up of goods from the end-customer’s home or store followed by movement to a warehouse or storage location (movers and packers), (vi) process where goods are picked up from a retailer and then transferred to third-party logistics providers or courier service providers to be delivered to the end-consumer (e-commerce). Once the package reaches the next warehouse or the courier’s hub, it is then sorted and transported further until it reaches the customer’s doorstep. Example, if one chooses UPS as a courier, first-mile delivery will be the product being delivered from manufacturer's/retailer's warehouse to the UPS’s warehouse/ fulfilment centre. |
| Last Mile Delivery | Last mile delivery refers to the very last step of the delivery process when a parcel is moved from a transportation hub (warehouse or a distribution center or fulfillment centre) to its final destination, which usually is a personal residence/retail store/ business, or parcel locker. It accounts for around half of the total cost involved in entire process of first mile, middle mile, and last mile delivery, though it can vary shipment to shipment, based on commodity, business model and similar factors. |
| Milkrun | A Milk Run is a delivery method used to transport mixed loads from various suppliers to one customer, using lean management principles applied to logistics. Instead of each supplier sending a truck every week to meet the needs of one customer, one truck (or vehicle) visits the suppliers to pick up the loads for that customer. This method of transport got its name from the dairy industry practice, where one tanker used to collect milk from several dairy farms for delivery to a milk processing company. A milk run can be a more efficient way to handle logistics but require proper planning. If the route involves products from different companies, there is need for an agreement about cost-sharing and other aspects of the cooperative delivery arrangement. Once the group settles these issues, this delivery method can save time and money for everyone by pooling operation costs and resources. |
| Multi country consolidation | Multi-Country Consolidation (MCC) is a cost-effective solution that consolidates one's cargo from different countries of origin to build Full Container Loads (FCL). MCC is most suitable for companies that import light volumes of goods from multiple countries but want to take advantage of the more economic FCL freight rates. Apart from costing some of the other advantages include (i) flexibility to choose suppliers from a wider range of origin countries without worrying about the logistics to final destination from each origin, (ii) ability to pick the most suitable suppliers from many different countries for one's business operations. The increase in one's sourcing options by MCC provides the kind of flexibility needed in competitive global markets. |
| Q-commerce | Q-commerce, also referred to as quick commerce, is a type of e-commerce where emphasis is on quick deliveries, typically in less than an hour. The companies providing Q-Commerce services might have vertically intergrated model or might be using third party delivery platforms (outsourced logistics). It has advantages like (i) competitve USP, (ii) potential to earn greater profit margins, (iii) better customer experience, (iv) guaranteed availability of products, (v) traceability, and (vi) scaleability. |
| ReverseLogistics | Reverse logistics is a type of supply chain management that moves goods from customers back to the sellers or manufacturers and may involve ciruclar economy principles (3Rs) viz. recycling, reuse (repurposing, reselling), reducing or repairing. In this regard, reverse commerce (or Recommerce) is the selling of previously owned items through physical or online marketplaces/distribution channels to buyers who reuse, recycle or resell them. |


Research Methodology
Mordor Intelligence follows a four-step methodology in all our reports.
- Step-1: Identify Key Variables: In order to build a robust forecasting methodology, the variables and factors identified in Step-1 are tested against available historical market numbers. Through an iterative process, the variables required for market forecast are set and the model is built on the basis of these variables.
- Step-2: Build a Market Model: Market-size estimations for the forecast years are in nominal terms. Inflation is considered to be a part of the pricing, and the average selling price (ASP) is varying throughout the forecast period for each country
- Step-3: Validate and Finalize: In this important step, all market numbers, variables and analyst calls are validated through an extensive network of primary research experts from the market studied. The respondents are selected across levels and functions to generate a holistic picture of the market studied.
- Step-4: Research Outputs: Syndicated Reports, Custom Consulting Assignments, Databases & Subscription Platforms


