Market Overview
| Study Period | 2020 - 2031 |
|---|---|
| Forecast Data Period | 2026 - 2031 |
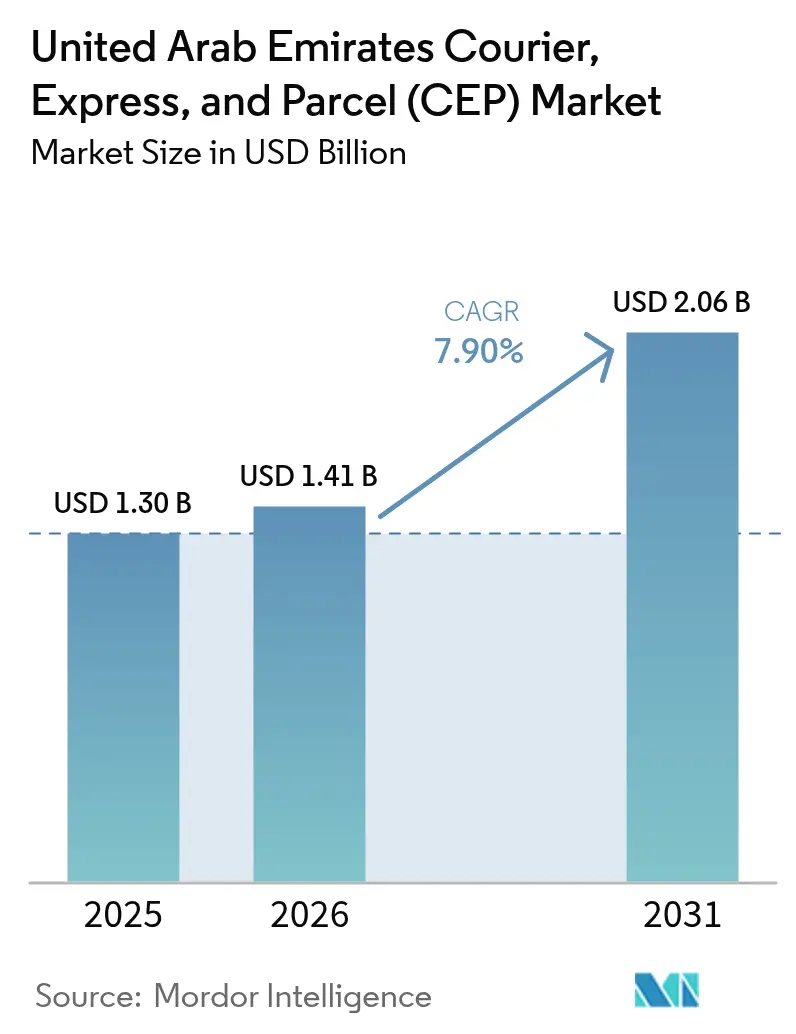
| Base Year Market Size (2025) | USD 1.30 Billion |
| Market Size (2026) | USD 1.41 Billion |
| Market Size (2031) | USD 2.06 Billion |
| Growth Rate (2026 - 2031) | 7.90% CAGR |
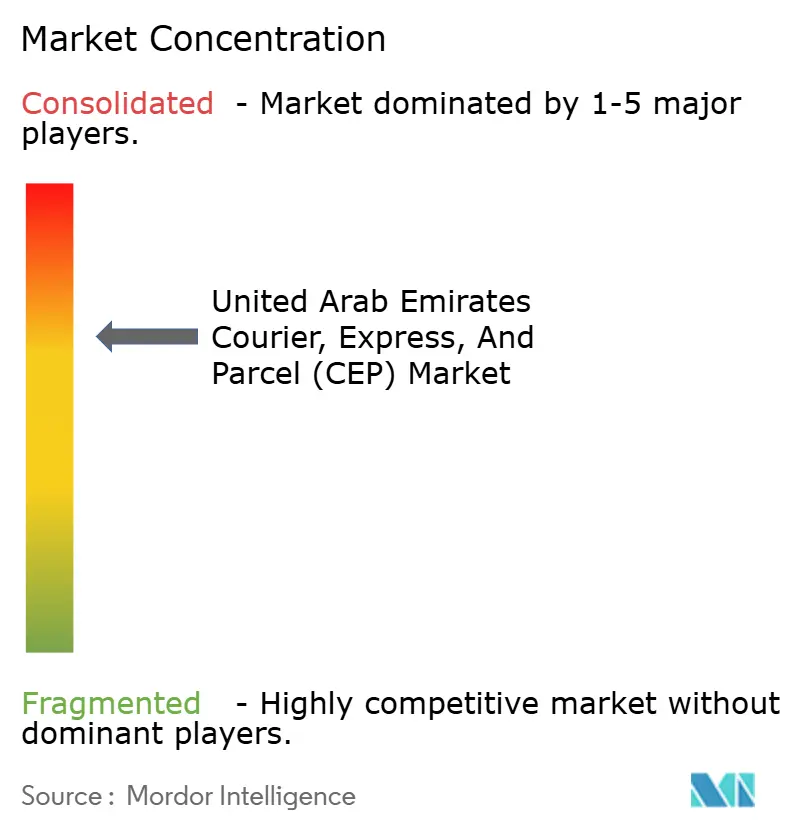
| Market Concentration | Medium |
Major Players
*Disclaimer: Major Players sorted in no particular order Image © Mordor Intelligence. Reuse requires attribution under CC BY 4.0. |
|
United Arab Emirates Courier, Express, And Parcel (CEP) Market Analysis by Mordor Intelligence
The United Arab Emirates courier, express, and parcel (CEP) market size is projected to be USD 1.30 billion in 2025 and USD 1.41 billion in 2026, and reach USD 2.06 billion by 2031, growing at a CAGR of 7.90% from 2026 to 2031.
Persistent e-commerce adoption, large-scale free-zone expansions, and the country’s role as a global aviation hub keep shipment volumes on an upward trajectory. Government incentives for electric vehicles and sustainable aviation fuel are lowering long-run operating costs for service providers. Consolidation moves such as ADQ’s majority acquisition of Aramex reinforce the medium-term outlook, while autonomous delivery pilots signal a technology-driven step-change in service efficiency. High smartphone and broadband penetration sustain a digitally enabled customer base that routinely opts for same-day and next-day delivery offerings.
Key Report Takeaways
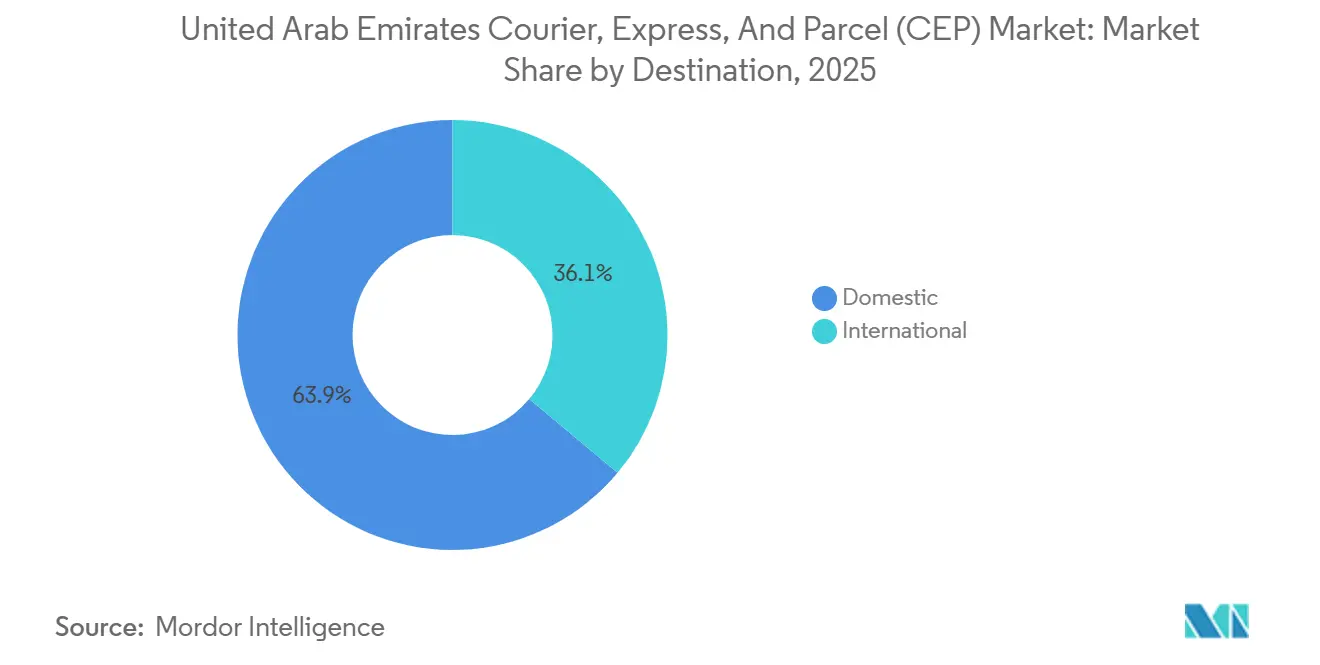
- By destination, international routes grew at a robust 8.22% CAGR from 2026 to 2031, outpacing the growth of domestic deliveries, which still accounted for a dominant 63.93% of market share in 2025.
- By mode of transport, air handled 48.44% of the UAE courier, express, and parcel (CEP) market share in 2025, whereas road is projected to advance at an 8.86% CAGR through 2031.
- By speed of service, express captured 44.29% revenue in 2025, and is forecast to expand at an 8.41% CAGR to 2031.
- By business model, business-to-consumer held 58.84% share in 2025, while consumer-to-consumer is the fastest-growing at 10.19% CAGR over 2026-2031.
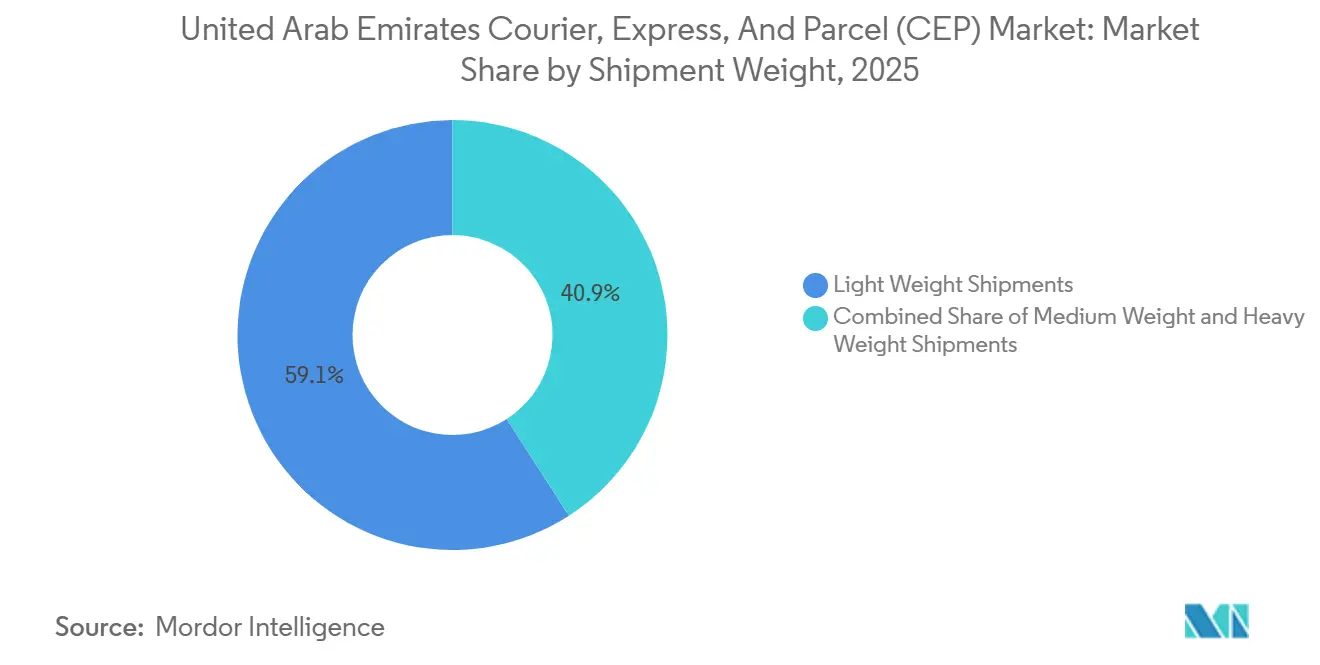
- By shipment weight, light parcels commanded 59.12% of the UAE courier, express, and parcel (CEP) market size in 2025; heavy parcels lead growth at a 9.75% CAGR to 2031.
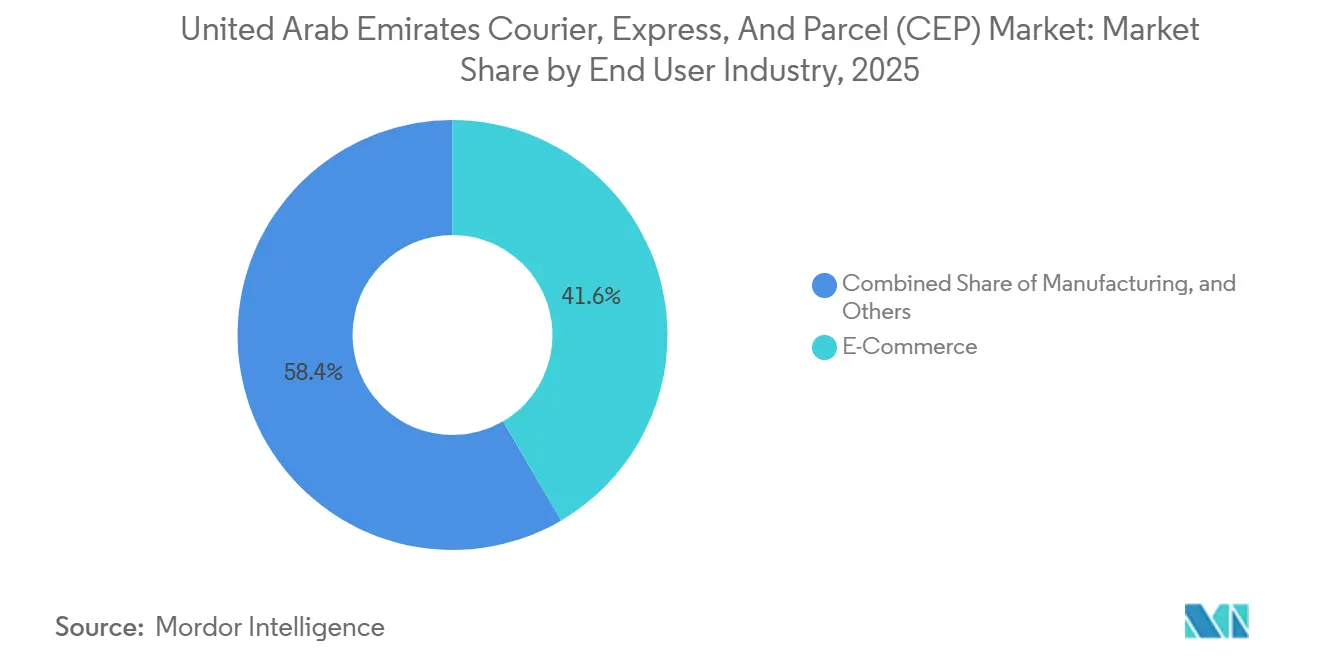
- By end-user industry, e-commerce generated 41.57% of 2025 revenue, but healthcare is poised for the highest 8.43% CAGR between 2026 and 2031.
Note: Market size and forecast figures in this report are generated using Mordor Intelligence’s proprietary estimation framework, updated with the latest available data and insights as of 2026.
United Arab Emirates Courier, Express, And Parcel (CEP) Market Trends and Insights
Drivers Impact Analysis*
| Driver | (~) % Impact on CAGR Forecast | Geographic Relevance | Impact Timeline |
|---|---|---|---|
| Explosive growth in online retail checkout volumes | +2.3% | Nationwide | Medium term (2-4 years) |
| Tariff-light bilateral agreements boosting parcel trade lanes | +1.9% | Nationwide, major Asia corridors | Long term (≥ 4 years) |
| Large-scale airport, road, and free-zone capacity expansions | +1.6% | Dubai and Abu Dhabi | Long term (≥ 4 years) |
| Fintech-enabled one-click payments escalating order frequency | +1.4% | Metro areas | Short term (≤ 2 years) |
| Ultrahigh-speed micro-fulfilment networks in city cores | +1.0% | Dubai and Abu Dhabi | Medium term (2-4 years) |
| Carbon-reduction incentives accelerating EV and SAF uptake | +0.6% | National | Long term (≥ 4 years) |
| Source: Mordor Intelligence | |||
Explosive Growth in Online Retail Checkout Volumes
United Arab Emirates e-commerce merchants employ same-day delivery promises to convert digital footfall into physical parcel flows. Checkout frequency rises as biometric authentication and tokenized card storage remove friction, compressing basket sizes yet multiplying order events. Express couriers report higher stop density but lower average parcel weight, prompting fleet shifts toward compact electric vans that maneuver urban districts efficiently. Retailers with cold-chain needs for cosmetics and pharmaceuticals increasingly bundle value-added conditioning services into contracts with leading providers. Higher drop-density also lifts first-attempt success rates, mitigating cost impacts from rising reverse-logistics activity. The compounded effect is a structural tail-wind for the United Arab Emirates courier, express, and parcel market[1]“Foreign Trade Statistics 2025,” UAE Ministry of Economy, moec.gov.ae.
Tariff-Light Bilateral Agreements Boosting Parcel Trade Lanes
Ten comprehensive economic partnership agreements (CEPAs) in force as of 2026 harmonize customs documentation and reduce duty exposure on cross-border e-commerce consignments. The UAE-India CEPA alone lifted outbound small-parcel exports by 75% within the first full operating year. Predictable clearance times enable logistics companies to publish guaranteed delivery windows to major South Asian cities, catalyzing B2C international order volumes. Free-zone operators extend CEPA advantages by providing bonded storage where duty is postponed until final destination is confirmed. The confluence of legal certainty and physical infrastructure cements the UAE courier, express, and parcel market as a preferred transshipment conduit linking Asian manufacturers to GCC consumers[2]“Digital Dirham Strategy,” Central Bank of the UAE, cbuae.gov.ae.
Large-Scale Airport, Road and Free-Zone Capacity Expansions
The USD 350 million FedEx hub at Dubai World Central automates sortation of 9,000 parcels per hour and allocates 1,000 m² to GDP-certified pharma storage. Jebel Ali Port’s autonomous-trucking pilot with DP World and Einride aims for 1,600 driverless container moves daily, shrinking intra-port transfer times and cutting CO₂ by 14,600 tons annually. Parallel road upgrades under the Falcon Rise program knit Abu Dhabi, Dubai, and Sharjah into a 240-mile electric freight corridor staffed by 2,000 battery-electric trucks. These physical upgrades dovetail with blockchain-enabled customs single windows, compressing total landed costs and enhancing reliability for high-value components and perishables.
Fintech-Enabled One-Click Payments Escalating Order Frequency
The Central Bank’s Digital Dirham pilot invites instant settlement between shoppers and merchants, eliminating the working-capital drag from traditional clearing cycles. ADIB’s installment card with Visa, rolled out in 2024, already directs higher average order values toward online merchants that bundle free express shipping thresholds. Integrated payment-and-delivery subscriptions enhance customer lifetime value for couriers by locking in predictable revenue streams. BNPL platforms such as Tabby collaborate with leading courier houses to offer real-time delivery tracking inside the payment app, tightening the feedback loop between purchase and fulfillment[3]“Traffic Flow Analytics 2025,” Dubai Roads and Transport Authority, rta.ae.
Restraints Impact Analysis*
| Restraint | (~) % Impact on CAGR Forecast | Geographic Relevance | Impact Timeline |
|---|---|---|---|
| Cash-on-delivery dominance driving higher return rates and costs | −1.4% | Nationwide | Short term (≤ 2 years) |
| Tight visa quotas creating a professional driver shortfall | −0.9% | Major emirates | Medium term (2-4 years) |
| Tourist-zone traffic congestion constraining last-mile punctuality | −0.6% | Dubai and Abu Dhabi CBDs | Short term (≤ 2 years) |
| Elevated war-risk insurance premiums inflating air-express tariffs | −0.8% | Regional air lanes | Medium term (2-4 years) |
| Source: Mordor Intelligence | |||
Cash-on-Delivery Dominance Driving Higher Return Rates and Costs
COD packages average a 22% return incidence, versus 7% on prepaid orders, amplifying reverse-logistics miles and cash-handling overheads. Each COD drop adds roughly 18 minutes in payment reconciliation and documentation, diluting driver productivity. Smaller couriers with limited working-capital buffers struggle to carry unreconciled cash, which can reach USD 5,000 per route on high-volume festival days. The biggest operators deploy mobile POS units and instant wallet refunds to shorten the cash cycle, but the structural burden persists until shopper trust migrates decisively toward digital wallets. Government e-dirham rebates on prepaid orders piloted in 2025 show early promise in nudging behavior, trimming COD share by 4 percentage points in participating districts.
Tight Visa Quotas Creating a Professional Driver Shortfall
Transport firms filed 64% more hiring requests in 2025 than in the prior year, stretching the available pool of licensed drivers. On-boarding times lengthened to eight weeks, coinciding with Q4 peak volumes and forcing operators to invoke expensive third-party labor agencies. Rising wage offers up 11% year-on-year feed operating-expense inflation and threaten margin stability for mid-tier players. Fleet-owner consortiums lobby for bonded labor schemes that grant multi-employer flexibility, while larger incumbents accelerate investments in autonomous line-haul pilots to hedge future scarcity[4]"World's largest autonomous trucking network' is under development in Dubai." amp-cnn-com.cdn.ampproject.org.
*Our forecasts treat driver/restraint impacts as directional, not additive. The impact forecasts reflect baseline growth, mix effects, and variable interactions.
Segment Analysis
By End-User Industry: Healthcare Outpaces E-Commerce
Healthcare parcels clock an 8.43% CAGR on top of stringent cold-chain mandates for biologics and high-value implants. FedEx’s GDP-certified chambers maintain +2 °C to +8 °C with redundant power, meeting EU and United States pharmacopeia standards. E-commerce, while owning 41.57% of the United Arab Emirates courier express parcel market share, shifts toward smaller, higher-frequency orders. Payment gateways collaborate with major couriers to embed real-time tracking that improves checkout conversion for temperature-sensitive cosmetics, melding the two segments in practice.
Financial services rely on secure document couriers furnished with tamper-evident satchels and end-to-end audit trails, generating resilient premium yields. Manufacturing and primary industry shipments benefit from evolving free-zone privileges, ensuring raw-material inflows meet just-in-time production needs.


By Destination: International Momentum Outstrips Domestic Maturity
International lanes expanded at an 8.22% CAGR between 2026 and 2031, outpacing domestic deliveries, which nevertheless commanded a 63.93% market share in 2025. The UAE courier, express, and parcel market size for international consignments is forecast to grow significantly by 2031, as CEPAs reduce customs dwell times and eliminate certain tariffs. Emirates Airlines’ dedicated Courier Express belly-hold program connects 140 cities with 24-hour clearance, funneling high-value B2C parcels through Dubai World Central. Domestic activity remains buoyed by omnichannel retail, but rising COD returns and dense urban congestion moderate growth to mid-single digits.
Value-added offerings, installation, try-and-return, and scheduled pick-up shore up domestic margins. International expansion finds its sharpest edge in temperature-controlled pharmaceuticals, where chain-of-custody compliance fetches tariff premiums of 40-60% over general cargo. Free-zone bonded storage amplifies the re-export model, turning the UAE into a mini-hub for onward delivery to Bahrain, Kuwait, and Oman. Providers that balance high-velocity international routes with margin-accretive domestic services achieve the most resilient revenue mix in the UAE courier, express, and parcel market.
By Speed of Delivery: Express Services Accelerate Penetration
Express captured 44.29% of the 2025 market share yet logged the faster 8.41% CAGR to 2031 versus non-Express. Growth stems from metropolitan customer expectations formed by food-delivery apps and same-day grocery pilots. UPS introduced midday sortation at its Dubai hub, enabling second-wave dispatch and extending same-day reach to Ajman and Ras Al Khaimah. Higher tariffs counterbalance the cost of tighter delivery windows and redundant routing.
Non-express retains relevance for bulkier, less time-sensitive B2B cargo but faces price commoditization. AI-driven optimizers cut express route kilometers by up to 12%, pushing operating cost convergence between service tiers. As utilization gaps narrow, customers migrate to express without proportional price hikes, embedding the expectation of speed as a baseline feature in the UAE courier, express, and parcel market.
By Shipment Weight: Heavy Parcels Rise Rapidly
In the UAE courier, express, and parcel market, light parcels hold a significant 59.12% market share, driven by strong demand from the fashion and micro-electronics industries. This dominance highlights the growing consumer preference for smaller, high-value shipments, which aligns with the increasing adoption of e-commerce and direct-to-consumer business models. On the other hand, heavyweight shipments have demonstrated a robust CAGR of 9.75%, reflecting the rising need for bulk transportation solutions across various industries.
The declining average unit volume has contributed to improved stop density, optimizing delivery efficiency. However, this trend also necessitates the implementation of granular tracking systems and advanced sortation technologies to mitigate the risk of mis-shipments and ensure operational accuracy. Furthermore, medium-weight items play a critical role in addressing capacity gaps, thereby stabilizing load factors on inter-emirate trunk routes and enhancing overall network efficiency.
By Mode of Transport: Road Networks Secure Faster Growth
Road lanes grow at 8.86% CAGR, benefitting from 2,000 new electric trucks dispatched under the Falcon Rise grid. Real-time state-of-charge analytics synchronize charging with loading cycles, maintaining 92% fleet availability even during summer heat peaks. Air remains indispensable for express and international cargo, commanding 48.44% market share in 2025 and leveraging two global mega-hubs less than 60 minutes apart. FedEx’s Dubai World Central site integrates direct air-to-road cross-docking, shaving four hours off transit for inbound Asia consignments.
Rail and sea contribute marginally yet hold future upside once the GCC rail network links the UAE to Saudi Arabia. Integrated multimodal booking portals let shippers weigh cost-versus-speed trade-offs in real time, deepening the sophistication of the UAE courier, express, and parcel market.
By Business Model: Consumer-to-Consumer (C2C) Leads Growth Curve
C2C consignments climb at 10.19% CAGR through 2031, underpinned by marketplace platforms and social-commerce storefronts. Average parcel weight hovers at 1.2 kg, favoring locker and pick-up point integration that lowers failed-delivery exposure. Aramex rolled out prepaid label kiosks in 400 convenience stores, capturing micro-sellers who value walk-in flexibility. B2C remains the volume anchor, but its 58.84% market share edges down marginally as C2C absorbs incremental demand.
B2B shipments, including spare parts and professional documents, require specialized chain-of-custody protocols, sustaining steady but slower expansion. Hybrid service bundles that allow the same account dashboard to ship under multiple business models improve stickiness and raise the share-of-wallet couriers enjoy from omnichannel merchants.
Gography Analysis
Dubai generated close to 60% of national courier throughput in 2025, capitalizing on its twin airports and Jebel Ali Port connectivity. The UAE courier, express, and parcel market size attributed to Dubai alone is forecast to contribute a major share by 2031. Yet Abu Dhabi’s industrial corridors spur complementary volumes as the capital channels sovereign wealth into logistics platforms, including its controlling stake in Aramex. Compact intra-emirate distances rarely exceeding 200 km enable same-day cross-delivery without extensive line-haul infrastructure.
Northern emirates such as Sharjah and Ras Al Khaimah witness accelerated uptake following postal-code standardization. UPS leverages Sharjah International Airport for late-night Asia uplifts, offering exporters a cut-off three hours later than Dubai departures. Addressing technology Makani in Dubai and Onwani in Abu Dhabi reduces delivery exceptions by mapping more than 200,000 unique geo-coordinates.
Regional spill-over emerges via the King Fahd Causeway and the proposed GCC railway, positioning the UAE as a staging point for next-day service into eastern Saudi Arabia. 5G coverage exceeding 97% of populated areas fuels IoT sensors that relay cold-chain compliance in real time, enhancing regulatory trust and lifting volumes in pharmaceutical lanes.
Competitive Landscape
The UAE courier, express, and parcel market hosts a balanced mix of global integrators and agile regional specialists. Aramex, DHL, FedEx, and UPS account for an estimated 48% combined revenue, while homegrown Emirates Post Group and rapidly scaling start-ups share the remainder. ADQ’s 2025 acquisition of Aramex injects sovereign capital and signals a tilt toward multi-modal, region-wide service integration. Emirates Airline launched its Courier Express arm to monetize unused belly-hold capacity across a 140-city passenger network.
Technology is the decisive differentiator. Keeta Drone secured the first BVLOS commercial drone permit, opening autonomous last-mile possibilities inside Dubai Silicon Oasis. FedEx pilots AI-driven dynamic rerouting that factors weather, traffic, and customer availability to cut failed first-attempts by 10%. DP World partners with Einride to operate electric, driverless trucks on Jebel Ali Port intra-yard lanes, compressing box-transfer times and providing a template for broader road-freight automation.
Incumbents respond through strategic alliances UPS with Ship24 for cross-border tracking APIs, DHL with Emaar Malls for dedicated in-mall locker banks. Mid-tier carriers niche down into specialty lanes such as high-security valuables or GDP-certified pharma, extracting tariff premiums that offset scale disadvantages. Overall, competition is active but rational, with service innovation outweighing pure price cutting.
United Arab Emirates Courier, Express, And Parcel (CEP) Industry Leaders
-
Aramex
-
DHL Group
-
Emirates Post
-
FedEx
-
United Parcel Service of America, Inc. (UPS)
- *Disclaimer: Major Players sorted in no particular order

Recent Industry Developments
- January 2026: FedEx confirmed the commissioning of additional automated sortation belts at its Dubai World Central hub, increasing hourly parcel capacity to 11,000.
- July 2025: ADQ completed its majority stake purchase of Aramex, earmarking capital for network expansions into East Africa.
- May 2025: Emirates unveiled the first branded wide-body aircraft for its Courier Express service targeting B2B and B2C shippers.
- April 2025: Emirates SkyCargo committed to trialling hydrogen-powered trucks by 2026, highlighting its decarbonization roadmap.


United Arab Emirates Courier, Express, And Parcel (CEP) Market Report Scope
By Destination
| Domestic |
| International |
By Speed of Delivery
| Express |
| Non-Express |
By Business Model
| Business-to-Business (B2B) |
| Business-to-Consumer (B2C) |
| Consumer-to-Consumer (C2C) |
By Shipment Weight
| Heavy Weight Shipments |
| Light Weight Shipments |
| Medium Weight Shipments |
By Mode of Transport
| Air |
| Road |
| Others |
By End User Industry
| E-Commerce |
| Financial Services (BFSI) |
| Healthcare |
| Manufacturing |
| Primary Industry |
| Wholesale and Retail Trade (Offline) |
| Others |
| By Destination | Domestic |
| International | |
| By Speed of Delivery | Express |
| Non-Express | |
| By Business Model | Business-to-Business (B2B) |
| Business-to-Consumer (B2C) | |
| Consumer-to-Consumer (C2C) | |
| By Shipment Weight | Heavy Weight Shipments |
| Light Weight Shipments | |
| Medium Weight Shipments | |
| By Mode of Transport | Air |
| Road | |
| Others | |
| By End User Industry | E-Commerce |
| Financial Services (BFSI) | |
| Healthcare | |
| Manufacturing | |
| Primary Industry | |
| Wholesale and Retail Trade (Offline) | |
| Others |


Market Definition
- Courier, Express, and Parcel - The Courier, Express, and Parcel services, often called as CEP Market, refers to the logistics and postal service providers which specialize in moving small goods (parcels/packages). It captures the overall market size (USD) and market volume (number of parcels) of (1) the shipments/parcels/packages which are under 70kgs/ 154lbs weight, (2) Business Customer packages viz. Business-to-Business (B2B) & Business-to-Consumer (B2C) as well as private customer packages (C2C), (3) non-express parcel delivery services (Standard and Deferred) as well as express parcel delivery services (Day-Definite-Express and Time-Definite-Express), (4) domestic as well as international shipments.
- Demographics - To analyse total addressable market demand, population growth & forecasts have been studied and presented in this industry trend. It represents population distribution across categories like gender (male/female), development area (urban/rural), major cities among other key parameters like population density and final consumption expenditure (growth and share % of GDP). This data has been used for assessing the fluctations in demand & consumption expenditure, and the major hotspots (cities) of potential demand.
- Domestic Courier Market - Domestic Courier Market refers to the CEP shipments wherein the origin and destination is within the boundary of the geography studied (country or region as per the scope of report). It captures the market size (USD) and market volume (number of parcels) of (1) the shipments/parcels/packages which are under 70kgs/ 154lbs weight, including light weight shipments, medium weight shipments and heavy weight shipments (2) Business Customer packages viz. Business-to-Business (B2B) & Business-to-Consumer (B2C) as well as private customer packages (C2C), (3) non-express parcel delivery services (Standard and Deferred) as well as express parcel delivery services (Day-Definite-Express and Time-Definite-Express).
- E-Commerce - This end user industry segment captures the external (outsourced) logistics expenditure incurred by the e-tailers, through online sales channel, on Courier, Express, and Parcel (CEP) services. The scope includes (i) the supply chain of a company's online customer orders being fulfilled, (ii) the process of getting a product from the point of manufacturing to the point at which it is delivered to consumers. It involves managing inventory (deferred as well as time critical), shipping, and distribution.
- Export Trends and Import Trends - Overall logistics performance of an economy is positively and significantly (statistically) correlated to its trade performance (exports and imports). Hence, in this industry trend, total value of trade, major commodities/ commodity groups and the major trade partners, for the studied geography (country or region as per the scope of report) have been analysed alongside the impact of major trade/logistics infrastructure investments & regulatory environment.
- Financial Services (BFSI) - This end user industry segment captures the external (outsourced) logistics expenditure incurred by the BFSI players, on Courier, Express, and Parcel (CEP) services. CEP is important to the financial services industry in shipping of confidential documents and files. The establishments in this sector are engaged in (i) financial transactions (that is, transactions involving the creation, liquidation, or change in ownership of financial assets) or in facilitating financial transactions, (ii) financial intermediation, (iii) the pooling of risk by underwriting annuities and insurance, (iv) providing specialized services that facilitate or support financial intermediation, insurance and employee benefit programs, and (v) monetary control - the monetary authorities.
- Fuel Price - Fuel price spikes can cause delays and diruption for logistics service providers (LSPs), while drops in the same can result in higher short-term profitability and increased market rivalry to offer consumers with the best deals. Hence, the fuel price variations have been studied over the review period and presented along with the causes as well as market impacts.
- GDP Distribution by Economic Activity - Nominal Gross Domestic Product and distribution of the same, across major economic sectors in the geography studied (country or region as per scope of the report) have been studied and presented in this industry trend. As GDP is positively related to the profitability and growth of logistics industry, this data has been used in adjunction to the input-output tables/ supply-use tables for analyzing the potential major contributing sectors towards the logistics demand.
- GDP Growth by Economic Activity - Growth of Nominal Gross Domestic Product across major economic sectors, for the geography studied (country or region as per scope of the report) have been presented in this industry trend. This data has been utilized for assessing the growth of logistics demand from all the market end users (economic sectors considered here).
- Healthcare - This end user industry segment captures the external (outsourced) logistics expenditure incurred by the Healthcare players (Hospitals, clinics, mrdical centres) , on Courier, Express, and Parcel (CEP) services. The scope includes CEP services involved in the defrerred as well time critical movement of medical goods & supplies (surgical supplies and instruments, including gloves, masks, syringes, equipment). The establishments in this sector (i) include the ones providing medical care exclusively (ii) deliver services by trained professionals (iii) involve processes, including labor inputs of health practitioners with the requisite expertise (iv) are defined based on the educational degree held by the practitioners included in the industry.
- Inflation - Variations in both Wholesale Price Inflation (YoY change in producer price index) and Consumer Price Inflation have been presented in this industry trend. This data has been used to assess the inflationary environment as it plays a vital role in smooth functioning of the supply chain, directly impacting the logistics operational cost components e.g., pricing of tyres, driver wages & benefits, energy/fuel prices, maintenace costs, toll charges, warehousing rents, custom brokerage, forwarding rates, courier rates etc. hence impacting the overall freight and logistics market.
- Infrastructure - As infrastructure plays a vital role in an economy's logistics performance, variables like length of roads, distribution of road length by surface category (paved v/s unpaved), distribution of road length by road classification (expressways v/s highways v/s other roads), rail length, volume of containers handled by major ports and tonnage handled by major airports have been analysed and presented in this industry trend.
- International Express Service Market - International Express Service Market refers to the CEP shipments wherein the origin or destination is not within the boundary of the geography studied (country or region as per the scope of report). It captures the market size (USD) and market volume (number of parcels) of (1) the shipments/parcels/packages which are under 70kgs/ 154lbs weight, including light weight shipments, medium weight shipments and heavy weight shipments (ii) Inter-Region as well as Intra-Region Shipments
- Key Industry Trends - The report section named "Key Industry Trends" include all the key variables/parameters studied to better analyze the market size estimates and forecasts. All the trends have been presented in the form of data points (time series or latest available data points) along with analysis of the paramter in the form of concise market relevant commentary, for the geography studied (country or region as per the scope of report).
- Key Strategic Moves - The action taken by a company to differentiate from its competitor or used as a general strategy is referred to as a key strategic move (KSM). This includes (1) Agreements (2) Expansions (3) Financial Restructuring (4) Mergers and Acquisitions (5) Partnerships, and (6) Product Innovations. Key players (Logistics Service Providers, LSPs) in the market have been shortlisted, their KSM have been studied and presented in this section.
- Logistics Performance - Logistics Performance and Logistics Costs are the backbone of trade, and influences trade costs, making countries compete globally. Logistics performance is influenced by market wide adopted supply chain management strategies, government services, investments & policies, fuel/ energy costs, inflationary environment etc. Hence, in this industry trend, the logistics performance of the geography studied (country/ region as per the scope of report) has been analysed and presented over the review period.
- Manufacturing - This end user industry segment captures the external (outsourced) logistics expenditure incurred by the Manufacturing industry (including Hi-Tech/Technology) players, on Courier, Express, and Parcel (CEP) services. The end user players considered are the establishments primarily engaged in the chemical, mechanical or physical transformation of materials or substances into new products. Logistics Service Providers (LSPs) play a crucial role in maintaining a smooth flow of raw materials across the supply chain, enabling timely delivery of finished goods to distributors or end customers and storing & supplying the raw materials to clients for just-in-time manufacturing.
- Other End Users - Other end user segment captures the external (outsourced) logistics expenditure incurred by the construction, real estate, educational services, and professional services (administrative, waste management, legal, architectural, engineering, design, consulting, scientific R&D), on Courier, Express, and Parcel (CEP) services. Logistics Service Providers (LSPs) plays a crucial role in the reliable movement of time critical supplies and documents to/from these industries such as transporting any equipment or resources required, shipping confidential documents and files.
- Primary Industry - This end user industry segment captures the external (outsourced) logistics expenditure incurred by the AFF (Agriculture, Fishing, and Forestry) and Extraction indsutry (Oil &Gas, Quarrying and Mining) players, on Courier, Express, and Parcel (CEP) services. The end user players considered are the establishments (i) primarily engaged in growing crops, raising animals, harvesting timber, harvesting fish & other animals from their natural habitats and providing related support activities; (ii) that extract naturally occurring mineral solids, such as coal and ores; liquid minerals, such as crude petroleum; and gases, such as natural gas. Herein, Logistics Service Providers (LSPs) (i) play a crucial role in acquisition, storage, handling, transportation, and distribution activities for the optimal & continuous flow of inputs (seeds, pesticides, fertilizers, equipment, and water) from manufacturers or suppliers to the producers and smooth flow of output (produce, agro-goods) to distributors/ consumers; (ii) cover entire phases from upstream to downstream and play a crucial role in the transportation of machinery, drilling equipments, extracted minerals, crude oil & natural gas and refined/ processed products from one place to another. This includes both termperature controlled and non-temperature controlled logistics, as and when required according to the shelf life of goods being transported or stored.
- Producer Price Inflation - It indicates inflation from viewpoint of the producers viz. the average selling price received for their output over a period of time. Annual change (YoY) of producer price index is reported as wholesale price inflation in the "Inflation" industry trend. As WPI captures dynamic price movements in most comprehensive way, it is widely used by governments, banks, industry, business circles and is deemed important in formulation of trade, fiscal and other economic policies. The data has been used in adjunction to consumer price inflation for better understanding the inflationary environment.
- Segmental Revenue - Segmental Revenue has been triangulated or computed and presented for all the major players in the market. It refers to the courier, express, and parcel (CEP) market specific revenue earned by the company, over the base year of study, in the geography studied (country or region as per the scope of report). It is computed through the study and analysis of major parameters like financials, service portfolio, employee strength, fleet size, investments, number of countries present in, major economies of concern, etc. that have been reported by the company in its annual reports, webpage. For companies having scarce financial disclosures, paid databases like D&B Hoovers, Dow Jones Factiva have been resorted to and verified through industry/expert interactions.
- Transport and Storage Sector GDP - Value and growth of Transport and Storage Sector GDP has a direct relation to the freight and logistics market size. Hence, this variable has been studied and presented over the review period, in value terms (USD) and as share % of total GDP, in this industry trend. The data has been supported by concise and relevant commentary around the investments, developments, and current market scenario.
- Trends in E-Commerce Industry - Enhanced internet connectivity and boom in smartphone penetration, coupled with increasing disposable incomes, has led to a phenomenal growth in the e-commerce market globally. Online shoppers require fast and efficient delivery of their orders leading to an increase in the demand for logistics services especially e-commerce fulfilment services. Hence, the Gross Merchandise Value (GMV), historial and projected growth, breakup of major commodity groups in e-commerce industry for the studied geography (country or region as per scope of the report) have been analysed and presented in this industry trend.
- Trends in Manufacturing Industry - Manufacturing industry involves the transformation of raw materials into finished products, while logistics industry ensures the efficient flow of raw materials to the factory, and the transport of manufactured products to the distributors & consumers. Demand-Supply of both industries are highly cross-linked and critical for a seamless supply chain. Hence, the Gross Value Added (GVA), breakup of GVA into major manufacturing sectors, and growth of manufacturing industry over the review period have been analysed and presented, in this industry trend.
- Wholesale and Retail Trade (Offline) - This end user industry segment captures the external (outsourced) logistics expenditure incurred by the wholesalers and retailers, through offline sales channel, on Courier, Express, and Parcel (CEP) services. The end user players considered are the establishments primarily engaged in wholesaling or retailing merchandise, generally without transformation, and rendering services incidental to the sale of merchandise. Logistics Service Providers (LSPs) plays a crucial role in the reliable movement of supplies to and finished products from production houses to the distributors and finally to the end customer covering activites like material sourcing, transportation, order fulfillment, warehousing & storage, demand forecasting, inventory management etc.
| Keyword | Definition |
|---|---|
| Axle Load | The axle load refers to the total load (weight) bearing on the roadway through wheels connected to a given axle. Across the globe, there are systems in place to ensure axle load monitoring, wherein surpassing the defined limits set by the concerned regulatory authority can lead to penalty/fine. For transportation of goods via road this can be an important determinant of costs as knowledge about the axle load limits can be used to (i) load the vehicle optimally for maximizing profits (ii) avoid exceeding the same and hence the probable fines associated (iii) avoid wear and tear of the vehicle (iv) avoid damage to pavement resulting in noticeable public maintenance and repair costs (v) achieve better turnaround time. |
| Back Haul | Backhaul is the return movement of a transport vehicle from its original destination to its original point of departure, and can include full, partial, or empty truck loads (all or part of the way) depending on the visibility of the local freight ecosystem. In this regard, transportation of empty containers to the point of origin, known as deadheading is also a significant factor, considering the supply/container shortages across the geographies, resulting in cost escalation and under optimized profit potential attainment. Generally, the carriers offer discounts on the backhaul, to secure freight for the trip. |
| Bill of Lading (BOL) | A bill of lading is a legal contract document issued by a carrier to a shipper to acknowledge reception of their cargo, and is evidence for the contract of carriage between the two parties. Broadly it details the (i) type, quantity, and other specifications of the goods being carried (ii) destination, and terms & conditions of the shipment (iii) carrier and drivers with all the necessary information to process the shipment, which can be used for insurance and customs clearance purposes (iv) assurance that the consignment is damage-free and ready to be shipped to the consignee. In this regard, a house bill of lading (HBL) is a document issued by a freight forwarder or a non-vessel operating common carrier (NVOCC) to acknowledge receipt of items for shipment (to a shipper). If shipments from several shippers are involved a master bill of lading (MBL) might be involved which is a consolidated version of the same for all the shipments being taken care of by the carrier (to a common destination) and might be issued by the carrier to the freight forwarder or the shipper (depending on who books the transport). |
| Bunkering | Bunkering is the process of supplying fuel to power the propulsion system of a ship. It includes the logistics of loading and distributing the fuel among available shipboard tanks. In this regard, (i) Bunker fuel is technically any type of fuel oil used aboard ships. It gets its name from the containers on ships and in ports that it is stored in; in the days of steam they were coal bunkers but now they are bunker-fuel tanks, (ii) Bunker refers to the spaces (Tank) on board a vessel to store fuel, (iii) Bunker trader refers to a person dealing in trade of bunker (fuel), (iv) Bunker call is made when a cargo ship anchors or berths in a port to take on bunker oil or supplies, (v) Bunkering service is the supply of a requested quality and quantity of bunkers to a ship. Bunkering is signficant from point of view of freight rates applicable to the shipper as Bunker Contribution (BUC)/ Fuel Adjustment Factor (FAF)/ Bunker Adjustment Factor (BAF) are applied by shipping lines to offset the effect of fluctuations in the cost of bunkers. |
| Cabotage | Transport by a vehicle registered in a country, performed on the national territory of another country. Cabotage law may restrict domestic cargo traffic to be carried in its own nationally registered, and sometimes built and crewed vehicles, though regulations vary across industries/commodity groups/countries and sometimes specify maximum allowable percentage of cabotage that can be serviced by foreign registered fleet. |
| C-commerce | Collaborative commerce (also known as C-commerce), (i) describes electronically enabled business interactions among an enterprise’s internal personnel, business partners and customers throughout a trading community (industry, industry segment, supply chain or supply chain segment); (ii) is the optimization of supply and distribution channels to capitalize on the global economy by using new technology efficiently. Advantages of C-commerce, to detail few include (i) maximization of organization's efficiency and profitability (ii) technology integration with physical channels to allow companies to work together (iii) increased information exchange such as inventory and product specifications, using the web as an intermediary (iv) increased competitiveness by reaching a broader audience. Examples of C-commerce, also known as peer-to-peer commerce, include (i) companies that allow consumers to rent things from each other, or marketplaces, such as Meta (formerly Facebook) Marketplace, that allow the sale of used goods; (ii) DoorDash teamed up with many national brands, such as McDonald’s and Chipotle, to offer fast food delivery, building their business model on c-commerce. They have since expanded their delivery service from restaurants to retailers and even offer 'fleets' of drivers to businesses. |
| Courier | A business/company that delivers packages/parcels/shipments (upto 70 kgs) including quick door to door pickup and delivery service for goods or documents, domestically or internationally, on a commercial contract basis. Example, DHL Group, FedEx, United Parcel Service of America, Inc., USPS, International Distributions Services, J&T Express, SF Express among several others |
| Cross docking | Cross docking is a practice in logistics management that includes unloading incoming delivery vehicles and loading the materials directly into outbound delivery vehicles, omitting traditional warehouse logistical practices and saving time and money. It requires close synchronization of both inbound and outbound movements. It is highly significant in reduction of costs pertaining to warehousing & storage (and the associated Value Added Services). |
| Cross Trade | International transport between two different countries performed by a vehicle registered in a third country. A third country is a country other than the country of loading/embarkation and the country of unloading/disembarkation. Cross Trade law may restrict international cargo traffic to be carried by respective country's registered vehicles, and sometimes built and crewed vehicles, though regulations vary across industries/commodity groups/countries and sometimes specify maximum allowable percentage of cross trade that can be serviced by foreign registered fleet. |
| Customs Clearance | The process of declaring and clearing cargoes through customs. It includes the procedures involved in getting cargo released by Customs through designated formalities such as presenting import license/permit, payment of import duties and other required documentations by the nature of the cargo. In this regard, a customs broker is a person or company licensed by the respective department of the country to act on behalf of freight importers and exporters. |
| Dangerous Goods | Dangerous goods (or hazardous materials or HAZMAT) include flammable liquids/solids, gases (compressed, liquified, dissolved under pressure), corrosives, oxidising substances, explosive substances and articles, substances which on contact with water emit flammable gasses, organic peroxides, toxic substances, infectious substances, radioactive materials, miscellaneous dangerous goods and articles. |
| First mile Delivery | First mile delivery refers to the (i) first stage of the freight/shipment/cargo/courier transportation (ii) the transportation of goods from a merchant’s premises or warehouse to the next fulfillment centre/warehouse/hub from where the goods are forwarded (iii) shipping goods from local distribution centers to stores (For retailers) (iv) transportation of finished goods from a plant or a factory to a distribution center (For manufacturers), (v) pick up of goods from the end-customer’s home or store followed by movement to a warehouse or storage location (movers and packers), (vi) process where goods are picked up from a retailer and then transferred to third-party logistics providers or courier service providers to be delivered to the end-consumer (e-commerce). Once the package reaches the next warehouse or the courier’s hub, it is then sorted and transported further until it reaches the customer’s doorstep. Example, if one chooses UPS as a courier, first-mile delivery will be the product being delivered from manufacturer's/retailer's warehouse to the UPS’s warehouse/ fulfilment centre. |
| Last Mile Delivery | Last mile delivery refers to the very last step of the delivery process when a parcel is moved from a transportation hub (warehouse or a distribution center or fulfillment centre) to its final destination, which usually is a personal residence/retail store/ business, or parcel locker. It accounts for around half of the total cost involved in entire process of first mile, middle mile, and last mile delivery, though it can vary shipment to shipment, based on commodity, business model and similar factors. |
| Milkrun | A Milk Run is a delivery method used to transport mixed loads from various suppliers to one customer, using lean management principles applied to logistics. Instead of each supplier sending a truck every week to meet the needs of one customer, one truck (or vehicle) visits the suppliers to pick up the loads for that customer. This method of transport got its name from the dairy industry practice, where one tanker used to collect milk from several dairy farms for delivery to a milk processing company. A milk run can be a more efficient way to handle logistics but require proper planning. If the route involves products from different companies, there is need for an agreement about cost-sharing and other aspects of the cooperative delivery arrangement. Once the group settles these issues, this delivery method can save time and money for everyone by pooling operation costs and resources. |
| Multi country consolidation | Multi-Country Consolidation (MCC) is a cost-effective solution that consolidates one's cargo from different countries of origin to build Full Container Loads (FCL). MCC is most suitable for companies that import light volumes of goods from multiple countries but want to take advantage of the more economic FCL freight rates. Apart from costing some of the other advantages include (i) flexibility to choose suppliers from a wider range of origin countries without worrying about the logistics to final destination from each origin, (ii) ability to pick the most suitable suppliers from many different countries for one's business operations. The increase in one's sourcing options by MCC provides the kind of flexibility needed in competitive global markets. |
| Q-commerce | Q-commerce, also referred to as quick commerce, is a type of e-commerce where emphasis is on quick deliveries, typically in less than an hour. The companies providing Q-Commerce services might have vertically intergrated model or might be using third party delivery platforms (outsourced logistics). It has advantages like (i) competitve USP, (ii) potential to earn greater profit margins, (iii) better customer experience, (iv) guaranteed availability of products, (v) traceability, and (vi) scaleability. |
| ReverseLogistics | Reverse logistics is a type of supply chain management that moves goods from customers back to the sellers or manufacturers and may involve ciruclar economy principles (3Rs) viz. recycling, reuse (repurposing, reselling), reducing or repairing. In this regard, reverse commerce (or Recommerce) is the selling of previously owned items through physical or online marketplaces/distribution channels to buyers who reuse, recycle or resell them. |


Research Methodology
Mordor Intelligence follows a four-step methodology in all our reports.
- Step-1: Identify Key Variables: In order to build a robust forecasting methodology, the variables and factors identified in Step-1 are tested against available historical market numbers. Through an iterative process, the variables required for market forecast are set and the model is built on the basis of these variables.
- Step-2: Build a Market Model: Market-size estimations for the forecast years are in nominal terms. Inflation is considered to be a part of the pricing, and the average selling price (ASP) is varying throughout the forecast period for each country
- Step-3: Validate and Finalize: In this important step, all market numbers, variables and analyst calls are validated through an extensive network of primary research experts from the market studied. The respondents are selected across levels and functions to generate a holistic picture of the market studied.
- Step-4: Research Outputs: Syndicated Reports, Custom Consulting Assignments, Databases & Subscription Platforms


