Market Overview
| Study Period | 2018 - 2031 |
|---|---|
| Forecast Data Period | 2026 - 2031 |
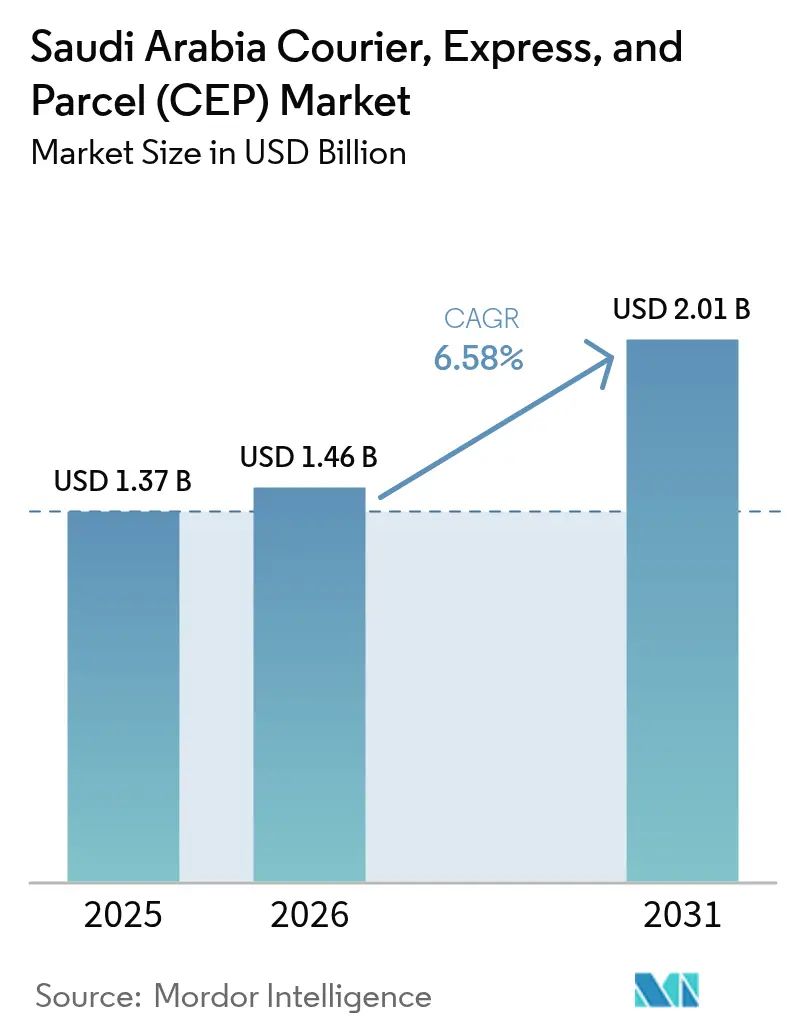
| Base Year Market Size (2025) | USD 1.37 Billion |
| Market Size (2026) | USD 1.46 Billion |
| Market Size (2031) | USD 2.01 Billion |
| Growth Rate (2026 - 2031) | 6.58% CAGR |
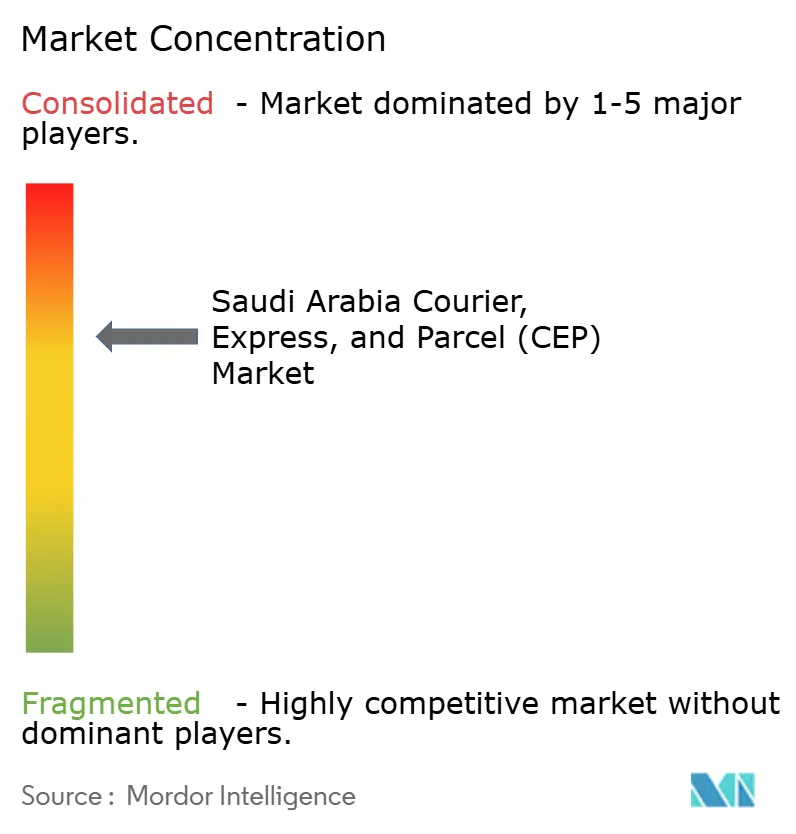
| Market Concentration | Medium |
Major Players *Disclaimer: Major Players sorted in no particular order Image © Mordor Intelligence. Reuse requires attribution under CC BY 4.0. | |
Saudi Arabia Courier, Express, And Parcel (CEP) Market Analysis by Mordor Intelligence
The Saudi Arabia courier, express, and parcel (CEP) market size in 2026 is estimated at USD 1.46 billion, growing from 2025 value of USD 1.37 billion with 2031 projections showing USD 2.01 billion, growing at 6.58% CAGR over 2026-2031. Massive infrastructure outlays under Vision 2030, preparations for Expo 2030, and early FIFA 2034 logistics planning are expanding last-mile capacity requirements, accelerating parcel volumes well beyond traditional e-commerce seasonality. Competitive positioning now hinges on real-time visibility, temperature-controlled capability, and unit-cost control achieved through AI-enabled routing and automated sortation. National Address coverage, Integrated Logistics Business Zones, and expanded air-road intermodal links are compressing delivery windows and catalyzing network redesign. Cash-on-delivery dependence, driver scarcity amid Saudization, and heat-related fleet wear remain structural cost pressures, yet operators that master digital payment integration, flexible driver sourcing, and predictive maintenance continue to defend margins.
Key Report Takeaways
- By destination, domestic parcels accounted for 64.90% of the Saudi Arabia courier, express, and parcel (CEP) market share in 2025; international shipments are on track to grow at a 6.78% CAGR between 2026-2031.
- By speed of delivery, non-express services commanded 74.40% of the Saudi Arabia courier, express, and parcel (CEP) market size in 2025, while express deliveries are advancing at a 7.38% CAGR between 2026-2031.
- By model, business-to-consumer (B2C) flows accounted for 58.95% of the revenue share in 2025, while business-to-business (B2B) logistics are projected to post the fastest 3.22% CAGR between 2026-2031.
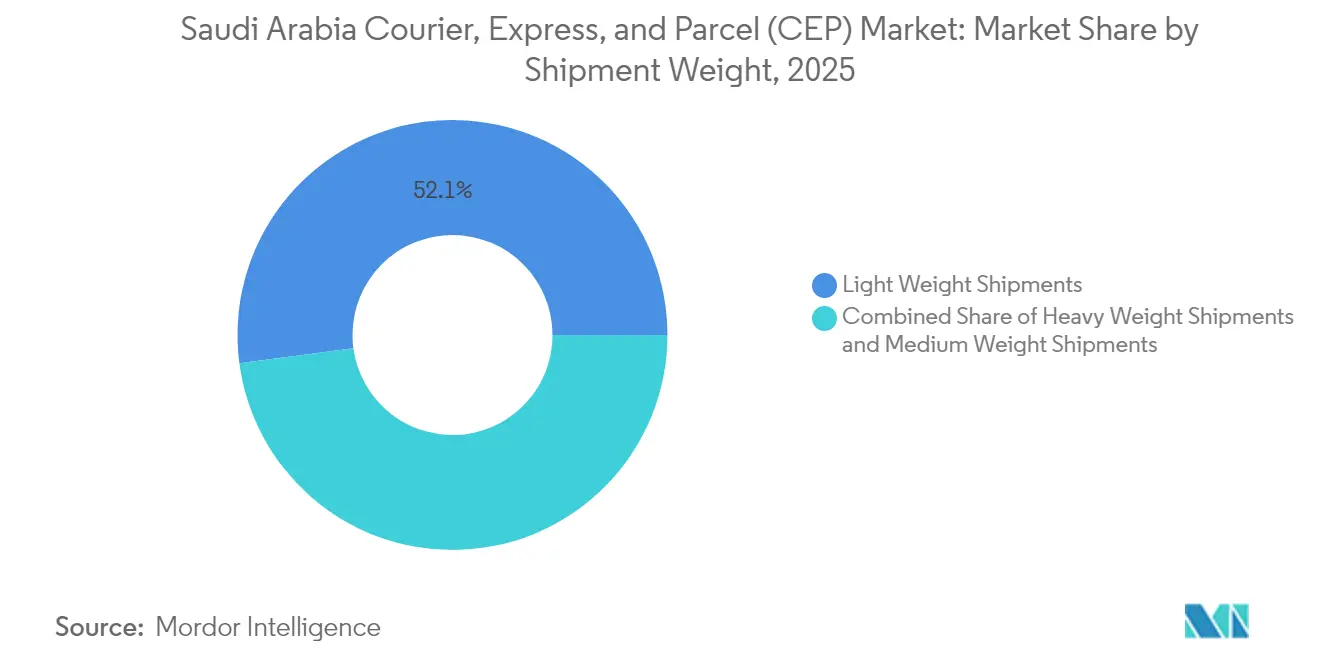
- By shipment weight, light-weight parcels captured 52.10% of the revenue share in 2025, even as heavy-weight consignments are increasing at a 5.84% CAGR between 2026-2031.
- By mode of transport, air kept a 39.30% share of the revenue share in 2025; road is rising at a 6.55% CAGR between 2026-2031 as the National Address system trims last-mile detours.
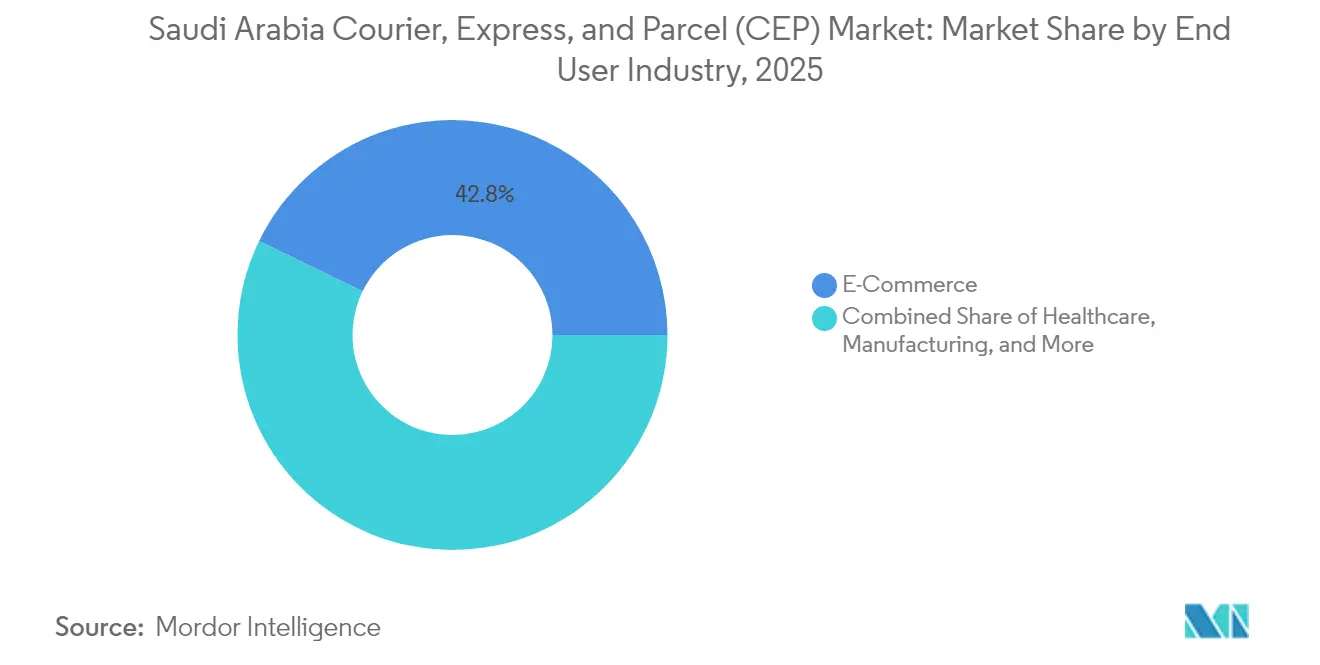
- By end user industry, e-commerce generated 42.80% of total 2025 revenue while healthcare logistics is progressing at a 6.82% CAGR between 2026-2031 on telepharmacy uptake.
Note: Market size and forecast figures in this report are generated using Mordor Intelligence’s proprietary estimation framework, updated with the latest available data and insights as of 2026.
Saudi Arabia Courier, Express, And Parcel (CEP) Market Trends and Insights
Drivers Impact Analysis*
| Driver | (~) % Impact on CAGR Forecast | Geographic Relevance | Impact Timeline |
|---|---|---|---|
| Growth of e-commerce transactions and digital wallets | +1.2% | Riyadh, Jeddah, Dammam | Medium term (2-4 years) |
| Vision 2030 logistics-infrastructure spending surge | +1.8% | NEOM, Riyadh, Eastern Province | Long term (≥ 4 years) |
| National Address and ILBZ accelerating last-mile accuracy | +0.9% | Tier-2 and Tier-3 cities | Short term (≤ 2 years) |
| Expo 2030 and FIFA 2034 parcel-volume spike | +1.1% | Riyadh and spillover metros | Medium term (2-4 years) |
| AI-based routing platforms lowering unit costs | +0.7% | Urban cores, expanding to suburbs | Short term (≤ 2 years) |
| Pharma cold-chain reforms boosting CEP demand | +0.5% | National, healthcare hubs | Medium term (2-4 years) |
| Source: Mordor Intelligence | |||


Growth of E-Commerce Transactions and Digital Wallets
Soaring digital payment penetration eliminates settlement frictions that once slowed Saudi parcel handoffs. Grocery orders are increasing at an 18.2% CAGR to 2028, channeling steady volumes into temperature-controlled last-mile lanes[1]Pierrick Ribes, “Seven Graphs Illustrating the Growth of Saudi Arabia's Food Delivery Industry,” entrepreneur.com. Wallet-based check-outs remove reverse-cash loops, lowering failed-delivery ratios and freeing couriers from armored cash pick-ups. Platforms such as HungerStation funnel cloud-kitchen output directly into courier workflows, bypassing brick-and-mortar intermediaries. Annual revenue per user now exceeds USD 600 for online food services, underscoring consumers’ readiness to pay premium surcharges for reliable same-day fulfillment. These dynamics are propelling express subsegments within the Saudi Arabia courier, express, and parcel (CEP) market.
Vision 2030 Logistics-Infrastructure Spending Surge
Vision 2030 earmarks multi-billion-dollar corridors, ports, and smart-city spines that mandate high-precision inbound logistics. NEOM construction sites require just-in-time component drops, authenticated documentation, and IoT-enabled chain-of-custody oversight[2]Saudi Government, “Technologies Integration,” my.gov.sa. Port expansions plus bonded logistics zones elevate cross-dock throughput while logistics-tech sandboxes shorten prototype-to-production cycles for innovative delivery models. Locally sourced manufacturing inputs drive B2B courier requisitions for quality-assurance samples and spare-part replenishment runs. Circular-economy ambitions further add reverse-logistics layers for recycling streams, rewarding carriers that can orchestrate forward and backward flows under unified dashboards.
National Address and ILBZ Accelerating Last-Mile Accuracy
The National Address Unit’s 4-alphanumeric schema feeds HERE Technologies’ geocoding engine, enabling turn-by-turn route scripts that minimize phone-based confirmations[3]Erwin Soekianto, “Find New Saudi Arabia Short Addresses with HERE Geocoding,” here.com. Integrated Logistics Business Zones expedite customs pre-clearance, compressing cross-border dwelling times for high-value parcels. Widespread address normalization slashes driver miles, refines estimated times of arrival, and underpins robotic sortation accuracy rates. Tier-2 and Tier-3 cities, once hampered by ambiguous landmarks, now display measurable uplift in e-commerce conversion as delivery reliability rises.
Expo 2030 and FIFA 2034 Parcel-Volume Spike
Preview events and infrastructure mobilization for Expo 2030 and FIFA 2034 elevate atypical parcel categories—oversize exhibits, broadcast kits, fan merchandise—forcing network scale-ups and specialized handling protocols. Temporary demand peaks validate automated hubs erected ahead of schedule and justify dedicated charter flights into Riyadh. Operators equipped with multilingual customer support and surge labor pools secure repeat contracts as large-event specialists.
Restraints Impact Analysis*
| Restraint | (~) % Impact on CAGR Forecast | Geographic Relevance | Impact Timeline |
|---|---|---|---|
| High COD preference inflating reverse-logistics costs | –0.8% | Rural and suburban clusters | Short term (≤ 2 years) |
| Courier driver shortages amid Saudization rules | –1.1% | Major metros and periphery routes | Medium term (2-4 years) |
| Fragmented address data outside Tier-1 cities | –0.6% | Tier-2, Tier-3, and remote areas | Short term (≤ 2 years) |
| Heat-related asset depreciation in last-mile fleets | –0.4% | Central and eastern regions | Long term (≥ 4 years) |
| Source: Mordor Intelligence | |||
High COD Preference Inflating Reverse-Logistics Costs
Cash-centric customers necessitate multiple delivery attempts and secure cash reconciliation, eroding per-parcel margin. Rural drop densities magnify fuel burn and idle time, forcing operators to cross-subsidize these lanes with urban wallet-based consignments. Returned goods workflows compound working-capital lock-ups while heightening write-off risk for perishables.
Courier Driver Shortages amid Saudization Rules
Historic 2024 unemployment of 7% tightened labor pools, and Saudization quotas escalated local-hire requirements inside courier fleets[4]Opensignal, “The State of Fixed Wireless Access in Saudi Arabia: June 2025,” opensignal.com. Driver wage escalation intersects with triple-digit summer heat, pushing absenteeism and inflating insurance premiums. Training pipelines lag demand, delaying fleet expansions and elongating delivery windows during peak sales events.
*Our forecasts treat driver/restraint impacts as directional, not additive. The impact forecasts reflect baseline growth, mix effects, and variable interactions.
Segment Analysis
By End User Industry: Healthcare Surges on Digital Therapeutics
E-commerce continues to drive 42.80% of 2025 turnover; however, healthcare parcels are outpacing all other verticals at 6.82% CAGR between 2026-2031. Telemedicine scripts, cold-chain biologics, and at-home diagnostics kits underpin recurring demand cycles with stringent compliance requirements. Ministry of Health digital initiatives mandate serialized medicine tracking, opening cross-selling pathways into secure document delivery.
Financial services and wholesale trade each necessitate armored transfer protocols or pallet-level consolidation, extending carrier service portfolios beyond standard parcel drop-offs. Primary industry volumes stem from mining and agriculture, requiring ruggedized packaging and returnable crate programs.


By Destination: Cross-Border Momentum Strengthens Network Diversification
International consignments are growing at a 6.78% CAGR between 2026-2031, outpacing domestic flows that still account for a commanding 64.90% share of the Saudi Arabia courier, express, and parcel (CEP) market size in 2025. Blockchain-enhanced customs corridors such as TradeLens slash dwell times between Dammam and Rotterdam, allowing shippers to reposition Saudi hubs as pivots for Red Sea deviation mitigation. Domestic lines benefit from address precision but endure margin drag from COD obligations and fleet temperature stress. International lanes capture higher yield through customs brokerage and multi-leg value-added services, fortifying carrier profitability even as volume share remains below domestic dominance.
Saudi Arabia’s geopolitical positioning attracts regional redistribution contracts, leveraging efficient transshipment links from Jeddah Islamic Port into GCC capitals. Regulatory sandboxes for cross-border e-commerce apps de-risk scaling strategies, enabling agile carriers to tap adjacent markets without legacy bureaucracy. As preferential trade accords are finalized, international parcel density is expected to exert positive spin-off effects on domestic backhaul optimization, reinforcing network utilization metrics across the Saudi Arabia courier, express, and parcel (CEP) market.
By Speed of Delivery: Express Gains Traction on Urban Time-Sensitivity
Non-express categories comprised 74.40% of 2025 revenue, yet express consignments are rising at 7.38% CAGR between 2026-2031, cutting into the share hierarchy. Same-day commitments are now table stakes for Riyadh-centric marketplaces, driven by wallet checkout removal of payment-delay buffers. AI-driven micro-fulfillment nodes ensure cut-off compliance while predictive load balancing evens intraday peaks.
Express yield premiums justify heavier capex on automation and on-vehicle telematics. Non-express operators defend share via carton-level consolidation, trading longer lead times for cost efficiency. Communications, Space & Technology Commission pilots allow express firms to iterate drone and autonomous van prototypes under regulatory waivers, signaling future modal shifts once scale economics materialize.
By Shipment Weight: Heavy Freight Escalates on Mega-Project Pipelines
Lightweight parcels secured 52.10% of the Saudi Arabia courier, express, and parcel (CEP) market share in 2025 on the back of electronics and apparel e-commerce. Yet heavy-weight consignments are lengthening the tail, advancing at 5.84% CAGR between 2026-2031 as giga-projects funnel structural steel, HVAC modules, and precast panels. Medium-weight segments benefit from booming meal-kit and appliance orders that require insulated totes and careful handling.
Road-rail multimodal corridors under development will further de-risk heavy consignment throughput, lowering per-ton-kilometer costs and integrating project logistics with conventional parcel networks. This diversification stabilizes revenue composition and cushions couriers against cyclical dips in consumer discretionary spending.
By Mode of Transport: Road Gains on Address Precision, Air Retains High-Value Niches
Air held 39.30% of the 2025 value but faces gradual dilution as road hauls expand at a 6.55% CAGR between 2026-2031, benefitting from National Address-driven route fidelity. Fuel-efficient truck fleets, aided by predictive maintenance and tire-pressure telemetry, narrow door-to-door transit gaps on many domestic lanes. Nonetheless, pharma biologics, luxury electronics, and international express parcels still default to belly-hold or dedicated freighter capacity.
Rail and coastal feeder vessels remain niche contributors, serving outsized or hazardous consignments under specialized permits. Long-term cost advantages may accelerate road-to-rail modal shift once the Saudi Landbridge reaches commissioning, offering alternative routings for high-density freight segments within the Saudi Arabia courier, express, and parcel (CEP) market.
By Model: B2C Dominates, B2B Complexity Raises Entry Barriers
B2C traffic controlled 58.95% of the Saudi Arabia courier, express, and parcel (CEP) market share in 2025, in line with consumers posting the MENA region’s highest per-capita online spend. Wallet-linked loyalty cashbacks lift basket values, sustaining parcel frequency growth trajectories. Social commerce fosters micro-sellers using C2C corridors, though absolute volumes remain secondary.
B2B consignments record lower volume but higher average billing weight and are expected to grow at a 3.22% CAGR between 2026-2031, underpinned by Vision 2030 localization that requires frequent component shuttle runs. Compliance documentation, calibration tools, and test samples command service-level agreements that favor operators with bonded facilities and ISO9001 processes. As local manufacturing deepens, B2B lanes may climb to parity with B2C revenue share by decade's end.
Geography Analysis
Riyadh Province anchors volume density with over 1,282 fueling stations and 6,000 e-government service portals processing 3 billion digital transactions annually, supplying steady last-mile paperwork and small-parcel streams. Eastern Province, home to hydrocarbon clusters and metallurgical plants, relies on bonded yards and oversized-cargo corridors that have pushed B2B revenues up the hierarchy.
Northern Border Province leverages 92 strategically placed fueling nodes, facilitating cross-border hand-offs into Iraq and Jordan as land-route alternatives to volatile Red Sea lanes. Jazan Province merges agri-produce consolidation with port-side reefer capacity, supporting southbound fresh-fruit exports and northbound packaged-food flows. Connectivity divergence persists: Riyadh enjoys 55.3% Consistent Quality Fixed Wireless Access versus Mecca’s 36.4%, prompting courier IT teams to deploy multi-SIM redundancy to sustain real-time vehicle telemetry uploads. These geographic nuances oblige route planners to stagger bandwidth-heavy manifest updates and adjust delivery sequencing to minimize blind-spot exposure across the Saudi Arabia courier, express, and parcel (CEP) market.
Competitive Landscape
The Saudi Arabia courier, express, and parcel (CEP) market remains moderately consolidated: global integrators dominate cross-border airlift while domestic players excel in city-center last-mile and COD reconciliation. Technology — from robotic sorters capable of 4,000 parcels per hour to AI-driven dispatch — is the primary differentiator, as evidenced by Aramex’s KSA robotic hub unveiled in January 2025, processing 96,000 items daily.
International brands secure strategic real estate: DHL has earmarked USD 571 million toward multiyear Gulf infrastructure, and FedEx inaugurated its first dedicated Saudi freighter linked to a forthcoming regional hub at King Salman International Airport. Local champions partner with state entities: Maersk’s July 2025 MoU with Saudi Post aligns crowd-sourced riders, postal branches, and bonded warehousing into an integrated e-commerce gateway.
White-space profitability lies in pharma cold-chain, reverse logistics, and construction prototype runs—segments requiring credentialed facilities and kinetic route orchestration that barrier late entrants. Regulatory sandboxes permit drones, autonomous sidewalk robots, and smart locker pilots, providing disruptive challengers with a runway to capture niche volume shards before scaling horizontally across the broader Saudi Arabia courier, express, and parcel (CEP) market.
Saudi Arabia Courier, Express, And Parcel (CEP) Industry Leaders
Saudi Post- SPL (including Naqel Express)
Aramex
SMSA Express Transportation Company Ltd.
DHL Group
Kadi Group Holding (including Zajil Express)
- *Disclaimer: Major Players sorted in no particular order

Recent Industry Developments
- September 2025: FedEx completed its transition to a direct-serve model in Saudi Arabia, launching a dedicated flight and announcing a logistics hub at King Salman International Airport.
- July 2025: Maersk Saudi Arabia and Saudi Post Company signed an MoU to integrate e-commerce logistics and last-mile solutions across the Kingdom and wider GCC.
- June 2025: DHL Group confirmed USD 571 million Gulf network investments through 2030, targeting express, freight, contract logistics, and e-commerce units in Saudi Arabia and the UAE.
- January 2025: Aramex unveiled a robotic sorting facility in Riyadh featuring 120 AGVs capable of 4,000 parcels per hour, underscoring automation’s critical role in scaling.


Saudi Arabia Courier, Express, And Parcel (CEP) Market Report Scope
Domestic, International are covered as segments by Destination. Express, Non-Express are covered as segments by Speed Of Delivery. Business-to-Business (B2B), Business-to-Consumer (B2C), Consumer-to-Consumer (C2C) are covered as segments by Model. Heavy Weight Shipments, Light Weight Shipments, Medium Weight Shipments are covered as segments by Shipment Weight. Air, Road, Others are covered as segments by Mode Of Transport. E-Commerce, Financial Services (BFSI), Healthcare, Manufacturing, Primary Industry, Wholesale and Retail Trade (Offline), Others are covered as segments by End User Industry.Destination
| Domestic |
| International |
Speed of Delivery
| Express |
| Non-Express |
Model
| Business-to-Business (B2B) |
| Business-to-Consumer (B2C) |
| Consumer-to-Consumer (C2C) |
Shipment Weight
| Heavy Weight Shipments |
| Light Weight Shipments |
| Medium Weight Shipments |
Mode of Transport
| Air |
| Road |
| Others |
End User Industry
| E-Commerce |
| Financial Services (BFSI) |
| Healthcare |
| Manufacturing |
| Primary Industry |
| Wholesale and Retail Trade (Offline) |
| Others |
| Destination | Domestic |
| International | |
| Speed of Delivery | Express |
| Non-Express | |
| Model | Business-to-Business (B2B) |
| Business-to-Consumer (B2C) | |
| Consumer-to-Consumer (C2C) | |
| Shipment Weight | Heavy Weight Shipments |
| Light Weight Shipments | |
| Medium Weight Shipments | |
| Mode of Transport | Air |
| Road | |
| Others | |
| End User Industry | E-Commerce |
| Financial Services (BFSI) | |
| Healthcare | |
| Manufacturing | |
| Primary Industry | |
| Wholesale and Retail Trade (Offline) | |
| Others |


Market Definition
- Courier, Express, and Parcel - The Courier, Express, and Parcel services, often called as CEP Market, refers to the logistics and postal service providers which specialize in moving small goods (parcels/packages). It captures the overall market size (USD) and market volume (number of parcels) of (1) the shipments/parcels/packages which are under 70kgs/ 154lbs weight, (2) Business Customer packages viz. Business-to-Business (B2B) & Business-to-Consumer (B2C) as well as private customer packages (C2C), (3) non-express parcel delivery services (Standard and Deferred) as well as express parcel delivery services (Day-Definite-Express and Time-Definite-Express), (4) domestic as well as international shipments.
- Demographics - To analyse total addressable market demand, population growth & forecasts have been studied and presented in this industry trend. It represents population distribution across categories like gender (male/female), development area (urban/rural), major cities among other key parameters like population density and final consumption expenditure (growth and share % of GDP). This data has been used for assessing the fluctations in demand & consumption expenditure, and the major hotspots (cities) of potential demand.
- Domestic Courier Market - Domestic Courier Market refers to the CEP shipments wherein the origin and destination is within the boundary of the geography studied (country or region as per the scope of report). It captures the market size (USD) and market volume (number of parcels) of (1) the shipments/parcels/packages which are under 70kgs/ 154lbs weight, including light weight shipments, medium weight shipments and heavy weight shipments (2) Business Customer packages viz. Business-to-Business (B2B) & Business-to-Consumer (B2C) as well as private customer packages (C2C), (3) non-express parcel delivery services (Standard and Deferred) as well as express parcel delivery services (Day-Definite-Express and Time-Definite-Express).
- E-Commerce - This end user industry segment captures the external (outsourced) logistics expenditure incurred by the e-tailers, through online sales channel, on Courier, Express, and Parcel (CEP) services. The scope includes (i) the supply chain of a company's online customer orders being fulfilled, (ii) the process of getting a product from the point of manufacturing to the point at which it is delivered to consumers. It involves managing inventory (deferred as well as time critical), shipping, and distribution.
- Export Trends and Import Trends - Overall logistics performance of an economy is positively and significantly (statistically) correlated to its trade performance (exports and imports). Hence, in this industry trend, total value of trade, major commodities/ commodity groups and the major trade partners, for the studied geography (country or region as per the scope of report) have been analysed alongside the impact of major trade/logistics infrastructure investments & regulatory environment.
- Financial Services (BFSI) - This end user industry segment captures the external (outsourced) logistics expenditure incurred by the BFSI players, on Courier, Express, and Parcel (CEP) services. CEP is important to the financial services industry in shipping of confidential documents and files. The establishments in this sector are engaged in (i) financial transactions (that is, transactions involving the creation, liquidation, or change in ownership of financial assets) or in facilitating financial transactions, (ii) financial intermediation, (iii) the pooling of risk by underwriting annuities and insurance, (iv) providing specialized services that facilitate or support financial intermediation, insurance and employee benefit programs, and (v) monetary control - the monetary authorities.
- Fuel Price - Fuel price spikes can cause delays and diruption for logistics service providers (LSPs), while drops in the same can result in higher short-term profitability and increased market rivalry to offer consumers with the best deals. Hence, the fuel price variations have been studied over the review period and presented along with the causes as well as market impacts.
- GDP Distribution by Economic Activity - Nominal Gross Domestic Product and distribution of the same, across major economic sectors in the geography studied (country or region as per scope of the report) have been studied and presented in this industry trend. As GDP is positively related to the profitability and growth of logistics industry, this data has been used in adjunction to the input-output tables/ supply-use tables for analyzing the potential major contributing sectors towards the logistics demand.
- GDP Growth by Economic Activity - Growth of Nominal Gross Domestic Product across major economic sectors, for the geography studied (country or region as per scope of the report) have been presented in this industry trend. This data has been utilized for assessing the growth of logistics demand from all the market end users (economic sectors considered here).
- Healthcare - This end user industry segment captures the external (outsourced) logistics expenditure incurred by the Healthcare players (Hospitals, clinics, mrdical centres) , on Courier, Express, and Parcel (CEP) services. The scope includes CEP services involved in the defrerred as well time critical movement of medical goods & supplies (surgical supplies and instruments, including gloves, masks, syringes, equipment). The establishments in this sector (i) include the ones providing medical care exclusively (ii) deliver services by trained professionals (iii) involve processes, including labor inputs of health practitioners with the requisite expertise (iv) are defined based on the educational degree held by the practitioners included in the industry.
- Inflation - Variations in both Wholesale Price Inflation (YoY change in producer price index) and Consumer Price Inflation have been presented in this industry trend. This data has been used to assess the inflationary environment as it plays a vital role in smooth functioning of the supply chain, directly impacting the logistics operational cost components e.g., pricing of tyres, driver wages & benefits, energy/fuel prices, maintenace costs, toll charges, warehousing rents, custom brokerage, forwarding rates, courier rates etc. hence impacting the overall freight and logistics market.
- Infrastructure - As infrastructure plays a vital role in an economy's logistics performance, variables like length of roads, distribution of road length by surface category (paved v/s unpaved), distribution of road length by road classification (expressways v/s highways v/s other roads), rail length, volume of containers handled by major ports and tonnage handled by major airports have been analysed and presented in this industry trend.
- International Express Service Market - International Express Service Market refers to the CEP shipments wherein the origin or destination is not within the boundary of the geography studied (country or region as per the scope of report). It captures the market size (USD) and market volume (number of parcels) of (1) the shipments/parcels/packages which are under 70kgs/ 154lbs weight, including light weight shipments, medium weight shipments and heavy weight shipments (ii) Inter-Region as well as Intra-Region Shipments
- Key Industry Trends - The report section named "Key Industry Trends" include all the key variables/parameters studied to better analyze the market size estimates and forecasts. All the trends have been presented in the form of data points (time series or latest available data points) along with analysis of the paramter in the form of concise market relevant commentary, for the geography studied (country or region as per the scope of report).
- Key Strategic Moves - The action taken by a company to differentiate from its competitor or used as a general strategy is referred to as a key strategic move (KSM). This includes (1) Agreements (2) Expansions (3) Financial Restructuring (4) Mergers and Acquisitions (5) Partnerships, and (6) Product Innovations. Key players (Logistics Service Providers, LSPs) in the market have been shortlisted, their KSM have been studied and presented in this section.
- Logistics Performance - Logistics Performance and Logistics Costs are the backbone of trade, and influences trade costs, making countries compete globally. Logistics performance is influenced by market wide adopted supply chain management strategies, government services, investments & policies, fuel/ energy costs, inflationary environment etc. Hence, in this industry trend, the logistics performance of the geography studied (country/ region as per the scope of report) has been analysed and presented over the review period.
- Manufacturing - This end user industry segment captures the external (outsourced) logistics expenditure incurred by the Manufacturing industry (including Hi-Tech/Technology) players, on Courier, Express, and Parcel (CEP) services. The end user players considered are the establishments primarily engaged in the chemical, mechanical or physical transformation of materials or substances into new products. Logistics Service Providers (LSPs) play a crucial role in maintaining a smooth flow of raw materials across the supply chain, enabling timely delivery of finished goods to distributors or end customers and storing & supplying the raw materials to clients for just-in-time manufacturing.
- Other End Users - Other end user segment captures the external (outsourced) logistics expenditure incurred by the construction, real estate, educational services, and professional services (administrative, waste management, legal, architectural, engineering, design, consulting, scientific R&D), on Courier, Express, and Parcel (CEP) services. Logistics Service Providers (LSPs) plays a crucial role in the reliable movement of time critical supplies and documents to/from these industries such as transporting any equipment or resources required, shipping confidential documents and files.
- Primary Industry - This end user industry segment captures the external (outsourced) logistics expenditure incurred by the AFF (Agriculture, Fishing, and Forestry) and Extraction indsutry (Oil &Gas, Quarrying and Mining) players, on Courier, Express, and Parcel (CEP) services. The end user players considered are the establishments (i) primarily engaged in growing crops, raising animals, harvesting timber, harvesting fish & other animals from their natural habitats and providing related support activities; (ii) that extract naturally occurring mineral solids, such as coal and ores; liquid minerals, such as crude petroleum; and gases, such as natural gas. Herein, Logistics Service Providers (LSPs) (i) play a crucial role in acquisition, storage, handling, transportation, and distribution activities for the optimal & continuous flow of inputs (seeds, pesticides, fertilizers, equipment, and water) from manufacturers or suppliers to the producers and smooth flow of output (produce, agro-goods) to distributors/ consumers; (ii) cover entire phases from upstream to downstream and play a crucial role in the transportation of machinery, drilling equipments, extracted minerals, crude oil & natural gas and refined/ processed products from one place to another. This includes both termperature controlled and non-temperature controlled logistics, as and when required according to the shelf life of goods being transported or stored.
- Producer Price Inflation - It indicates inflation from viewpoint of the producers viz. the average selling price received for their output over a period of time. Annual change (YoY) of producer price index is reported as wholesale price inflation in the "Inflation" industry trend. As WPI captures dynamic price movements in most comprehensive way, it is widely used by governments, banks, industry, business circles and is deemed important in formulation of trade, fiscal and other economic policies. The data has been used in adjunction to consumer price inflation for better understanding the inflationary environment.
- Segmental Revenue - Segmental Revenue has been triangulated or computed and presented for all the major players in the market. It refers to the courier, express, and parcel (CEP) market specific revenue earned by the company, over the base year of study, in the geography studied (country or region as per the scope of report). It is computed through the study and analysis of major parameters like financials, service portfolio, employee strength, fleet size, investments, number of countries present in, major economies of concern, etc. that have been reported by the company in its annual reports, webpage. For companies having scarce financial disclosures, paid databases like D&B Hoovers, Dow Jones Factiva have been resorted to and verified through industry/expert interactions.
- Transport and Storage Sector GDP - Value and growth of Transport and Storage Sector GDP has a direct relation to the freight and logistics market size. Hence, this variable has been studied and presented over the review period, in value terms (USD) and as share % of total GDP, in this industry trend. The data has been supported by concise and relevant commentary around the investments, developments, and current market scenario.
- Trends in E-Commerce Industry - Enhanced internet connectivity and boom in smartphone penetration, coupled with increasing disposable incomes, has led to a phenomenal growth in the e-commerce market globally. Online shoppers require fast and efficient delivery of their orders leading to an increase in the demand for logistics services especially e-commerce fulfilment services. Hence, the Gross Merchandise Value (GMV), historial and projected growth, breakup of major commodity groups in e-commerce industry for the studied geography (country or region as per scope of the report) have been analysed and presented in this industry trend.
- Trends in Manufacturing Industry - Manufacturing industry involves the transformation of raw materials into finished products, while logistics industry ensures the efficient flow of raw materials to the factory, and the transport of manufactured products to the distributors & consumers. Demand-Supply of both industries are highly cross-linked and critical for a seamless supply chain. Hence, the Gross Value Added (GVA), breakup of GVA into major manufacturing sectors, and growth of manufacturing industry over the review period have been analysed and presented, in this industry trend.
- Wholesale and Retail Trade (Offline) - This end user industry segment captures the external (outsourced) logistics expenditure incurred by the wholesalers and retailers, through offline sales channel, on Courier, Express, and Parcel (CEP) services. The end user players considered are the establishments primarily engaged in wholesaling or retailing merchandise, generally without transformation, and rendering services incidental to the sale of merchandise. Logistics Service Providers (LSPs) plays a crucial role in the reliable movement of supplies to and finished products from production houses to the distributors and finally to the end customer covering activites like material sourcing, transportation, order fulfillment, warehousing & storage, demand forecasting, inventory management etc.
| Keyword | Definition |
|---|---|
| Axle Load | The axle load refers to the total load (weight) bearing on the roadway through wheels connected to a given axle. Across the globe, there are systems in place to ensure axle load monitoring, wherein surpassing the defined limits set by the concerned regulatory authority can lead to penalty/fine. For transportation of goods via road this can be an important determinant of costs as knowledge about the axle load limits can be used to (i) load the vehicle optimally for maximizing profits (ii) avoid exceeding the same and hence the probable fines associated (iii) avoid wear and tear of the vehicle (iv) avoid damage to pavement resulting in noticeable public maintenance and repair costs (v) achieve better turnaround time. |
| Back Haul | Backhaul is the return movement of a transport vehicle from its original destination to its original point of departure, and can include full, partial, or empty truck loads (all or part of the way) depending on the visibility of the local freight ecosystem. In this regard, transportation of empty containers to the point of origin, known as deadheading is also a significant factor, considering the supply/container shortages across the geographies, resulting in cost escalation and under optimized profit potential attainment. Generally, the carriers offer discounts on the backhaul, to secure freight for the trip. |
| Bill of Lading (BOL) | A bill of lading is a legal contract document issued by a carrier to a shipper to acknowledge reception of their cargo, and is evidence for the contract of carriage between the two parties. Broadly it details the (i) type, quantity, and other specifications of the goods being carried (ii) destination, and terms & conditions of the shipment (iii) carrier and drivers with all the necessary information to process the shipment, which can be used for insurance and customs clearance purposes (iv) assurance that the consignment is damage-free and ready to be shipped to the consignee. In this regard, a house bill of lading (HBL) is a document issued by a freight forwarder or a non-vessel operating common carrier (NVOCC) to acknowledge receipt of items for shipment (to a shipper). If shipments from several shippers are involved a master bill of lading (MBL) might be involved which is a consolidated version of the same for all the shipments being taken care of by the carrier (to a common destination) and might be issued by the carrier to the freight forwarder or the shipper (depending on who books the transport). |
| Bunkering | Bunkering is the process of supplying fuel to power the propulsion system of a ship. It includes the logistics of loading and distributing the fuel among available shipboard tanks. In this regard, (i) Bunker fuel is technically any type of fuel oil used aboard ships. It gets its name from the containers on ships and in ports that it is stored in; in the days of steam they were coal bunkers but now they are bunker-fuel tanks, (ii) Bunker refers to the spaces (Tank) on board a vessel to store fuel, (iii) Bunker trader refers to a person dealing in trade of bunker (fuel), (iv) Bunker call is made when a cargo ship anchors or berths in a port to take on bunker oil or supplies, (v) Bunkering service is the supply of a requested quality and quantity of bunkers to a ship. Bunkering is signficant from point of view of freight rates applicable to the shipper as Bunker Contribution (BUC)/ Fuel Adjustment Factor (FAF)/ Bunker Adjustment Factor (BAF) are applied by shipping lines to offset the effect of fluctuations in the cost of bunkers. |
| Cabotage | Transport by a vehicle registered in a country, performed on the national territory of another country. Cabotage law may restrict domestic cargo traffic to be carried in its own nationally registered, and sometimes built and crewed vehicles, though regulations vary across industries/commodity groups/countries and sometimes specify maximum allowable percentage of cabotage that can be serviced by foreign registered fleet. |
| C-commerce | Collaborative commerce (also known as C-commerce), (i) describes electronically enabled business interactions among an enterprise’s internal personnel, business partners and customers throughout a trading community (industry, industry segment, supply chain or supply chain segment); (ii) is the optimization of supply and distribution channels to capitalize on the global economy by using new technology efficiently. Advantages of C-commerce, to detail few include (i) maximization of organization's efficiency and profitability (ii) technology integration with physical channels to allow companies to work together (iii) increased information exchange such as inventory and product specifications, using the web as an intermediary (iv) increased competitiveness by reaching a broader audience. Examples of C-commerce, also known as peer-to-peer commerce, include (i) companies that allow consumers to rent things from each other, or marketplaces, such as Meta (formerly Facebook) Marketplace, that allow the sale of used goods; (ii) DoorDash teamed up with many national brands, such as McDonald’s and Chipotle, to offer fast food delivery, building their business model on c-commerce. They have since expanded their delivery service from restaurants to retailers and even offer 'fleets' of drivers to businesses. |
| Courier | A business/company that delivers packages/parcels/shipments (upto 70 kgs) including quick door to door pickup and delivery service for goods or documents, domestically or internationally, on a commercial contract basis. Example, DHL Group, FedEx, United Parcel Service of America, Inc., USPS, International Distributions Services, J&T Express, SF Express among several others |
| Cross docking | Cross docking is a practice in logistics management that includes unloading incoming delivery vehicles and loading the materials directly into outbound delivery vehicles, omitting traditional warehouse logistical practices and saving time and money. It requires close synchronization of both inbound and outbound movements. It is highly significant in reduction of costs pertaining to warehousing & storage (and the associated Value Added Services). |
| Cross Trade | International transport between two different countries performed by a vehicle registered in a third country. A third country is a country other than the country of loading/embarkation and the country of unloading/disembarkation. Cross Trade law may restrict international cargo traffic to be carried by respective country's registered vehicles, and sometimes built and crewed vehicles, though regulations vary across industries/commodity groups/countries and sometimes specify maximum allowable percentage of cross trade that can be serviced by foreign registered fleet. |
| Customs Clearance | The process of declaring and clearing cargoes through customs. It includes the procedures involved in getting cargo released by Customs through designated formalities such as presenting import license/permit, payment of import duties and other required documentations by the nature of the cargo. In this regard, a customs broker is a person or company licensed by the respective department of the country to act on behalf of freight importers and exporters. |
| Dangerous Goods | Dangerous goods (or hazardous materials or HAZMAT) include flammable liquids/solids, gases (compressed, liquified, dissolved under pressure), corrosives, oxidising substances, explosive substances and articles, substances which on contact with water emit flammable gasses, organic peroxides, toxic substances, infectious substances, radioactive materials, miscellaneous dangerous goods and articles. |
| First mile Delivery | First mile delivery refers to the (i) first stage of the freight/shipment/cargo/courier transportation (ii) the transportation of goods from a merchant’s premises or warehouse to the next fulfillment centre/warehouse/hub from where the goods are forwarded (iii) shipping goods from local distribution centers to stores (For retailers) (iv) transportation of finished goods from a plant or a factory to a distribution center (For manufacturers), (v) pick up of goods from the end-customer’s home or store followed by movement to a warehouse or storage location (movers and packers), (vi) process where goods are picked up from a retailer and then transferred to third-party logistics providers or courier service providers to be delivered to the end-consumer (e-commerce). Once the package reaches the next warehouse or the courier’s hub, it is then sorted and transported further until it reaches the customer’s doorstep. Example, if one chooses UPS as a courier, first-mile delivery will be the product being delivered from manufacturer's/retailer's warehouse to the UPS’s warehouse/ fulfilment centre. |
| Last Mile Delivery | Last mile delivery refers to the very last step of the delivery process when a parcel is moved from a transportation hub (warehouse or a distribution center or fulfillment centre) to its final destination, which usually is a personal residence/retail store/ business, or parcel locker. It accounts for around half of the total cost involved in entire process of first mile, middle mile, and last mile delivery, though it can vary shipment to shipment, based on commodity, business model and similar factors. |
| Milkrun | A Milk Run is a delivery method used to transport mixed loads from various suppliers to one customer, using lean management principles applied to logistics. Instead of each supplier sending a truck every week to meet the needs of one customer, one truck (or vehicle) visits the suppliers to pick up the loads for that customer. This method of transport got its name from the dairy industry practice, where one tanker used to collect milk from several dairy farms for delivery to a milk processing company. A milk run can be a more efficient way to handle logistics but require proper planning. If the route involves products from different companies, there is need for an agreement about cost-sharing and other aspects of the cooperative delivery arrangement. Once the group settles these issues, this delivery method can save time and money for everyone by pooling operation costs and resources. |
| Multi country consolidation | Multi-Country Consolidation (MCC) is a cost-effective solution that consolidates one's cargo from different countries of origin to build Full Container Loads (FCL). MCC is most suitable for companies that import light volumes of goods from multiple countries but want to take advantage of the more economic FCL freight rates. Apart from costing some of the other advantages include (i) flexibility to choose suppliers from a wider range of origin countries without worrying about the logistics to final destination from each origin, (ii) ability to pick the most suitable suppliers from many different countries for one's business operations. The increase in one's sourcing options by MCC provides the kind of flexibility needed in competitive global markets. |
| Q-commerce | Q-commerce, also referred to as quick commerce, is a type of e-commerce where emphasis is on quick deliveries, typically in less than an hour. The companies providing Q-Commerce services might have vertically intergrated model or might be using third party delivery platforms (outsourced logistics). It has advantages like (i) competitve USP, (ii) potential to earn greater profit margins, (iii) better customer experience, (iv) guaranteed availability of products, (v) traceability, and (vi) scaleability. |
| ReverseLogistics | Reverse logistics is a type of supply chain management that moves goods from customers back to the sellers or manufacturers and may involve ciruclar economy principles (3Rs) viz. recycling, reuse (repurposing, reselling), reducing or repairing. In this regard, reverse commerce (or Recommerce) is the selling of previously owned items through physical or online marketplaces/distribution channels to buyers who reuse, recycle or resell them. |


Research Methodology
Mordor Intelligence follows a four-step methodology in all our reports.
- Step-1: Identify Key Variables: In order to build a robust forecasting methodology, the variables and factors identified in Step-1 are tested against available historical market numbers. Through an iterative process, the variables required for market forecast are set and the model is built on the basis of these variables.
- Step-2: Build a Market Model: Market-size estimations for the forecast years are in nominal terms. Inflation is considered to be a part of the pricing, and the average selling price (ASP) is varying throughout the forecast period for each country
- Step-3: Validate and Finalize: In this important step, all market numbers, variables and analyst calls are validated through an extensive network of primary research experts from the market studied. The respondents are selected across levels and functions to generate a holistic picture of the market studied.
- Step-4: Research Outputs: Syndicated Reports, Custom Consulting Assignments, Databases & Subscription Platforms


