Egypt Courier, Express, And Parcel (CEP) Market Size and Share
Market Overview
| Study Period | 2020 - 2031 |
|---|---|
| Forecast Data Period | 2026 - 2031 |
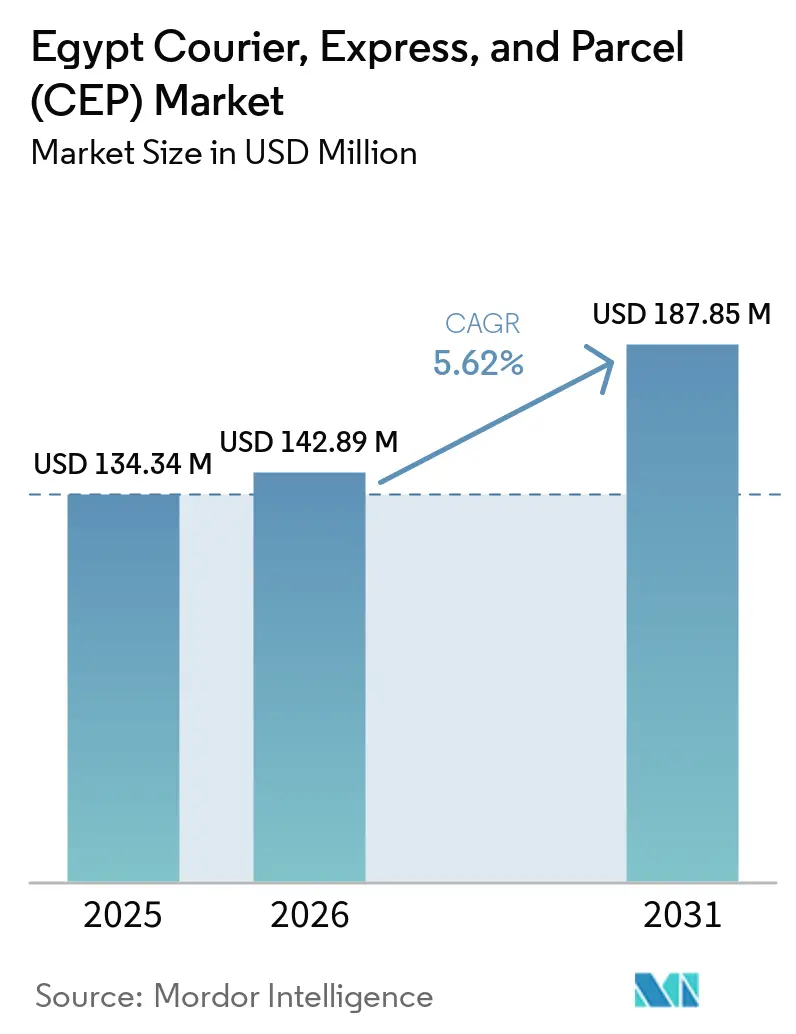
| Base Year Market Size (2025) | USD 134.34 Million |
| Market Size (2026) | USD 142.89 Million |
| Market Size (2031) | USD 187.85 Million |
| Growth Rate (2026 - 2031) | 5.62% CAGR |
| Market Concentration | Medium |
Major Players *Disclaimer: Major Players sorted in no particular order Image © Mordor Intelligence. Reuse requires attribution under CC BY 4.0. | |
Egypt Courier, Express, And Parcel (CEP) Market Analysis by Mordor Intelligence
The Egypt courier, express, and parcel market size is projected to expand from USD 134.34 million in 2025 and USD 142.89 million in 2026 to USD 187.85 million by 2031, registering a CAGR of 5.62% between 2026 and 2031.
Trends and Insights, e-commerce volumes expand as the Nafeza single-window clears compliant parcels in less than a day, while pharmaceutical cold-chain demand lifts premium express volumes. A rebound in Cairo-GCC-China belly-hold capacity trims long-haul times, and National Telecom Regulatory Authority (NTRA) mandates for AI-based dynamic routing unlock double-digit operating-cost savings. Price-sensitive consumers keep non-express services dominant, yet technology-driven efficiencies are gradually making time-definite options attractive in secondary cities.
Key Report Takeaways
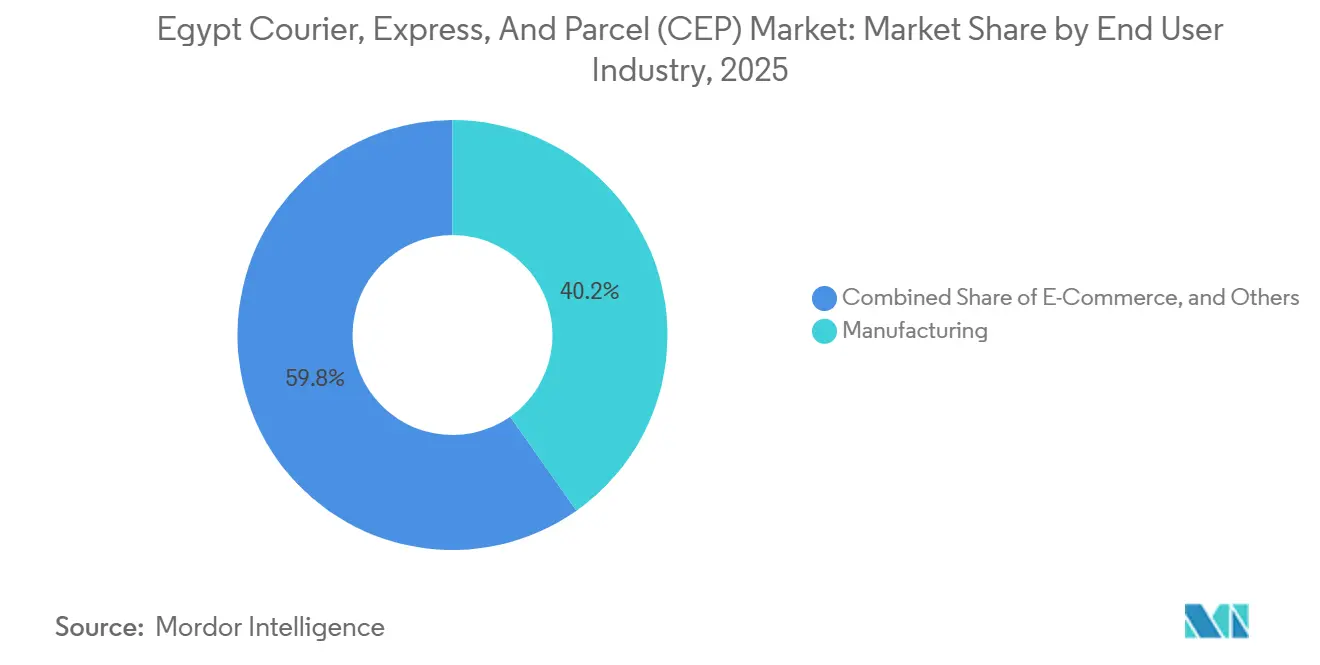
- By end user, manufacturing led with 40.22% of the Egypt courier, express, and parcel market share in 2025, while e-commerce is forecast to post the fastest 6.13% CAGR through 2031.
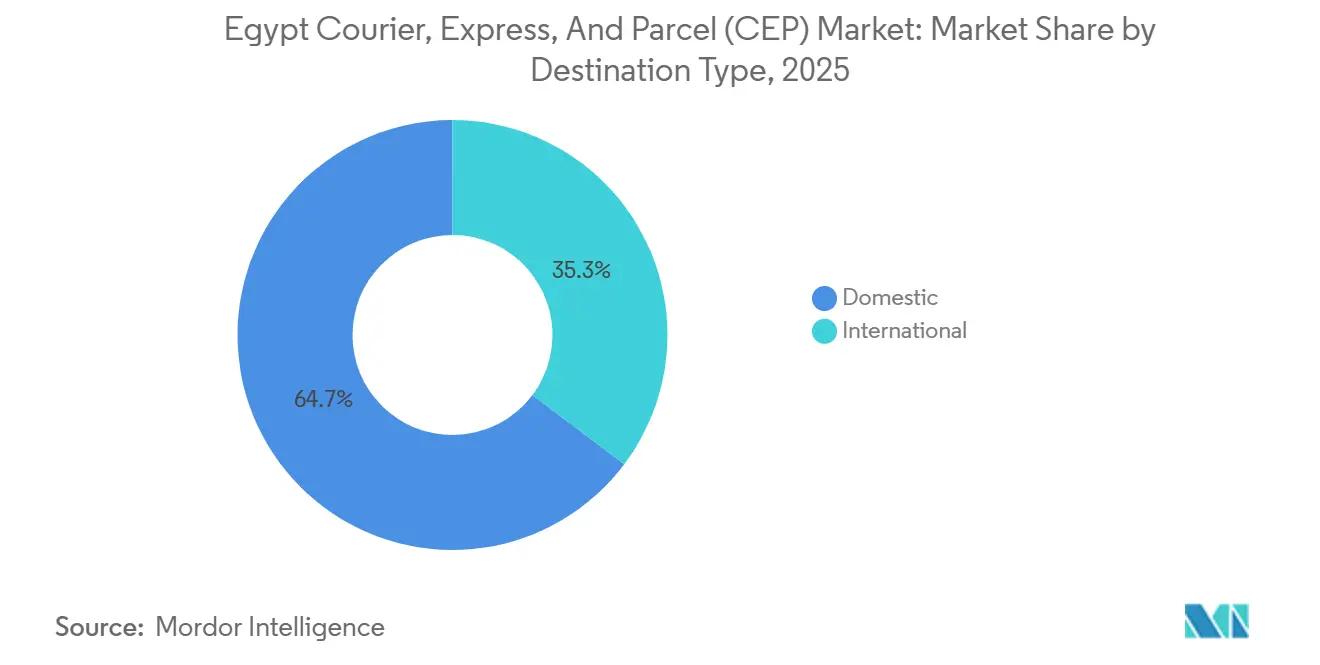
- By destination type, domestic parcels accounted for 64.74% of the Egypt courier, express, and parcel market size in 2025, whereas international values are projected to record the highest 5.83% CAGR over 2026-2031.
- By model, B2C shipments comprised 54.64% of the Egypt courier, express, and parcel market share in 2025 and will expand at the fastest 7.31% CAGR to 2031.
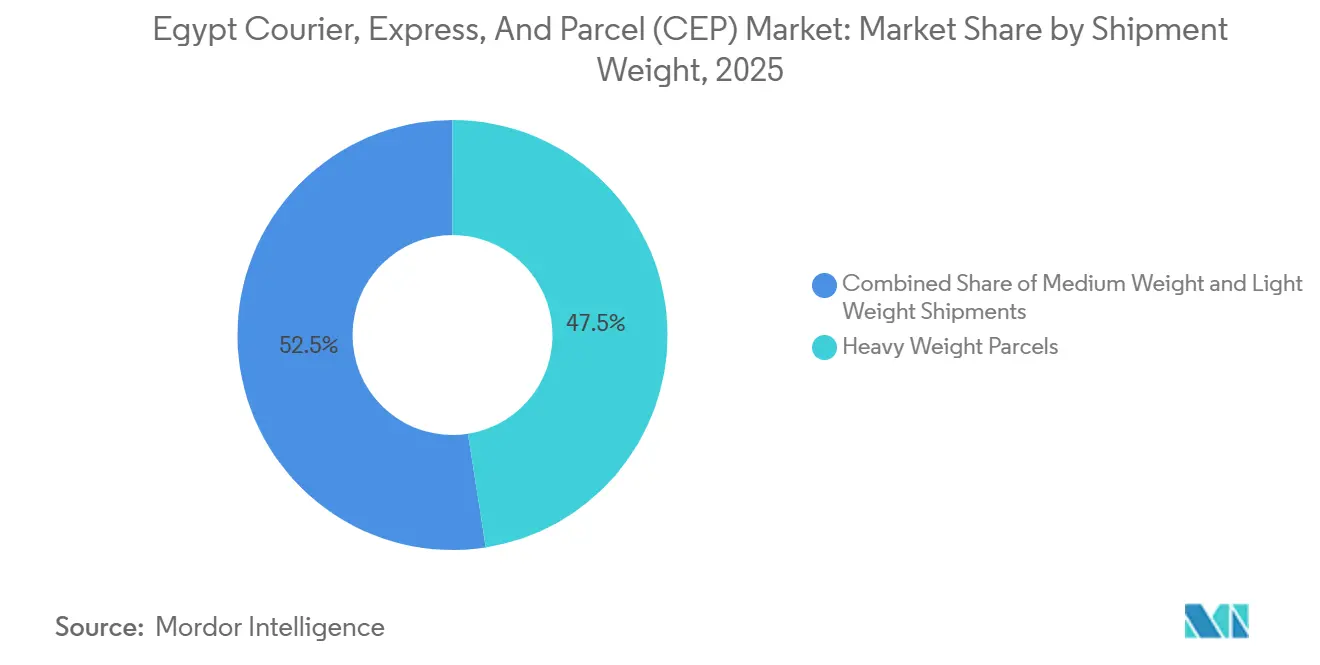
- By shipment weight, heavy parcels exceeding 31.5 kg held 47.52% of the 2025 market size, yet light parcels under 5 kg are expected to advance at a leading 6.19% CAGR during the forecast window.
- By speed of delivery, non-express services controlled 76.44% marlet share of 2025, although express offerings are projected to widen at a 6.50% CAGR thanks to NTRA-mandated AI routing.
- By mode of transport, road captured 50.38% of market share in 2025, while air freight is anticipated to expand at a 6.34% CAGR, supported by restored belly-hold capacity on Cairo-GCC-China lanes.
Note: Market size and forecast figures in this report are generated using Mordor Intelligence’s proprietary estimation framework, updated with the latest available data and insights as of 2026.
Egypt Courier, Express, And Parcel (CEP) Market Trends and Insights
Drivers Impact Analysis*
| Driver | (~) % Impact on CAGR Forecast | Geographic Relevance | Impact Timeline |
|---|---|---|---|
| Surge in cross-border e-commerce enabled by Advance Cargo Information (ACI) and Nafeza single-window | +0.8% | National, with concentration in Cairo, Alexandria, Port Said customs zones | Short term (≤ 2 years) |
| Cold-chain parcel expansion driven by universal health coverage roll-out and biologics demand | +0.7% | National, prioritizing Greater Cairo, Alexandria, and governorate capitals | Medium term (2-4 years) |
| Rapid deployment of parcel-locker networks at metro stations and bank branches boosting first-attempt success | +0.6% | Greater Cairo, Alexandria, with phased rollout to Giza, Qalyubia | Short term (≤ 2 years) |
| Recovery of belly-hold capacity plus new dedicated freighters on Cairo-GCC-China lanes shortening line-haul times | +0.5% | International segments, Cairo Airport hub, Borg El Arab cargo terminal | Short term (≤ 2 years) |
| AI-based dynamic-routing compliance mandated by NTRA cutting cost-per-stop for operators | +0.4% | National, with early adoption in Cairo, Alexandria, Giza metropolitan areas | Medium term (2-4 years) |
| Green-mobility incentives funding electric 2- and 3-wheeler fleets and carbon-credit monetisation | +0.4% | Urban centers, Cairo, Alexandria, with pilot programs in New Administrative Capital | Long term (≥ 4 years) |
| Source: Mordor Intelligence | |||
Surge in Cross-Border E-Commerce Enabled by Advance Cargo Information and Nafeza Single-Window
The Nafeza platform processed more than 2.3 million declarations in 2024, reducing clearance times from seven days to under 24 hours and boosting Egypt’s attractiveness to sellers on Alibaba and Shein. Harmonized System integration now automates tariff classification for almost all consumer goods, cutting disputes and storage penalties. Real-time duty calculation lets consignees pay through mobile wallets, eliminating courier cash collection. Merchant misclassification remains a drag, with 12-15% error rates that prompt spot checks. The 2025 rule requiring parcels to carry ACI data four hours before departure forces non-compliant carriers to upgrade their IT systems or exit, consolidating volumes among tech-ready operators.
Cold-Chain Parcel Expansion Driven by Universal Health Coverage and Biologics
Universal health coverage already insures 58 million Egyptians and requires GDP-certified couriers for home-delivered biologics. DHL’s 2024 launch of a 2-8 °C parcel service sets a premium benchmark. Rising domestic vaccine output at VACSERA and a 34% surge in biologic imports in 2024 add shipment flows that command higher tariffs. Infrastructure gaps in Upper Egypt force dry-ice use, inflating per-parcel costs by up to 60%. Power-backup shortfalls and limited cold storage outside metros remain critical constraints despite policy support[1]“Universal health coverage in Egypt,” World Health Organization, who.int.
Rapid Parcel-Locker Deployment at Metro Stations and Bank Branches
Cairo Metro piloted 50 smart lockers in 2024, lifting first-delivery success from 68% to 87% in affected zones. Commercial International Bank added 120 branch lockers the same year, extending its reach into secondary cities. Bulk drops trim courier labor outlays by up to 30%. Egypt Post’s 200-locker tender signals mainstream acceptance, though local-manufacture rules slow deployment. SMS-code failures in low-coverage areas trigger 8-12% locker aborts, and pending privacy guidelines keep smaller startups cautious[2]“Cairo Metro installs smart parcel lockers at 15 stations,” Cairo Metro Authority, cairometro.gov.eg.
Recovery of Belly-Hold Capacity Plus New Dedicated Freighters on Cairo-GCC-China Lanes
EgyptAir Cargo restored pre-pandemic schedules on Guangzhou routes, and Emirates SkyCargo added a third weekly freighter in Q4 2024, slicing China-to-Cairo delivery to 4-5 days. Additional Turkish Airlines capacity gives European alternatives that avoid congested hubs. Air-freight rates fell roughly 15% year over year, making express viable for parcels of USD 50 or more. Red Sea security issues forced some rerouting, adding 3-4 days on certain lanes, but ECAA’s 2025 liberalization should attract more Asian carriers and stabilize schedules.
Restraints Impact Analysis*
| Restraint | (~) % Impact on CAGR Forecast | Geographic Relevance | Impact Timeline |
|---|---|---|---|
| High cash-on-delivery (COD) fraud rates inflating reverse-logistics expenses | -0.5% | National, with higher incidence in secondary cities and rural areas | Short term (≤ 2 years) |
| Courier wage inflation outpacing tariff revisions amid double-digit CPI | -0.4% | National, with acute pressure in Greater Cairo and Alexandria labor markets | Short term (≤ 2 years) |
| Shortage of micro-fulfilment real estate in Greater Cairo following commercial property price spikes | -0.3% | Greater Cairo, Giza, Qalyubia governorates | Medium term (2-4 years) |
| Regulatory limbo on UAV low-altitude corridors delaying drone-delivery pilots | -0.2% | Urban centers, with potential for rural applications pending regulatory clarity | Long term (≥ 4 years) |
| Source: Mordor Intelligence | |||
High Cash-on-Delivery Fraud Rates Inflating Reverse-Logistics Expenses
COD fraud topped 8% of parcel volumes in 2024, burning USD 11-14 million in annual sector costs as undeliverable items travel the network twice. AI-based screens cut fraud at Mylerz by 35% but block up to 8% legitimate orders. InstaPay fee waivers aim to nudge digital payments, yet COD still covers 62% of e-commerce transactions. Couriers levy 3-5% COD surcharges to offset risk, feeding a price war among operators advertising free[3]“Extending the exemption of individuals from InstaPay fees,” Central Bank of Egypt, cbe.org.eg.
Courier Wage Inflation Outpacing Tariff Revisions
Driver pay jumped 18-20% over 2024-2025 as ride-hailing apps lured labor, while tariffs rose barely half that pace. Fuel-subsidy cuts doubled motorcycle refueling costs, forcing companies to add allowances. FedEx shifted 30% of its Cairo fleet to contractor status in 2024, yet pending labor-law amendments threaten reclassification. Persistent inflation keeps margin pressure acute, accelerating attrition at smaller couriers[4]“Courier sector faces margin pressure as wages outpace tariff growth,” Egypt Independent, egyptindependent.com.
*Our forecasts treat driver/restraint impacts as directional, not additive. The impact forecasts reflect baseline growth, mix effects, and variable interactions.
Segment Analysis
By End User: Manufacturing Leads, E-Commerce Accelerates
Manufacturing generated 40.22% of the Egypt courier, express, and parcel market share in 2025, reflecting stable demand from automotive parts and pharmaceutical distribution that rely on predictable bulk volumes. E-commerce, however, will record the swiftest 6.13% CAGR to 2031 as Amazon Egypt rolled out same-day service in Greater Cairo. The Egypt courier, express, and parcel market size linked to online retail consequently widens even as document deliveries from financial services stagnate.
The Egypt courier, express, and parcel market continues to pivot toward direct-to-consumer flows, powered by 70 million internet users and Fawry’s 2 billion digital transactions logged in 2024. Healthcare parcels gain from chronic-disease home-treatment mandates, while primary industries remain a small, volatile contributor.


By Destination Type: Domestic Dominance, International Momentum
Domestic parcels represented 64.74% of the Egypt courier, express, and parcel market size in 2025, anchored in the Cairo-Alexandria-Giza triangle. International flows, though smaller, are forecast to grow 5.83% annually due to faster customs clearance through Nafeza.
The Egypt courier, express, and parcel market share for international shipments rises as Alibaba and Shein exploit 4-5-day China-to-Cairo transits. Domestic growth is tempered by address-data gaps in Upper Egypt, yet newly built highways are shrinking journey times and expanding next-day coverage.
By Speed of Delivery: Non-Express Rules, Express Gains Niche
Non-express held 76.44% market size of 2025 revenue because 70% of Egyptian shoppers favor low cost over speed. Time-definite services, however, will climb 6.50% annually, buoyed by pharmaceutical cold-chain needs and stricter service-level guarantees from retailers.
NTRA route-optimization rules raise on-time performance, narrowing the reliability gap between standard and express tiers. Refund guarantees from FedEx Egypt underscore the growing emphasis on certainty rather than mere velocity.
By Shipment Weight: Light Parcels Gain Traction
Heavy parcels above 31.5 kg retained 47.52% market share in 2025, sustained by industrial parts. Yet light parcels under 5 kg will log the top 6.19% growth rate, mirroring fashion and electronics order profiles.
AI-enhanced route planning lets vans carry 80-100 lightweight items, driving unit costs below EGP 20. The Egypt courier, express, and parcel market size attached to heavy items trends flat as specialized freight forwarders undercut courier pricing for bulk shipments.
By Mode of Transport: Road Core, Air Premium
Road captured 50.38% market share in 2025, benefiting from 4,500 km of new highways. Air freight is projected to grow 6.34% a year by hauling biologics and consumer electronics that justify tariffs triple those of road transport.
Red Sea security detours momentarily dented sea-air options, yet EgyptAir Cargo and Emirates SkyCargo additions reinforce air’s role for high-value parcels. Rail remains marginal, though Egyptian National Railways offers cost-effective alternatives on Cairo-Aswan hauls.
By Model: B2C Outperforms Other Formats
B2C commanded 54.64% market share in 2025 and will accelerate at 7.31% CAGR thanks to parcel-locker uptake and improved digital payments. B2B traffic holds nearly one-third of turnover but feels pricing pressure from freight-matching apps.
Consumer-to-consumer shipments stay niche at under 20% share as fraud concerns curb high-value trades. Nonetheless, the social-commerce boom ensures incremental growth for small parcels moving between individuals.
Geography Analysis
Greater Cairo’s 20 million residents produce the densest 15-20 parcels per 1,000 people daily, underpinning 60% of national e-commerce volumes. Warehouse rents ballooned 22% in 2024, pushing couriers toward multi-tier networks that combine peripheral hubs with downtown micro-fulfillment. Alexandria leverages port proximity for same-day customs clearance, but grapples with narrow streets that cap courier stops per hour well below Cairo’s planned suburbs.
International traffic grows on the back of Nafeza acceleration and belly-hold capacity recovery, with China-origin parcels rising 28% in 2024. Egypt’s participation in the Pan-African Payment and Settlement System promises smoother intra-African flows, though volumes are still small. Upper Egypt remains logistics-challenged; nevertheless, the completed Cairo-Aswan highway now enables two-day delivery where three- to four-day service once prevailed.
Smart-locker schemes in metro stations expand first-attempt success to 87% in pilot areas, and 200 more lockers from Egypt Post will extend coverage in 2026. Free zones around the Suez Canal account for almost half of non-oil exports, creating concentrated express-parcel demand that specialized couriers already serve.
Competitive Landscape
International giants DHL, FedEx, and Aramex capitalize on global networks and GDP-certified cold-chain assets. Tech-centric locals such as Bosta and Mylerz differentiate through AI routing, fraud analytics, and COD familiarity suited to Egypt’s 62% cash preference. NTRA’s USD 200,000 compliance hurdle for dynamic routing accelerates market thinning as smaller players exit or consolidate.
Green-fleet subsidies allowed Aramex and Egypt Post to order 800 electric vehicles in 2024, signaling a first-mover advantage in zero-emission last-mile services. Start-ups exploit overlooked niches; Sprint caters to micro-merchants with as few as 30 monthly orders, while HitchHiker crowdsources capacity from travelers for cross-border parcels. Address-mapping gaps in Upper Egypt create a moat for local operators fluent in landmark navigation.
International parcel specialists eye Egypt’s accelerating outbound sample traffic, yet Red Sea route disruptions and drone-regulation delays temper aggressive expansion. Success now hinges on technology uptake and the ability to balance premium express growth against enduring price sensitivity in the bulk of the Egypt courier, express, and parcel market.
Egypt Courier, Express, And Parcel (CEP) Industry Leaders
Aramex
DHL Group
Mylerz
FedEx
Egypt Post
- *Disclaimer: Major Players sorted in no particular order

Recent Industry Developments
- March 2026: Egypt Post signed a cooperation protocol with the Internal Trade Development Authority (ITDA) to provide commercial registry services through its network of over 4,238 post offices nationwide.
- January 2026: Bosta opened the Middle East's largest automated sorting hub in Cairo City, investing over USD 5 million to address growing e-commerce volumes. The facility processed 11,000 parcels per hour (over 250,000 daily), increasing capacity from 100,000 to over 6 million parcels monthly across 50+ nationwide hubs.
- December 2025: Amazon Egypt expanded its storage capacity to over 100,000 cubic meters, adding facilities equivalent to ten football fields on Suez Road and in 10th of Ramadan. This expansion addressed increased demand for essentials due to inflation and currency fluctuations, while a local manufacturing surge in apparel, home goods, and accessories supported e-commerce growth.
- July 2025: Egypt Post partnered with Cote d'Ivoire Post to strengthen regional ties and enhance digital postal services.


Egypt Courier, Express, And Parcel (CEP) Market Report Scope
| Domestic |
| International |
| Express |
| Non-Express |
| Business-to-Business (B2B) |
| Business-to-Consumer (B2C) |
| Consumer-to-Consumer (C2C) |
| Heavy Weight Shipments |
| Light Weight Shipments |
| Medium Weight Shipments |
| Air |
| Road |
| Others |
| E-Commerce |
| Financial Services (BFSI) |
| Healthcare |
| Manufacturing |
| Primary Industry |
| Wholesale and Retail Trade (Offline) |
| Others |
| By Destination | Domestic |
| International | |
| By Speed of Delivery | Express |
| Non-Express | |
| By Model | Business-to-Business (B2B) |
| Business-to-Consumer (B2C) | |
| Consumer-to-Consumer (C2C) | |
| By Shipment Weight | Heavy Weight Shipments |
| Light Weight Shipments | |
| Medium Weight Shipments | |
| By Mode of Transport | Air |
| Road | |
| Others | |
| By End User Industry | E-Commerce |
| Financial Services (BFSI) | |
| Healthcare | |
| Manufacturing | |
| Primary Industry | |
| Wholesale and Retail Trade (Offline) | |
| Others |


Market Definition
- Courier, Express, and Parcel - The Courier, Express, and Parcel services, often called as CEP Market, refers to the logistics and postal service providers which specialize in moving small goods (parcels/packages). It captures the overall market size (USD) and market volume (number of parcels) of (1) the shipments/parcels/packages which are under 70kgs/ 154lbs weight, (2) Business Customer packages viz. Business-to-Business (B2B) & Business-to-Consumer (B2C) as well as private customer packages (C2C), (3) non-express parcel delivery services (Standard and Deferred) as well as express parcel delivery services (Day-Definite-Express and Time-Definite-Express), (4) domestic as well as international shipments.
- Demographics - To analyse total addressable market demand, population growth & forecasts have been studied and presented in this industry trend. It represents population distribution across categories like gender (male/female), development area (urban/rural), major cities among other key parameters like population density and final consumption expenditure (growth and share % of GDP). This data has been used for assessing the fluctations in demand & consumption expenditure, and the major hotspots (cities) of potential demand.
- Domestic Courier Market - Domestic Courier Market refers to the CEP shipments wherein the origin and destination is within the boundary of the geography studied (country or region as per the scope of report). It captures the market size (USD) and market volume (number of parcels) of (1) the shipments/parcels/packages which are under 70kgs/ 154lbs weight, including light weight shipments, medium weight shipments and heavy weight shipments (2) Business Customer packages viz. Business-to-Business (B2B) & Business-to-Consumer (B2C) as well as private customer packages (C2C), (3) non-express parcel delivery services (Standard and Deferred) as well as express parcel delivery services (Day-Definite-Express and Time-Definite-Express).
- E-Commerce - This end user industry segment captures the external (outsourced) logistics expenditure incurred by the e-tailers, through online sales channel, on Courier, Express, and Parcel (CEP) services. The scope includes (i) the supply chain of a company's online customer orders being fulfilled, (ii) the process of getting a product from the point of manufacturing to the point at which it is delivered to consumers. It involves managing inventory (deferred as well as time critical), shipping, and distribution.
- Export Trends and Import Trends - Overall logistics performance of an economy is positively and significantly (statistically) correlated to its trade performance (exports and imports). Hence, in this industry trend, total value of trade, major commodities/ commodity groups and the major trade partners, for the studied geography (country or region as per the scope of report) have been analysed alongside the impact of major trade/logistics infrastructure investments & regulatory environment.
- Financial Services (BFSI) - This end user industry segment captures the external (outsourced) logistics expenditure incurred by the BFSI players, on Courier, Express, and Parcel (CEP) services. CEP is important to the financial services industry in shipping of confidential documents and files. The establishments in this sector are engaged in (i) financial transactions (that is, transactions involving the creation, liquidation, or change in ownership of financial assets) or in facilitating financial transactions, (ii) financial intermediation, (iii) the pooling of risk by underwriting annuities and insurance, (iv) providing specialized services that facilitate or support financial intermediation, insurance and employee benefit programs, and (v) monetary control - the monetary authorities.
- Fuel Price - Fuel price spikes can cause delays and diruption for logistics service providers (LSPs), while drops in the same can result in higher short-term profitability and increased market rivalry to offer consumers with the best deals. Hence, the fuel price variations have been studied over the review period and presented along with the causes as well as market impacts.
- GDP Distribution by Economic Activity - Nominal Gross Domestic Product and distribution of the same, across major economic sectors in the geography studied (country or region as per scope of the report) have been studied and presented in this industry trend. As GDP is positively related to the profitability and growth of logistics industry, this data has been used in adjunction to the input-output tables/ supply-use tables for analyzing the potential major contributing sectors towards the logistics demand.
- GDP Growth by Economic Activity - Growth of Nominal Gross Domestic Product across major economic sectors, for the geography studied (country or region as per scope of the report) have been presented in this industry trend. This data has been utilized for assessing the growth of logistics demand from all the market end users (economic sectors considered here).
- Healthcare - This end user industry segment captures the external (outsourced) logistics expenditure incurred by the Healthcare players (Hospitals, clinics, mrdical centres) , on Courier, Express, and Parcel (CEP) services. The scope includes CEP services involved in the defrerred as well time critical movement of medical goods & supplies (surgical supplies and instruments, including gloves, masks, syringes, equipment). The establishments in this sector (i) include the ones providing medical care exclusively (ii) deliver services by trained professionals (iii) involve processes, including labor inputs of health practitioners with the requisite expertise (iv) are defined based on the educational degree held by the practitioners included in the industry.
- Inflation - Variations in both Wholesale Price Inflation (YoY change in producer price index) and Consumer Price Inflation have been presented in this industry trend. This data has been used to assess the inflationary environment as it plays a vital role in smooth functioning of the supply chain, directly impacting the logistics operational cost components e.g., pricing of tyres, driver wages & benefits, energy/fuel prices, maintenace costs, toll charges, warehousing rents, custom brokerage, forwarding rates, courier rates etc. hence impacting the overall freight and logistics market.
- Infrastructure - As infrastructure plays a vital role in an economy's logistics performance, variables like length of roads, distribution of road length by surface category (paved v/s unpaved), distribution of road length by road classification (expressways v/s highways v/s other roads), rail length, volume of containers handled by major ports and tonnage handled by major airports have been analysed and presented in this industry trend.
- International Express Service Market - International Express Service Market refers to the CEP shipments wherein the origin or destination is not within the boundary of the geography studied (country or region as per the scope of report). It captures the market size (USD) and market volume (number of parcels) of (1) the shipments/parcels/packages which are under 70kgs/ 154lbs weight, including light weight shipments, medium weight shipments and heavy weight shipments (ii) Inter-Region as well as Intra-Region Shipments
- Key Industry Trends - The report section named "Key Industry Trends" include all the key variables/parameters studied to better analyze the market size estimates and forecasts. All the trends have been presented in the form of data points (time series or latest available data points) along with analysis of the paramter in the form of concise market relevant commentary, for the geography studied (country or region as per the scope of report).
- Key Strategic Moves - The action taken by a company to differentiate from its competitor or used as a general strategy is referred to as a key strategic move (KSM). This includes (1) Agreements (2) Expansions (3) Financial Restructuring (4) Mergers and Acquisitions (5) Partnerships, and (6) Product Innovations. Key players (Logistics Service Providers, LSPs) in the market have been shortlisted, their KSM have been studied and presented in this section.
- Logistics Performance - Logistics Performance and Logistics Costs are the backbone of trade, and influences trade costs, making countries compete globally. Logistics performance is influenced by market wide adopted supply chain management strategies, government services, investments & policies, fuel/ energy costs, inflationary environment etc. Hence, in this industry trend, the logistics performance of the geography studied (country/ region as per the scope of report) has been analysed and presented over the review period.
- Manufacturing - This end user industry segment captures the external (outsourced) logistics expenditure incurred by the Manufacturing industry (including Hi-Tech/Technology) players, on Courier, Express, and Parcel (CEP) services. The end user players considered are the establishments primarily engaged in the chemical, mechanical or physical transformation of materials or substances into new products. Logistics Service Providers (LSPs) play a crucial role in maintaining a smooth flow of raw materials across the supply chain, enabling timely delivery of finished goods to distributors or end customers and storing & supplying the raw materials to clients for just-in-time manufacturing.
- Other End Users - Other end user segment captures the external (outsourced) logistics expenditure incurred by the construction, real estate, educational services, and professional services (administrative, waste management, legal, architectural, engineering, design, consulting, scientific R&D), on Courier, Express, and Parcel (CEP) services. Logistics Service Providers (LSPs) plays a crucial role in the reliable movement of time critical supplies and documents to/from these industries such as transporting any equipment or resources required, shipping confidential documents and files.
- Primary Industry - This end user industry segment captures the external (outsourced) logistics expenditure incurred by the AFF (Agriculture, Fishing, and Forestry) and Extraction indsutry (Oil &Gas, Quarrying and Mining) players, on Courier, Express, and Parcel (CEP) services. The end user players considered are the establishments (i) primarily engaged in growing crops, raising animals, harvesting timber, harvesting fish & other animals from their natural habitats and providing related support activities; (ii) that extract naturally occurring mineral solids, such as coal and ores; liquid minerals, such as crude petroleum; and gases, such as natural gas. Herein, Logistics Service Providers (LSPs) (i) play a crucial role in acquisition, storage, handling, transportation, and distribution activities for the optimal & continuous flow of inputs (seeds, pesticides, fertilizers, equipment, and water) from manufacturers or suppliers to the producers and smooth flow of output (produce, agro-goods) to distributors/ consumers; (ii) cover entire phases from upstream to downstream and play a crucial role in the transportation of machinery, drilling equipments, extracted minerals, crude oil & natural gas and refined/ processed products from one place to another. This includes both termperature controlled and non-temperature controlled logistics, as and when required according to the shelf life of goods being transported or stored.
- Producer Price Inflation - It indicates inflation from viewpoint of the producers viz. the average selling price received for their output over a period of time. Annual change (YoY) of producer price index is reported as wholesale price inflation in the "Inflation" industry trend. As WPI captures dynamic price movements in most comprehensive way, it is widely used by governments, banks, industry, business circles and is deemed important in formulation of trade, fiscal and other economic policies. The data has been used in adjunction to consumer price inflation for better understanding the inflationary environment.
- Segmental Revenue - Segmental Revenue has been triangulated or computed and presented for all the major players in the market. It refers to the courier, express, and parcel (CEP) market specific revenue earned by the company, over the base year of study, in the geography studied (country or region as per the scope of report). It is computed through the study and analysis of major parameters like financials, service portfolio, employee strength, fleet size, investments, number of countries present in, major economies of concern, etc. that have been reported by the company in its annual reports, webpage. For companies having scarce financial disclosures, paid databases like D&B Hoovers, Dow Jones Factiva have been resorted to and verified through industry/expert interactions.
- Transport and Storage Sector GDP - Value and growth of Transport and Storage Sector GDP has a direct relation to the freight and logistics market size. Hence, this variable has been studied and presented over the review period, in value terms (USD) and as share % of total GDP, in this industry trend. The data has been supported by concise and relevant commentary around the investments, developments, and current market scenario.
- Trends in E-Commerce Industry - Enhanced internet connectivity and boom in smartphone penetration, coupled with increasing disposable incomes, has led to a phenomenal growth in the e-commerce market globally. Online shoppers require fast and efficient delivery of their orders leading to an increase in the demand for logistics services especially e-commerce fulfilment services. Hence, the Gross Merchandise Value (GMV), historial and projected growth, breakup of major commodity groups in e-commerce industry for the studied geography (country or region as per scope of the report) have been analysed and presented in this industry trend.
- Trends in Manufacturing Industry - Manufacturing industry involves the transformation of raw materials into finished products, while logistics industry ensures the efficient flow of raw materials to the factory, and the transport of manufactured products to the distributors & consumers. Demand-Supply of both industries are highly cross-linked and critical for a seamless supply chain. Hence, the Gross Value Added (GVA), breakup of GVA into major manufacturing sectors, and growth of manufacturing industry over the review period have been analysed and presented, in this industry trend.
- Wholesale and Retail Trade (Offline) - This end user industry segment captures the external (outsourced) logistics expenditure incurred by the wholesalers and retailers, through offline sales channel, on Courier, Express, and Parcel (CEP) services. The end user players considered are the establishments primarily engaged in wholesaling or retailing merchandise, generally without transformation, and rendering services incidental to the sale of merchandise. Logistics Service Providers (LSPs) plays a crucial role in the reliable movement of supplies to and finished products from production houses to the distributors and finally to the end customer covering activites like material sourcing, transportation, order fulfillment, warehousing & storage, demand forecasting, inventory management etc.
| Keyword | Definition |
|---|---|
| Axle Load | The axle load refers to the total load (weight) bearing on the roadway through wheels connected to a given axle. Across the globe, there are systems in place to ensure axle load monitoring, wherein surpassing the defined limits set by the concerned regulatory authority can lead to penalty/fine. For transportation of goods via road this can be an important determinant of costs as knowledge about the axle load limits can be used to (i) load the vehicle optimally for maximizing profits (ii) avoid exceeding the same and hence the probable fines associated (iii) avoid wear and tear of the vehicle (iv) avoid damage to pavement resulting in noticeable public maintenance and repair costs (v) achieve better turnaround time. |
| Back Haul | Backhaul is the return movement of a transport vehicle from its original destination to its original point of departure, and can include full, partial, or empty truck loads (all or part of the way) depending on the visibility of the local freight ecosystem. In this regard, transportation of empty containers to the point of origin, known as deadheading is also a significant factor, considering the supply/container shortages across the geographies, resulting in cost escalation and under optimized profit potential attainment. Generally, the carriers offer discounts on the backhaul, to secure freight for the trip. |
| Bill of Lading (BOL) | A bill of lading is a legal contract document issued by a carrier to a shipper to acknowledge reception of their cargo, and is evidence for the contract of carriage between the two parties. Broadly it details the (i) type, quantity, and other specifications of the goods being carried (ii) destination, and terms & conditions of the shipment (iii) carrier and drivers with all the necessary information to process the shipment, which can be used for insurance and customs clearance purposes (iv) assurance that the consignment is damage-free and ready to be shipped to the consignee. In this regard, a house bill of lading (HBL) is a document issued by a freight forwarder or a non-vessel operating common carrier (NVOCC) to acknowledge receipt of items for shipment (to a shipper). If shipments from several shippers are involved a master bill of lading (MBL) might be involved which is a consolidated version of the same for all the shipments being taken care of by the carrier (to a common destination) and might be issued by the carrier to the freight forwarder or the shipper (depending on who books the transport). |
| Bunkering | Bunkering is the process of supplying fuel to power the propulsion system of a ship. It includes the logistics of loading and distributing the fuel among available shipboard tanks. In this regard, (i) Bunker fuel is technically any type of fuel oil used aboard ships. It gets its name from the containers on ships and in ports that it is stored in; in the days of steam they were coal bunkers but now they are bunker-fuel tanks, (ii) Bunker refers to the spaces (Tank) on board a vessel to store fuel, (iii) Bunker trader refers to a person dealing in trade of bunker (fuel), (iv) Bunker call is made when a cargo ship anchors or berths in a port to take on bunker oil or supplies, (v) Bunkering service is the supply of a requested quality and quantity of bunkers to a ship. Bunkering is signficant from point of view of freight rates applicable to the shipper as Bunker Contribution (BUC)/ Fuel Adjustment Factor (FAF)/ Bunker Adjustment Factor (BAF) are applied by shipping lines to offset the effect of fluctuations in the cost of bunkers. |
| Cabotage | Transport by a vehicle registered in a country, performed on the national territory of another country. Cabotage law may restrict domestic cargo traffic to be carried in its own nationally registered, and sometimes built and crewed vehicles, though regulations vary across industries/commodity groups/countries and sometimes specify maximum allowable percentage of cabotage that can be serviced by foreign registered fleet. |
| C-commerce | Collaborative commerce (also known as C-commerce), (i) describes electronically enabled business interactions among an enterprise’s internal personnel, business partners and customers throughout a trading community (industry, industry segment, supply chain or supply chain segment); (ii) is the optimization of supply and distribution channels to capitalize on the global economy by using new technology efficiently. Advantages of C-commerce, to detail few include (i) maximization of organization's efficiency and profitability (ii) technology integration with physical channels to allow companies to work together (iii) increased information exchange such as inventory and product specifications, using the web as an intermediary (iv) increased competitiveness by reaching a broader audience. Examples of C-commerce, also known as peer-to-peer commerce, include (i) companies that allow consumers to rent things from each other, or marketplaces, such as Meta (formerly Facebook) Marketplace, that allow the sale of used goods; (ii) DoorDash teamed up with many national brands, such as McDonald’s and Chipotle, to offer fast food delivery, building their business model on c-commerce. They have since expanded their delivery service from restaurants to retailers and even offer 'fleets' of drivers to businesses. |
| Courier | A business/company that delivers packages/parcels/shipments (upto 70 kgs) including quick door to door pickup and delivery service for goods or documents, domestically or internationally, on a commercial contract basis. Example, DHL Group, FedEx, United Parcel Service of America, Inc., USPS, International Distributions Services, J&T Express, SF Express among several others |
| Cross docking | Cross docking is a practice in logistics management that includes unloading incoming delivery vehicles and loading the materials directly into outbound delivery vehicles, omitting traditional warehouse logistical practices and saving time and money. It requires close synchronization of both inbound and outbound movements. It is highly significant in reduction of costs pertaining to warehousing & storage (and the associated Value Added Services). |
| Cross Trade | International transport between two different countries performed by a vehicle registered in a third country. A third country is a country other than the country of loading/embarkation and the country of unloading/disembarkation. Cross Trade law may restrict international cargo traffic to be carried by respective country's registered vehicles, and sometimes built and crewed vehicles, though regulations vary across industries/commodity groups/countries and sometimes specify maximum allowable percentage of cross trade that can be serviced by foreign registered fleet. |
| Customs Clearance | The process of declaring and clearing cargoes through customs. It includes the procedures involved in getting cargo released by Customs through designated formalities such as presenting import license/permit, payment of import duties and other required documentations by the nature of the cargo. In this regard, a customs broker is a person or company licensed by the respective department of the country to act on behalf of freight importers and exporters. |
| Dangerous Goods | Dangerous goods (or hazardous materials or HAZMAT) include flammable liquids/solids, gases (compressed, liquified, dissolved under pressure), corrosives, oxidising substances, explosive substances and articles, substances which on contact with water emit flammable gasses, organic peroxides, toxic substances, infectious substances, radioactive materials, miscellaneous dangerous goods and articles. |
| First mile Delivery | First mile delivery refers to the (i) first stage of the freight/shipment/cargo/courier transportation (ii) the transportation of goods from a merchant’s premises or warehouse to the next fulfillment centre/warehouse/hub from where the goods are forwarded (iii) shipping goods from local distribution centers to stores (For retailers) (iv) transportation of finished goods from a plant or a factory to a distribution center (For manufacturers), (v) pick up of goods from the end-customer’s home or store followed by movement to a warehouse or storage location (movers and packers), (vi) process where goods are picked up from a retailer and then transferred to third-party logistics providers or courier service providers to be delivered to the end-consumer (e-commerce). Once the package reaches the next warehouse or the courier’s hub, it is then sorted and transported further until it reaches the customer’s doorstep. Example, if one chooses UPS as a courier, first-mile delivery will be the product being delivered from manufacturer's/retailer's warehouse to the UPS’s warehouse/ fulfilment centre. |
| Last Mile Delivery | Last mile delivery refers to the very last step of the delivery process when a parcel is moved from a transportation hub (warehouse or a distribution center or fulfillment centre) to its final destination, which usually is a personal residence/retail store/ business, or parcel locker. It accounts for around half of the total cost involved in entire process of first mile, middle mile, and last mile delivery, though it can vary shipment to shipment, based on commodity, business model and similar factors. |
| Milkrun | A Milk Run is a delivery method used to transport mixed loads from various suppliers to one customer, using lean management principles applied to logistics. Instead of each supplier sending a truck every week to meet the needs of one customer, one truck (or vehicle) visits the suppliers to pick up the loads for that customer. This method of transport got its name from the dairy industry practice, where one tanker used to collect milk from several dairy farms for delivery to a milk processing company. A milk run can be a more efficient way to handle logistics but require proper planning. If the route involves products from different companies, there is need for an agreement about cost-sharing and other aspects of the cooperative delivery arrangement. Once the group settles these issues, this delivery method can save time and money for everyone by pooling operation costs and resources. |
| Multi country consolidation | Multi-Country Consolidation (MCC) is a cost-effective solution that consolidates one's cargo from different countries of origin to build Full Container Loads (FCL). MCC is most suitable for companies that import light volumes of goods from multiple countries but want to take advantage of the more economic FCL freight rates. Apart from costing some of the other advantages include (i) flexibility to choose suppliers from a wider range of origin countries without worrying about the logistics to final destination from each origin, (ii) ability to pick the most suitable suppliers from many different countries for one's business operations. The increase in one's sourcing options by MCC provides the kind of flexibility needed in competitive global markets. |
| Q-commerce | Q-commerce, also referred to as quick commerce, is a type of e-commerce where emphasis is on quick deliveries, typically in less than an hour. The companies providing Q-Commerce services might have vertically intergrated model or might be using third party delivery platforms (outsourced logistics). It has advantages like (i) competitve USP, (ii) potential to earn greater profit margins, (iii) better customer experience, (iv) guaranteed availability of products, (v) traceability, and (vi) scaleability. |
| ReverseLogistics | Reverse logistics is a type of supply chain management that moves goods from customers back to the sellers or manufacturers and may involve ciruclar economy principles (3Rs) viz. recycling, reuse (repurposing, reselling), reducing or repairing. In this regard, reverse commerce (or Recommerce) is the selling of previously owned items through physical or online marketplaces/distribution channels to buyers who reuse, recycle or resell them. |


Research Methodology
Mordor Intelligence follows a four-step methodology in all our reports.
- Step-1: Identify Key Variables: In order to build a robust forecasting methodology, the variables and factors identified in Step-1 are tested against available historical market numbers. Through an iterative process, the variables required for market forecast are set and the model is built on the basis of these variables.
- Step-2: Build a Market Model: Market-size estimations for the forecast years are in nominal terms. Inflation is considered to be a part of the pricing, and the average selling price (ASP) is varying throughout the forecast period for each country
- Step-3: Validate and Finalize: In this important step, all market numbers, variables and analyst calls are validated through an extensive network of primary research experts from the market studied. The respondents are selected across levels and functions to generate a holistic picture of the market studied.
- Step-4: Research Outputs: Syndicated Reports, Custom Consulting Assignments, Databases & Subscription Platforms


