Price Optimization Software Market Size and Share
Market Overview
| Study Period | 2020 - 2031 |
|---|---|
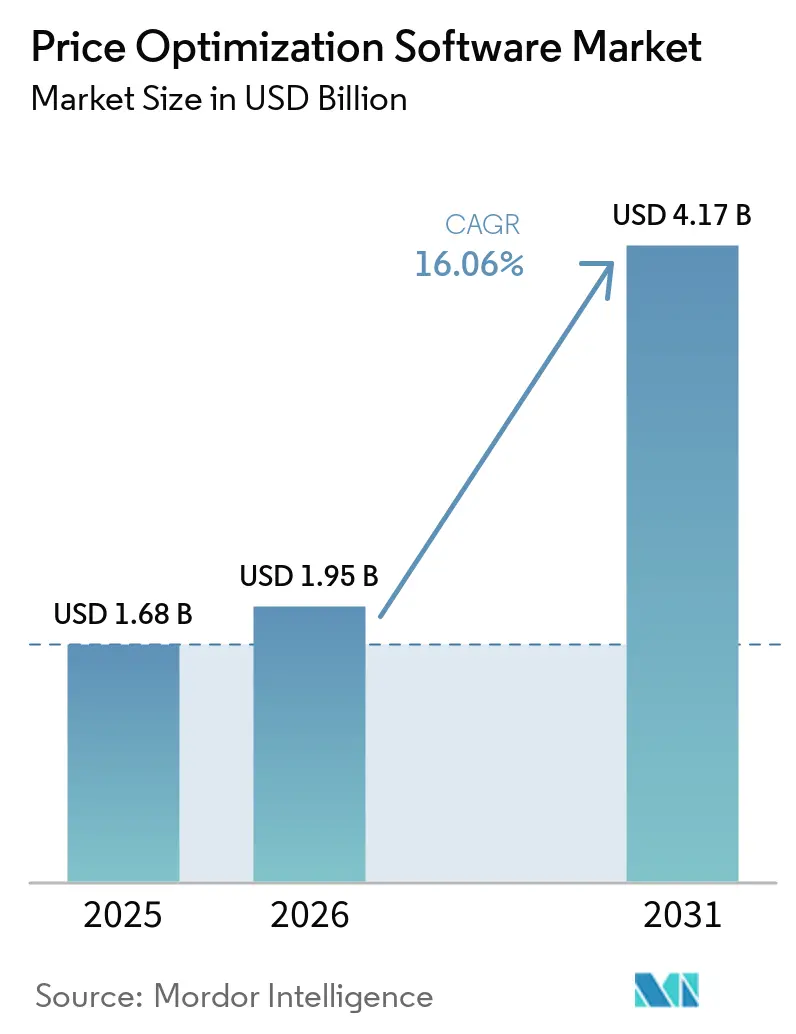
| Market Size (2026) | USD 1.95 Billion |
| Market Size (2031) | USD 4.17 Billion |
| Growth Rate (2026 - 2031) | 16.06% CAGR |
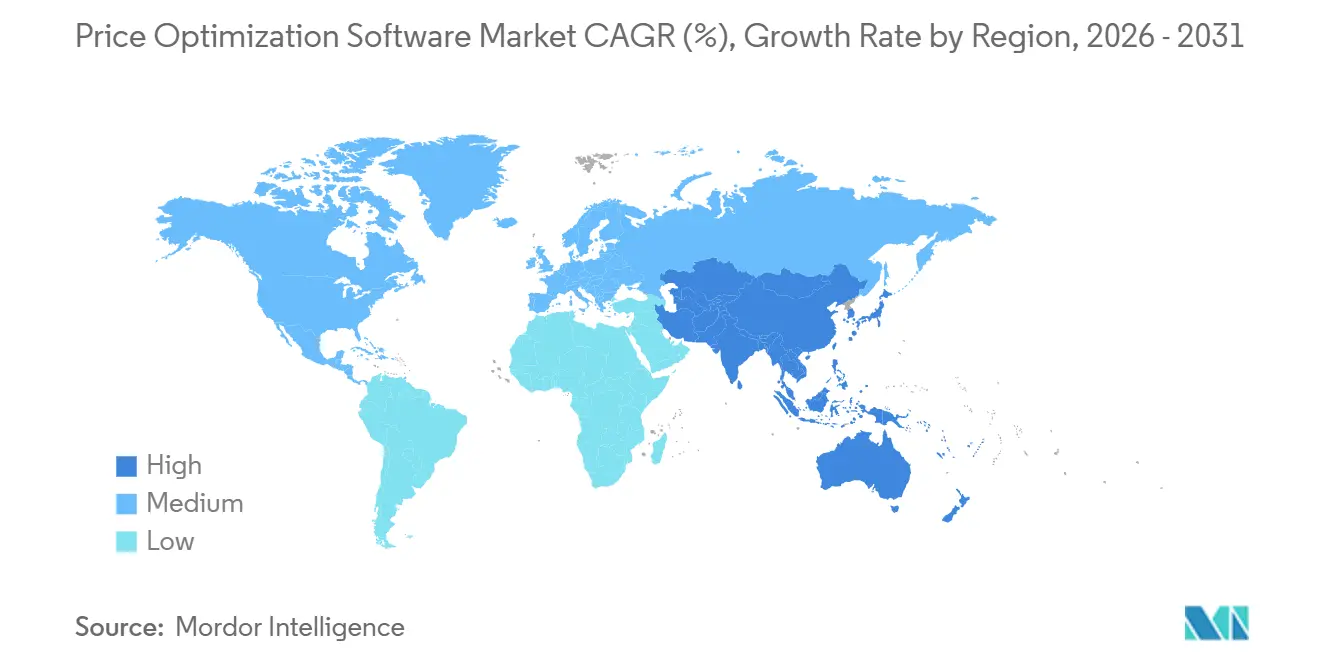
| Fastest Growing Market | Asia Pacific |
| Largest Market | North America |
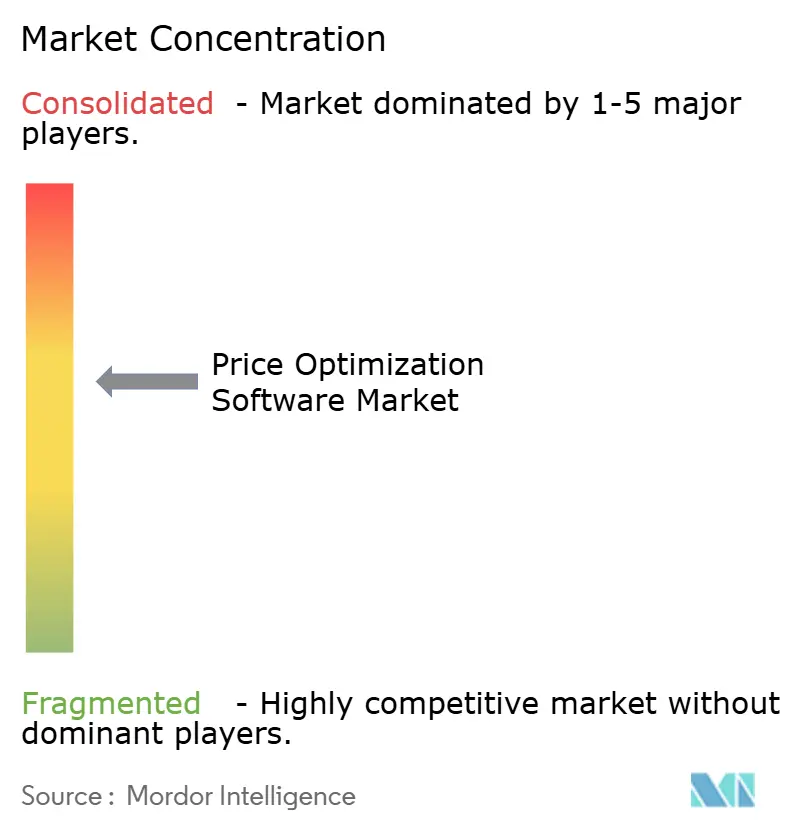
| Market Concentration | Medium |
Major Players *Disclaimer: Major Players sorted in no particular order Image © Mordor Intelligence. Reuse requires attribution under CC BY 4.0. | |
Price Optimization Software Market Analysis by Mordor Intelligence
The price optimization software market size is projected to expand from USD 1.68 billion in 2025 and USD 1.95 billion in 2026 to USD 4.17 billion by 2031, registering a CAGR of 16.06% between 2026 and 2031. Inflation-driven margin pressure, rising omnichannel complexity, and the proliferation of real-time data feeds have elevated algorithmic pricing from a tactical analytics tool to a board-level growth lever. Generative AI now embeds conversational guidance inside quoting workflows, turning software into a negotiation aide that sales teams deploy at the point of transaction. Cloud-native delivery compresses implementation cycles from months to weeks, while private-equity-backed consolidation is reshaping vendor positioning. At the same time, antitrust authorities in the United States and Europe are scrutinizing shared third-party platforms, compelling enterprises to invest in governance features that separate differentiation from collusion risk.
Key Report Takeaways
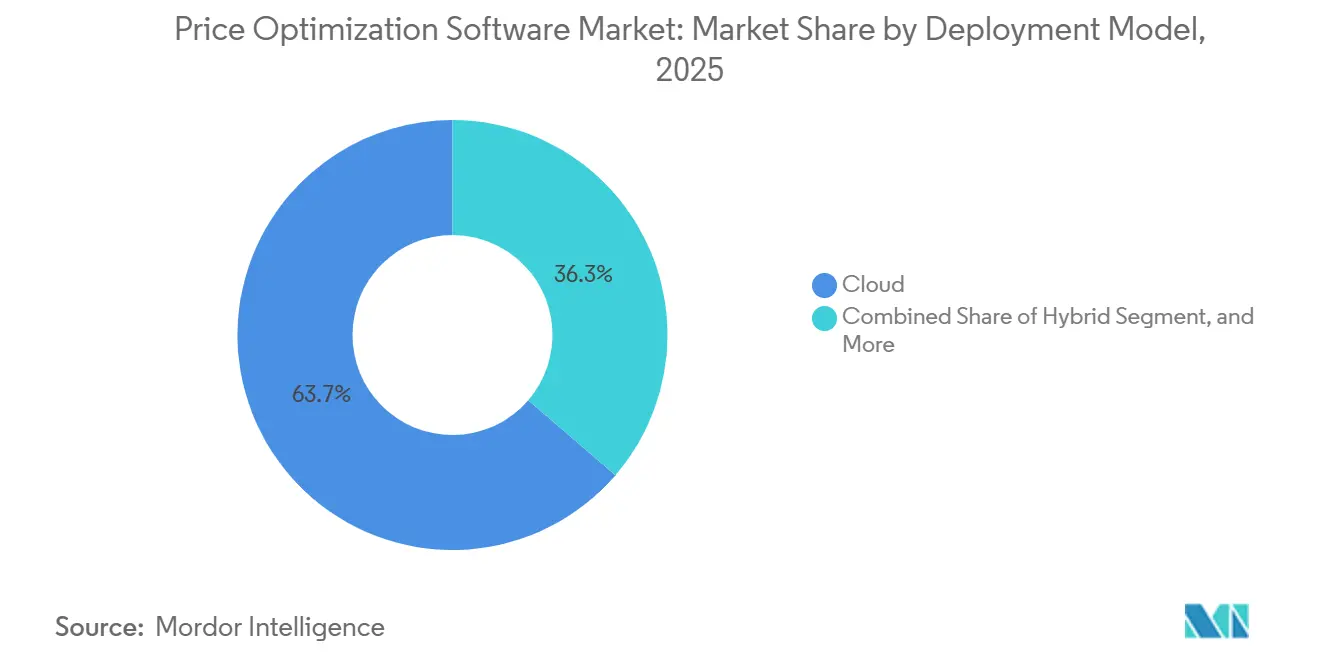
- By deployment model, cloud captured 63.7% of the price optimization software market share in 2025 and is projected to register a 17.1% CAGR through 2031.
- By pricing strategy type, AI-driven dynamic pricing commanded 47.4% of the price optimization software market share in 2025.
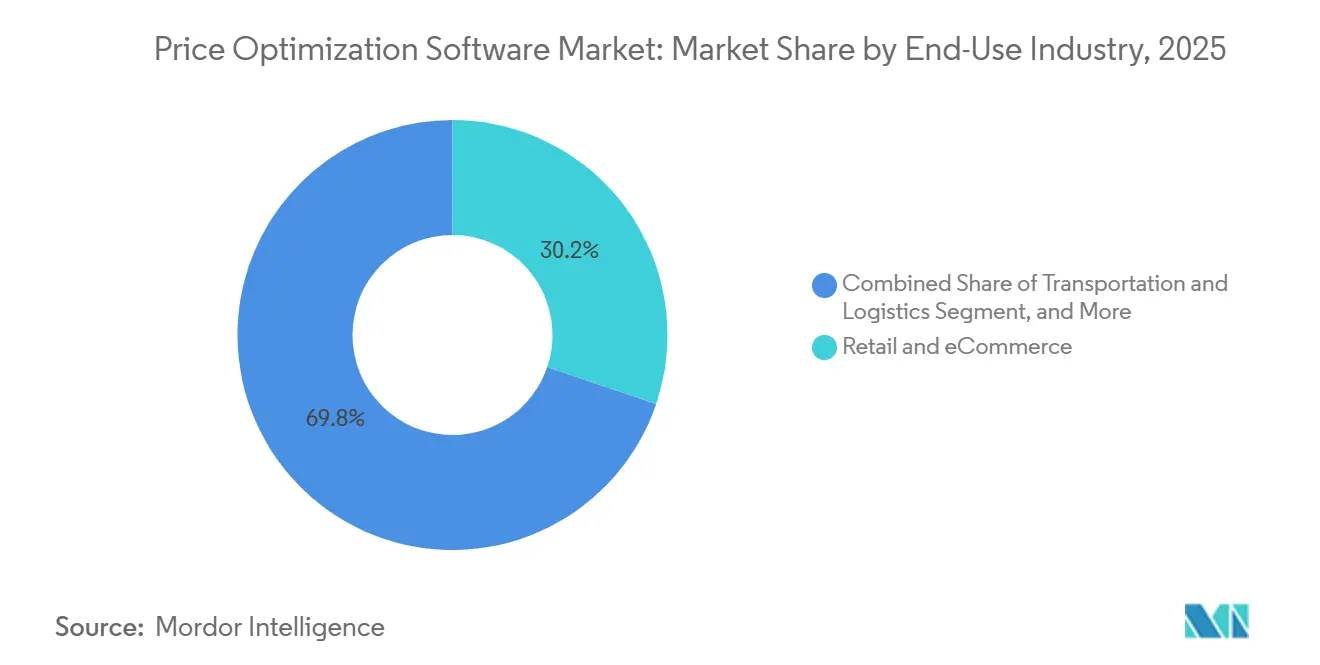
- By end-use industry, retail and eCommerce held 30.2% of the price optimization software market in 2025 and are expected to sustain a 17.4% CAGR through 2031.
- By organization size, large enterprises accounted for 61.9% of the price optimization software market in 2025, while small and medium enterprises are projected to expand at a 17.3% CAGR to 2031.
- By geography, North America remained the single largest region with 36.6% share of the price optimization software market in 2025, yet Asia-Pacific is poised for the fastest growth at 16.9% CAGR through 2031.
Note: Market size and forecast figures in this report are generated using Mordor Intelligence’s proprietary estimation framework, updated with the latest available data and insights as of January 2026.
Global Price Optimization Software Market Trends and Insights
Drivers Impact Analysis*
| Driver | (~) % Impact on CAGR Forecast | Geographic Relevance | Impact Timeline |
|---|---|---|---|
| AI-Powered Real-Time Dynamic Pricing | +3.20% | Global, early in North America and Western Europe | Medium term (2–4 years) |
| Cloud-Native SaaS Models | +2.80% | Global, strongest in North America and Europe | Short term (≤ 2 years) |
| Inflationary Margin Pressure | +2.50% | Global, most acute in North America and Europe | Short term (≤ 2 years) |
| End-to-End CPQ and eCommerce Integration | +2.10% | North America and Europe lead | Medium term (2–4 years) |
| GenAI-Enabled Price Narratives | +1.80% | North America and Europe early adopters | Medium term (2–4 years) |
| Carbon-Adjusted Pricing Algorithms | +1.20% | Europe, emerging in North America | Long term (≥ 4 years) |
| Source: Mordor Intelligence | |||
AI-Powered Real-Time Dynamic Pricing Accelerates Omnichannel Retail Growth
Retailers now run machine-learning models that ingest competitor prices, inventory levels, weather forecasts, and micro-behavioral signals to adjust prices many times per day. Walmart filed a March 2026 patent describing neural-network systems that change shelf and online prices simultaneously, while Kroger disclosed that AI pricing lifted gross margin even though same-store sales were flat.[1]United States Patent and Trademark Office, “Dynamic Pricing System and Method,” uspto.gov Feedvisor reports more than 46 million price updates annually on Amazon and Walmart marketplaces, proving that continuous optimization outperforms weekly rule-based changes. Reinforcement-learning engines now surface non-linear elasticities, such as device-specific cart-abandonment tendencies, that spreadsheets cannot detect. Synchronizing electronic shelf labels with marketplace listings prevents showrooming arbitrage and protects brand integrity across channels.
Cloud-Native SaaS Models Slash Total Cost of Ownership and Speed Implementations
Subscription delivery eliminates capital expenditure and dedicated infrastructure, making the price optimization software market accessible to firms beyond the Fortune 500. Pricefx Copilot, launched in January 2026, integrates with SAP, Salesforce, and Microsoft Dynamics via pre-built APIs, cutting deployment time to 8-12 weeks and reducing lifetime ownership costs by around 40% compared with on-premise builds.[2]Pricefx, “Pricefx AI Copilot,” pricefx.com Zilliant’s November 2025 Pricing Plus bundles optimization, deal guidance, and CPQ into a single license, letting mid-market manufacturers avoid hiring specialist analysts. Vendavo’s AI Pricing Assistant, released April 2026, rides SAP Business Technology Platform, ensuring upgrade-safe connectivity for SAP-centric enterprises.[3]Vendavo, “AI Pricing Assistant,” vendavo.com Vendors reserve advanced AI only for SaaS tiers, further tipping adoption toward cloud.
Inflationary Margin Pressure Makes Algorithmic Pricing a Board Priority
Raw material and freight volatility between 2024 and 2025 exposed manual cost-plus updates as too slow, prompting executive teams to treat pricing as a liquidity lever. PROS reported a 23% bookings surge in Q3 2025 from manufacturers seeking automated pass-through mechanisms. Model N’s Price Management automates thousands of semiconductor SKU changes yearly, delivering real-time visibility into margin leakage.[4]Model N, “Price Intelligence,” modeln.com Algorithmic engines help differentiate low-elasticity items that tolerate swift increases from high-visibility items where shoppers are price sensitive, preserving volume while recovering costs. As central-bank tightening lifted borrowing expenses, an optimized contribution margin became critical to fund working capital.
End-to-End CPQ and eCommerce Integration Unlocks Revenue Synergies
Disconnects between pricing tools, CPQ, and storefronts once caused quote errors and margin slippage. Conga’s February 2026 acquisition of PROS’s B2B arm fuses AI-driven pricing, quoting, and contract lifecycle management on a single workflow, serving more than 10,000 customers. Cognitus partnered with Twenty5 in March 2026 to embed intelligent pricing into SAP-certified government-contracting solutions, ensuring Defense Federal Acquisition Regulation Supplement compliance. Zilliant’s price guidance within Salesforce CPQ reduced quote turnaround by up to 20% and lifted gross margin by two to three percentage points for early adopters. Integrating optimization at the point of configuration turns analytics into immediate revenue before competitor reactions reset market benchmarks.
Restraints Impact Analysis*
| Restraint | (~) % Impact on CAGR Forecast | Geographic Relevance | Impact Timeline |
|---|---|---|---|
| Poor Master-Data Quality and Siloed Systems | -1.50% | Global, acute in legacy ERP estates | Short term (≤ 2 years) |
| Cultural Resistance to Algorithmic Price Changes | -1.30% | Global, strongest in relationship-driven B2B settings | Medium term (2–4 years) |
| Algorithmic Collusion Concerns | -1.00% | North America and Europe enforcement focus | Medium term (2–4 years) |
| Edge-Case Model Failures in Volatile Windows | -0.80% | Global, marked in seasonal industries | Short term (≤ 2 years) |
| Source: Mordor Intelligence | |||
Poor Master-Data Quality and Siloed Systems Hinder ROI
Pricing models rely on granular cost, competitor, and customer data, yet many firms store products, customers, and discounts in incompatible ERP and CRM silos. The Federal Trade Commission’s January 2025 surveillance-pricing study found that intermediaries must often reconcile incomplete feeds manually, eroding the speed advantage of automation. Model N surveys show 85% of executives cite data quality as the top barrier to value realization. Missing SKU-level costs, rebate-adjusted profitability, or localized competitor prices can extend implementation timelines by up to six months and require cross-functional governance that organizations frequently lack.
Cultural Resistance to Algorithmic Price Changes Slows Deployment
Sales teams worry that AI-generated recommendations will undermine long-standing customer relationships. Early state-level bills in the United States now require disclosure when algorithms personalize pricing, complicating change management and reinforcing skepticism. Vendavo’s Assistant counters by surfacing plain-language rationales that sellers can share with buyers, reframing the tool as a negotiation aid. Organizations that fail to align incentives around margin discipline see utilization plateau near 40% of eligible quotes, pushing ROI out by more than a year.
*Our forecasts treat driver/restraint impacts as directional, not additive. The impact forecasts reflect baseline growth, mix effects, and variable interactions.
Segment Analysis
By Deployment Model: Cloud Dominance Reflects SaaS Economics and Integration Speed
Cloud deployments held 63.7% of the price optimization software market share in 2025, and the segment is expected to grow at a 17.1% CAGR through 2031. The price optimization software market size advantage originates from subscription economics, automatic upgrades, and the ability to roll out generative AI modules without on-premise hardware. Vendors increasingly gate-cutting-edge functions behind SaaS licenses, making parity in on-premise environments cost-prohibitive.
Hybrid architectures preserve sensitive data on private servers while running machine-learning training in the cloud, a pattern Vendavo supports via SAP Business Technology Platform. On-premise installations will persist in defense and highly regulated finance, but sovereign-cloud expansions in Europe and Asia-Pacific are softening data-residency objections. Collectively, these trends fortify the cloud’s pathway to an even larger share of the price optimization software market.


By Pricing Strategy Type: AI-Driven Models Outpace Rules, Yet Hybrid Approaches Dominate B2B
AI-driven dynamic engines commanded 47.4% of the 2025 value, reflecting retailer and marketplace adoption of reinforcement-learning approaches. However, rule-based guardrails remain essential in sectors with margin floors or regulatory ceilings, ensuring compliance while algorithms explore elasticities. Usage-based and subscription-hybrid approaches are projected to post the fastest expansion at 17.9% CAGR, signaling a structural shift as vendors align revenue with actual utilization.
The price optimization software market size tied to usage billing will grow as more SaaS and API businesses migrate from flat-fee licenses to consumption-based models. Walmart’s patent blends neural forecasts with hard constraints, highlighting that best-practice architectures merge AI agility with business rules. Hybrid governance frameworks allow B2B manufacturers to leverage predictive guidance while respecting negotiated contract limits, maintaining trust while boosting realized margins.
By End-Use Industry: Retail Leads Adoption, Manufacturing and Logistics Accelerate
Retail and eCommerce accounted for 30.2% of 2025 revenue and are forecast to grow at a 17.4% CAGR to 2031, underpinned by omnichannel synchronization needs. Continuous repricing across shelf labels, websites, and marketplaces protects share and thwarts showrooming. Manufacturing firms turn to price optimization to apply cost-plus logic consistently across distributor networks and automate thousands of quarterly list updates tied to commodity shifts.
Transportation providers apply dynamic engines to quote lane-specific freight rates based on real-time capacity, while financial services firms fine-tune deposit spreads and loan origination fees within regulatory guardrails. Collectively, non-retail sectors are enlarging their presence, but retail will remain the single largest slice of the price optimization software market over the forecast horizon.
By Organization Size: SME Adoption Accelerates as Cloud Platforms Lower Barriers
Large enterprises generated 61.9% of 2025 revenue, leveraging dedicated pricing teams and deep ERP customization. Yet cloud-native platforms now offer modular tiers, enabling smaller firms to enter with rule-based modules and upgrade to AI as data maturity improves. Pricefx Copilot prices tiers on transaction volume, letting an SME start narrow and scale capabilities when ROI materializes.
The price optimization software market size linked to SMEs will therefore expand faster than the enterprise pool, although clean master data remains a gating factor. Vendors are responding with automated diagnostics, template hierarchies, and no-code connectors that shrink onboarding effort. Large enterprises will maintain an advantage through proprietary data and negotiated support, but the share gap is set to narrow as product-led growth motions proliferate.
Geography Analysis
North America contributed 36.6% of 2025 revenue, sustained by early adoption and the presence of leading vendors. PROS reported USD 76 million in subscription revenue during Q3 2025, underscoring the region’s tilt to SaaS pros.com. Federal Trade Commission and Department of Justice investigations into algorithmic rent coordination and surveillance pricing are increasing compliance costs, forcing vendors to embed explainability and audit trails. Despite regulatory friction, continuous investment in AI and cloud infrastructure keeps the United States an innovation nucleus for the price optimization software market.
Europe combines strong demand with stringent governance. The European Commission confirmed in July 2025 that multiple cartel probes involve algorithmic pricing, and the UK Competition and Markets Authority has added a chief technologist to police digital coordination. Simultaneously, the EU Carbon Border Adjustment Mechanism creates fresh use cases for suppliers calculating carbon-inclusive landed costs. Vendors offering transparent, auditable models with carbon adjustments gain a competitive foothold across the bloc. Sovereign-cloud rollouts and data-localization frameworks are tempering objections to SaaS adoption, gradually tipping more deals toward public-cloud deployment.
Asia-Pacific is the fastest growing, forecast to expand at a 16.9% CAGR through 2031. E-commerce platforms in China and India update prices several times per hour to manage intense marketplace competition, driving demand for reinforcement-learning engines. Japan, South Korea, and ASEAN manufacturers deploy price optimization to manage global channels and volatile input costs. While data-protection regimes such as China’s Personal Information Protection Law introduce transparency obligations, they remain less restrictive than European standards, giving vendors latitude to scale rapidly. Emerging economies in Southeast Asia, coupled with cross-border marketplace expansion, position the territory as the foremost growth engine for the price optimization software market.

Competitive Landscape
Vendor concentration in the price optimization software market remains moderate. Key players such as PROS, Pricefx, Vendavo, and Zilliant collectively serve over 15,000 customers, while smaller vendors cater to niche verticals. Notable market activity includes Thoma Bravo’s USD 1.4 billion acquisition of PROS in September 2025, followed by the divestiture of its B2B arm to Conga in February 2026. These transactions highlight a private-equity strategy focused on building comprehensive deal-execution platforms. Additionally, Stripe’s acquisition of Metronome in December 2025 integrates usage metering into payment infrastructure, reflecting a growing trend of embedding pricing intelligence deeper into transactional processes.
Product development in the market increasingly prioritizes model explainability, governance controls, and seamless integration with ERP, CPQ, and marketplace APIs. For instance, Vendavo’s AI Pricing Assistant leverages natural-language reasoning to address cultural resistance in relationship-driven industries. Similarly, carbon-inclusive pricing tools, such as CarbonChain’s CBAM Estimator, are gaining traction as businesses align with ESG-compliance budgets. Emerging players like Competera and Hypersonix are differentiating themselves by offering verticalized data models and low-code configuration options, particularly targeting mid-market retailers. These advancements underscore the market’s focus on innovation to meet evolving customer demands and regulatory requirements.
The price optimization software market is poised for continued consolidation as investors seek to expand platform capabilities and drive cross-sell synergies. Roll-ups are expected to remain a key strategy, enabling vendors to broaden their offerings and enhance value propositions. The integration of advanced technologies, such as AI-driven pricing tools and ESG-compliant calculators, positions the market for sustained growth during the forecast period. As competition intensifies, vendors will likely focus on delivering tailored solutions and fostering partnerships to strengthen their market presence. Overall, the market is set to evolve rapidly, driven by technological advancements and strategic investments.
Price Optimization Software Industry Leaders
PROS Holdings, Inc.
Pricefx AG
Vendavo, Inc.
Zilliant, Inc.
Revionics LLC
- *Disclaimer: Major Players sorted in no particular order

Recent Industry Developments
- April 2026: Vendavo released AI Pricing Assistant, built on SAP Business Technology Platform, offering upgrade-safe connectivity and natural-language explanations to boost sales adoption.
- March 2026: Walmart filed a patent for machine-learning systems that continuously adjust prices based on demand and competitor signals.
- March 2026: Cognitus partnered with Twenty5 to embed intelligent pricing into SAP-endorsed government-contracting solutions.
- February 2026: Conga completed the acquisition of PROS’s B2B pricing business, creating a unified CPQ, contract, and pricing platform.


Global Price Optimization Software Market Report Scope
The Price Optimization Software Market Report is Segmented by Deployment Model (Cloud, On-Premise, Hybrid), End-Use Industry (Retail and eCommerce, Manufacturing, Transportation and Logistics, Financial Services, Rest of End-Use Industry), Pricing Strategy Type (AI-Driven Dynamic Pricing, Rule-Based Dynamic Pricing, Markdown Optimization, Promotion Optimization), Organization Size (Large Enterprises, Small and Medium Enterprises), and Geography (North America, Europe, Asia-Pacific, Middle East and Africa, South America). The Market Forecasts are Provided in Terms of Value (USD).
| Cloud |
| On-Premise |
| Hybrid |
| Retail and eCommerce |
| Manufacturing |
| Transportation and Logistics |
| Financial Services |
| Other End-Use Industries |
| AI-Driven Dynamic Pricing |
| Rule-Based Dynamic Pricing |
| Markdown Optimization |
| Promotion Optimization |
| Large Enterprises |
| Small and Medium Enterprises (SMEs) |
| North America | United States | |
| Canada | ||
| Mexico | ||
| Europe | Germany | |
| United Kingdom | ||
| France | ||
| Italy | ||
| Rest of Europe | ||
| Asia-Pacific | China | |
| Japan | ||
| India | ||
| South Korea | ||
| Australia | ||
| Rest of Asia-Pacific | ||
| Middle East and Africa | Middle East | Saudi Arabia |
| United Arab Emirates | ||
| Rest of Middle East | ||
| Africa | South Africa | |
| Egypt | ||
| Rest of Africa | ||
| South America | Brazil | |
| Argentina | ||
| Rest of South America | ||
| By Deployment Model | Cloud | ||
| On-Premise | |||
| Hybrid | |||
| By End-Use Industry | Retail and eCommerce | ||
| Manufacturing | |||
| Transportation and Logistics | |||
| Financial Services | |||
| Other End-Use Industries | |||
| By Pricing Strategy Type | AI-Driven Dynamic Pricing | ||
| Rule-Based Dynamic Pricing | |||
| Markdown Optimization | |||
| Promotion Optimization | |||
| By Organization Size | Large Enterprises | ||
| Small and Medium Enterprises (SMEs) | |||
| By Geography | North America | United States | |
| Canada | |||
| Mexico | |||
| Europe | Germany | ||
| United Kingdom | |||
| France | |||
| Italy | |||
| Rest of Europe | |||
| Asia-Pacific | China | ||
| Japan | |||
| India | |||
| South Korea | |||
| Australia | |||
| Rest of Asia-Pacific | |||
| Middle East and Africa | Middle East | Saudi Arabia | |
| United Arab Emirates | |||
| Rest of Middle East | |||
| Africa | South Africa | ||
| Egypt | |||
| Rest of Africa | |||
| South America | Brazil | ||
| Argentina | |||
| Rest of South America | |||


Key Questions Answered in the Report
What is the current value of the price optimization software market?
The price optimization software market size reached USD 1.95 billion in 2026 and is projected to rise to USD 4.17 billion by 2031.
How fast is cloud deployment growing within this space?
Cloud deployments of price optimization solutions are forecast to grow at a 17.1% CAGR between 2026 and 2031, making it the dominant delivery model.
Which pricing strategy is gaining momentum beyond AI-driven dynamic models?
Usage-based and subscription-hybrid pricing is the fastest expanding strategy, advancing at a 17.9% CAGR through 2031.
Which region offers the highest growth opportunity?
Asia-Pacific is set to expand at a 16.9% CAGR to 2031, propelled by rapid e-commerce penetration in China and India.
What is the main regulatory risk facing adopters?
Heightened antitrust scrutiny of algorithmic collusion by the Federal Trade Commission and the European Commission is driving demand for transparent, governable models.
How concentrated is the competitive landscape?
The top five vendors hold over 60% of revenue, indicating moderate concentration with room for niche disruptors.
Page last updated on:


