Algorithmic Trading Market Size and Share
Market Overview
| Study Period | 2020 - 2031 |
|---|---|
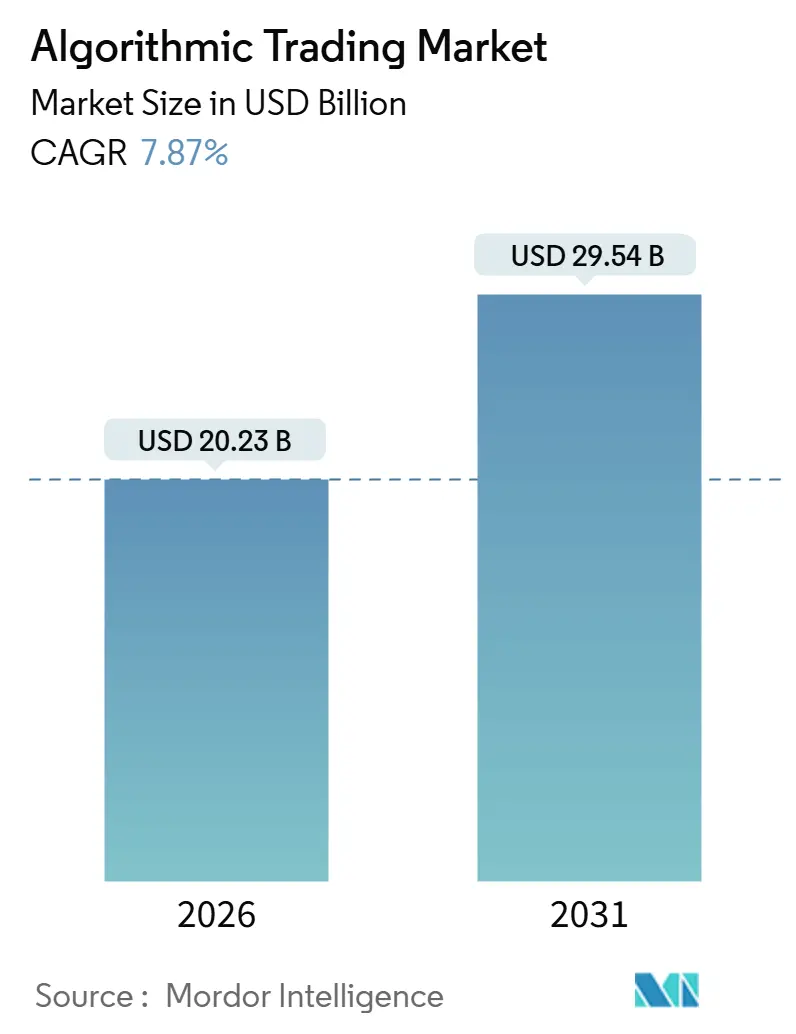
| Market Size (2026) | USD 20.23 Billion |
| Market Size (2031) | USD 29.54 Billion |
| Growth Rate (2026 - 2031) | 7.87% CAGR |
| Fastest Growing Market | Asia Pacific |
| Largest Market | North America |
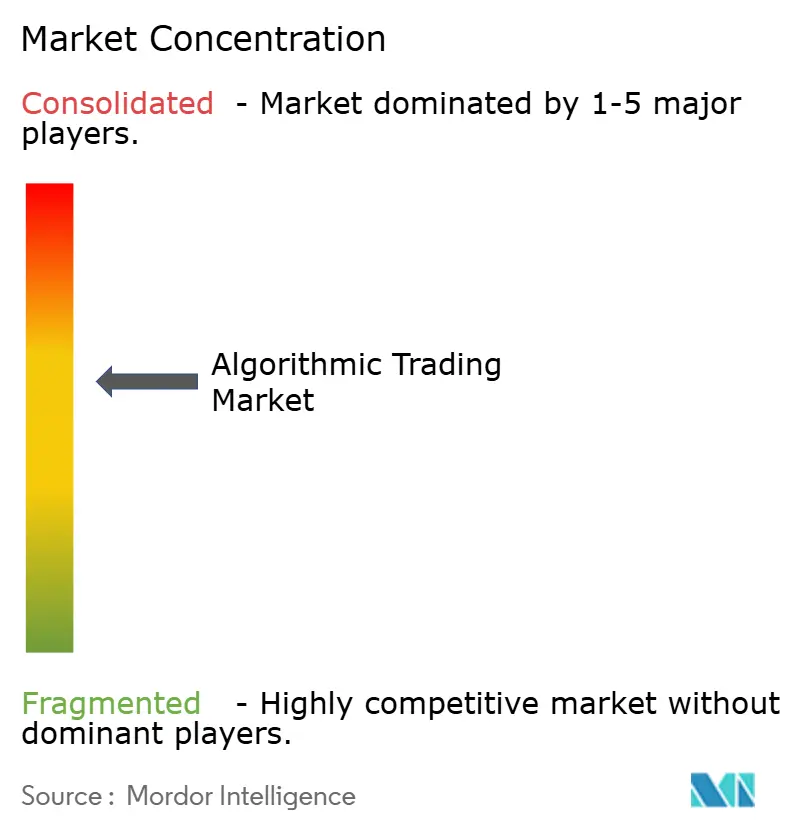
| Market Concentration | Medium |
Major Players *Disclaimer: Major Players sorted in no particular order Image © Mordor Intelligence. Reuse requires attribution under CC BY 4.0. | |
Algorithmic Trading Market Analysis by Mordor Intelligence
The algorithmic trading market size reached USD 20.23 billion in 2026 and is projected to advance to USD 29.54 billion by 2031, reflecting a 7.87% CAGR over the forecast period. Growth is being propelled by sub-millisecond execution requirements on United States and Japanese equity venues, cloud-native back-testing that lowers capital outlays for small desks, and a widening pool of retail application-programming-interface users across India and Southeast Asia. Regulatory modernization, in particular the Securities and Exchange Commission’s Regulation National Market System update and the European Securities and Markets Authority’s best-execution guidance, raises the sophistication threshold for execution quality, steering budgets toward surveillance analytics and colocation upgrades. Meanwhile, quantum-optimized back-testing shortens strategy validation cycles, and energy-efficient data-center mandates in the European Union reward carbon-aware infrastructure. Competitive intensity therefore pivots on a firm’s ability to blend machine-learning inference, deterministic field-programmable-gate-array routing, and real-time compliance monitoring into an integrated stack that preserves speed while containing operating risk.
Key Report Takeaways
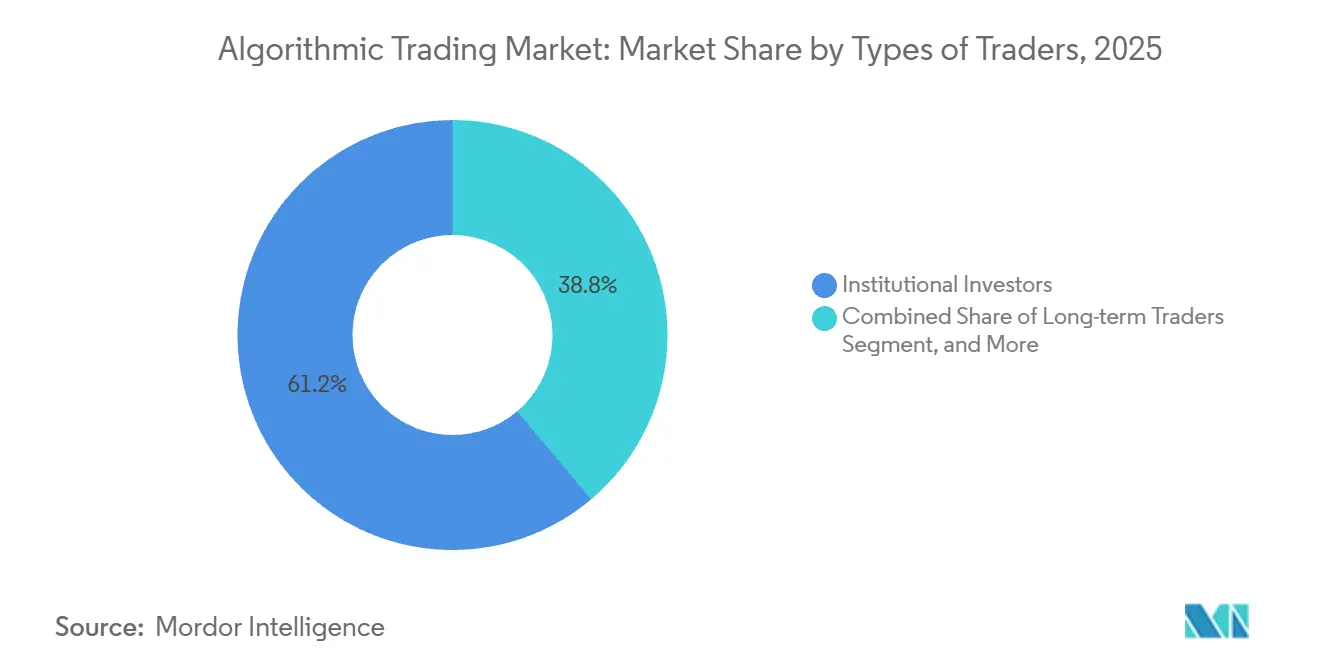
- By type of trader, institutional investors accounted for 61.16% of the algorithmic trading market share in 2025, while the retail segment is expanding at an 8.32% CAGR through 2031.
- By component, solutions led with 68.32% of 2025 revenue, and services are forecast to grow at a 9.14% CAGR through 2031.
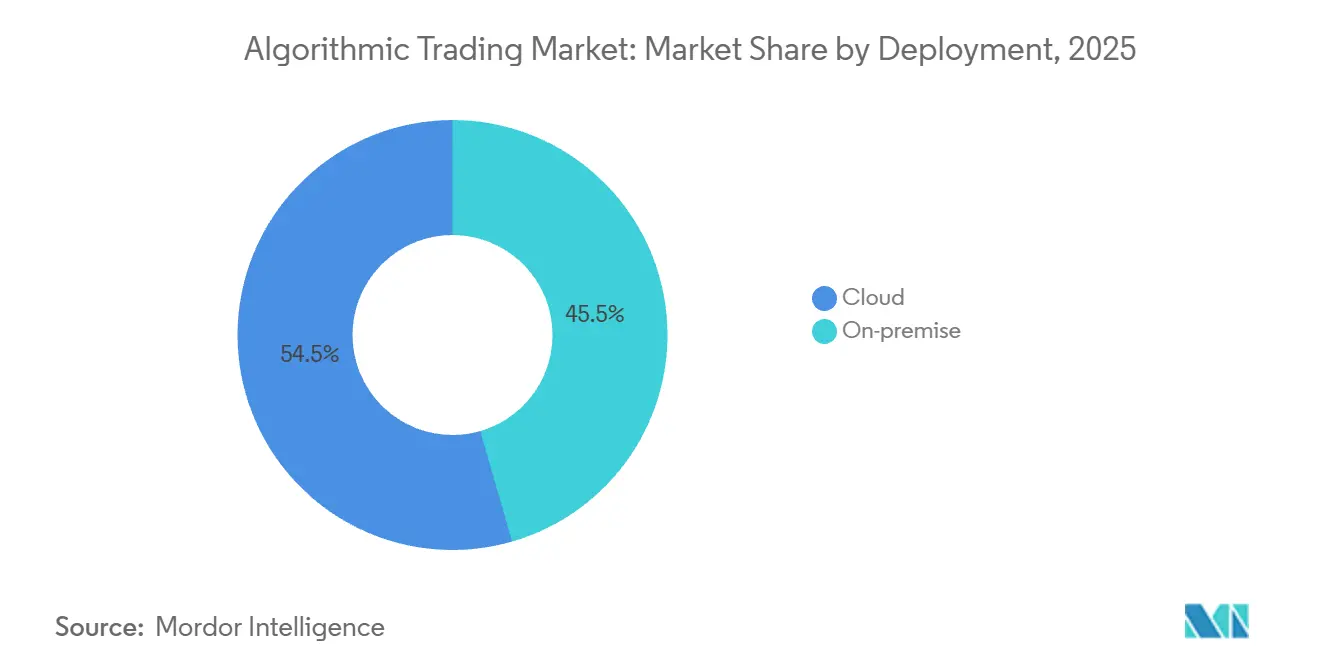
- By deployment, cloud captured 54.47% of spending in 2025, and its share is projected to rise at a 9.02% CAGR to 2031.
- By organization size, large enterprises commanded 63.46% of 2025 outlays, whereas small and medium enterprises are projected to grow at an 8.34% CAGR through 2031.
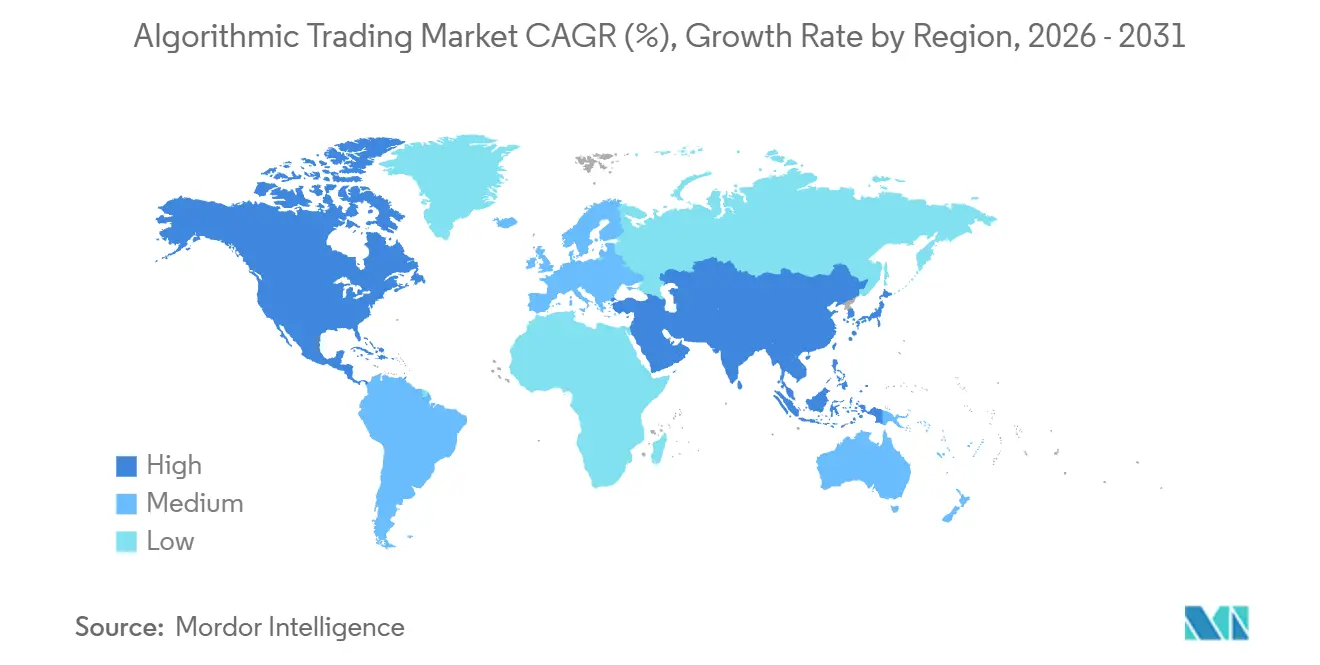
- By geography, North America led with a 38.14% share in 2025; Asia-Pacific is the fastest-growing region, forecast at a 8.73% CAGR through 2031.
Note: Market size and forecast figures in this report are generated using Mordor Intelligence’s proprietary estimation framework, updated with the latest available data and insights as of January 2026.
Global Algorithmic Trading Market Trends and Insights
Drivers Impact Analysis*
| Driver | (~) % Impact on CAGR Forecast | Geographic Relevance | Impact Timeline |
|---|---|---|---|
| Demand for Sub-millisecond Order Execution | +1.8% | North America, Asia Pacific (Japan core) | Short term (≤ 2 years) |
| Surging Passive-Investment Assets | +1.5% | Europe, spillover to North America | Medium term (2-4 years) |
| Expansion of Crypto-Exchange APIs | +1.2% | Asia Pacific (Southeast Asia core, spillover to Australia) | Medium term (2-4 years) |
| Regulatory Push for Best Execution | +1.4% | Global, concentrated in North America and Europe | Long term (≥ 4 years) |
| Quantum-Optimized Back-Testing | +0.6% | North America, Europe | Long term (≥ 4 years) |
| Open-Source Algo Frameworks | +0.9% | Global, strongest uptake in Asia Pacific and South America | Medium term (2-4 years) |
| Source: Mordor Intelligence | |||


Demand for Sub-millisecond Order Execution on United States and Japanese Equities
Latency arbitrage defines the modern liquidity race, with Nasdaq’s matching engine operating below 500 nanoseconds and Tokyo Stock Exchange adopting photonic links that move market data between Tokyo and Osaka in 200 microseconds. High-frequency principals deploy field-programmable-gate-array logic to route orders deterministically, shrinking adverse-selection windows and enabling tighter spreads. Colocation racks in CME Group’s Aurora campus cost more than USD 15,000 per month, yet leading desks justify the spend by capturing fleeting price dislocations that would otherwise evaporate in microseconds. Smaller firms unable to match that hardware budget rely on cloud direct-connect nodes, accepting modest latency in exchange for elasticity. As United States securities markets upgrade time-stamping granularity to 100-microsecond precision, any participant failing to meet that benchmark risks regulatory scrutiny and competitive obsolescence.[1]Financial Conduct Authority, “Latency Arbitrage in UK Equity Markets,” fca.org.uk
Surging Passive-Investment Assets Fueling Index-Rebalance Algorithms in Europe
European passive assets surpassed EUR 3 trillion (USD 3.39 trillion) in 2025, and the scheduled rebalancing of STOXX and FTSE indices now generates predictable intraday flow spikes of 20-30 basis points that specialist algorithms exploit. Broker-dealers parse index-compiler announcements weeks in advance and pre-hedge constituents, offering asset managers reduced tracking-error slippage in exchange for sizable participation fees. Execution desks therefore integrate smart order routing with machine-readable rulebooks, ensuring liquidity is posted ahead of the closing auction when exchange-traded funds must finish their trades. The consequent surge in end-of-day volume rewards firms that can model crowding risk and stagger orders across dark pools, multilateral trading facilities, and primary exchanges without breaching best-execution audits. For the algorithmic trading market, these quarterly rebalance windows represent recurring revenue that compounds as passive share grows.
Expansion of Crypto-Exchange API Liquidity Pools in Southeast Asia
Binance, KuCoin, and Bybit each processed more than 50 million API requests per second in 2025, and their maker-taker rebates of up to 0.02% incentivize algorithmic liquidity provision in spot and perpetual futures instruments. India’s clarification on digital-asset custody accelerated retail algorithm adoption, with local exchanges integrating FIX protocol gateways for hedge-fund flow. Cloud-hosted back-testing services cater to these traders, allowing parameter sweeps across years of tick data without owning servers. The sub-10-millisecond latency available through regional cloud zones narrows the performance gap with on-premise racks, enabling statistical arbitrage across fragmented venues such as Singapore, Jakarta, and Manila. As more jurisdictions publish clear tax and settlement rules, the algorithmic trading market gains a new cohort of participants whose strategies bridge traditional and digital assets.
Regulatory Push for Best Execution, MiFID II and SEC Reg-NMS Modernization
The European Securities and Markets Authority obliges broker-dealers to document venue selection across price, speed, and likelihood of settlement, compelling real-time transaction-cost analytics that parse order-book microstructure. In the United States, the Securities and Exchange Commission’s proposed Rule 605 amendments demand sub-penny reporting, effectively forcing routers to optimize for incremental price improvement rather than fill rate alone. Goldman Sachs allocated more than USD 200 million in 2025 to surveillance and best-execution infrastructure, illustrating the scale of compliance spend now required at tier-one brokers. Vendors embedding audit-ready logic in their application-programming-interfaces win mandates from smaller dealers that lack budget to build in-house systems. Over the long term, these rule sets institutionalize algorithmic management of order routing, boosting addressable demand for analytics modules and hosting capacity.
Restraints Impact Analysis*
| Restraint | (~) % Impact on CAGR Forecast | Geographic Relevance | Impact Timeline |
|---|---|---|---|
| Rising Exchange Colocation Costs | −0.7% | North America, Europe (major hubs) | Short term (≤ 2 years) |
| Flash-Crash Liquidity Vacuum Risk | −0.5% | Global, acute in Asia Pacific and North America | Short term (≤ 2 years) |
| Stringent Market-Surveillance Fines | −0.4% | Europe, spillover to North America | Medium term (2-4 years) |
| Carbon-Footprint Caps on Data Centers | −0.3% | Europe, early impact in North America | Long term (≥ 4 years) |
| Source: Mordor Intelligence | |||
Rising Exchange Colocation Costs Squeezing Mid-tier Proprietary Desks
Monthly rack rates at major venues exceed USD 20,000 once redundancy, cross-connects, and power draws are included, a burden that mid-tier shops executing fewer than 10 million orders annually struggle to amortize. Financial Conduct Authority research shows infrastructure consumes up to 40% of total technology spend for such firms, prompting exits from latency-sensitive strategies or migrations to cloud nodes with higher jitter. The resulting consolidation enlarges spreads on previously crowded micro-arbitrage pairs, inadvertently increasing profits for the remaining capitalized participants. Cloud providers respond by placing edge nodes within exchange campuses, offering 1-digit-millisecond round trips that suit longer-horizon algorithms. Nevertheless, the deterministic nanosecond performance essential for market-making remains out of reach for virtualized hardware, preserving the two-tier speed hierarchy inside the algorithmic trading market.
Flash-Crash Liquidity Vacuum Risk
Algorithmic market makers contribute more than half of displayed depth on leading equity venues, yet many withdraw quotes simultaneously when volatility breaches predefined thresholds, amplifying price gaps. The October 2024 flash crash in the Japanese yen drove a 3% drop in 90 seconds, triggering circuit breakers and illustrating the destabilizing feedback loop when high-speed systems hit kill-switches. Exchanges responded with volatility interruptions, but these pauses create execution uncertainty for strategies that depend on continuous books. Broker-dealers now invest in stress-testing frameworks that apply worst-case slippage models, raising operational overhead and shrinking net alpha. Persistent concerns about sudden liquidity vacuums temper aggressive position sizing, a restraint that slightly drags overall algorithmic trading market growth.
*Our forecasts treat driver/restraint impacts as directional, not additive. The impact forecasts reflect baseline growth, mix effects, and variable interactions.
Segment Analysis
By Types of Traders: Institutional Dominance Meets Retail API Surge
Institutional desks generated the largest slice of 2025 revenue, and their share translated to a 61.16% portion of the algorithmic trading market size, backed by multi-asset mandates and dedicated colocation footprints. Long-term quant managers favor cloud-based back-testing clusters that replay years of market data in hours, optimizing factor exposure without incurring fixed hardware costs.[2]Amazon Web Services, “Financial Services Competency Partners,” aws.amazon.com Short-term high-frequency participants, in contrast, deploy sub-microsecond order routers inside exchange data centers to exploit fleeting bid-offer mispricing, a model financially prohibitive for most retail actors.
The retail segment is expanding at an 8.32% CAGR through 2031, particularly in India and Singapore, where zero-commission brokerage integrations embed plug-and-play scripting environments. MetaTrader 5 surpassed 2 million active trading accounts in 2025, a milestone that illustrates democratized access to institutional-grade tooling. Platform marketplaces now list thousands of paid and free strategy templates, allowing individuals to license proven code rather than program from scratch. As education content improves and application-programming-interface limits are relaxed, retail penetration introduces a growing revenue stream for data vendors and hosting providers, gradually rebalancing the algorithmic trading market toward a more diverse participant base.


By Component: Services Outpace Platforms as Compliance Complexity Rises
Solutions packages platform licenses bundled with analytics captured 68.32% of 2025 spending, valued at USD 13.83 billion within the algorithmic trading market size. Thomson Reuters and Refinitiv anchor this segment by delivering cohesive data feeds, smart order routing, and trade blotters through subscription contracts that embed switching costs. The dominance of integrated stacks reflects buy-side preference for single-vendor accountability, ensuring regulatory and operational support arrives from one help desk.
Services, however, are the fastest-growing slice at a 9.14% CAGR because specialized vendors now assume algorithm design, model validation, and best-execution reporting on an outsourced basis. AlgoTrader’s managed-service line delivers back-testing infrastructure as a consumption-priced cloud workload, while InfoReach offers hosted execution shells that wrap client algorithms inside compliance controls. This modular approach resonates with asset managers facing shrinking management fees yet escalating audit demands. Over time, the lines between software licence and consulting retainer blur, and hybrid commercial models emerge in which monthly invoices scale with executed volume, deepening vendor-client interdependence inside the algorithmic trading market.
By Deployment: Cloud Gains Share as Latency Tolerance Expands
Cloud tenants accounted for 54.47% of global spending in 2025, representing USD 11.02 billion of the algorithmic trading market, and their share is projected to rise at a 9.02% CAGR through 2031. The attraction centers on elastic compute; researchers boot hundreds of parallel back-tests, then spin down clusters when live trading begins. AWS Financial Services lists more than 150 certified trading partners, while direct-connect cross-links to Nasdaq and CME enable single-digit-millisecond round-trip trips, adequate for most statistical-arbitrage timeframes.
On-premise racks still dominate the ultra-low-latency market-making segment, where deterministic nanosecond speed trumps amortized cost. Citadel Securities and Virtu Financial maintain proprietary fiber and field-programmable-gate-array stacks that cloud virtualization cannot match. Yet hybrid schemes are emerging; firms execute latency-critical legs in colocation cabinets while offloading portfolio optimization and compliance analytics to scalable clouds, preserving speed where it matters and benefiting from opex elsewhere. As regulators focus on latency equalization, the performance premium of bare-metal servers compresses, creating momentum for further cloud migration across the algorithmic trading market.
By Organization Size: SMEs Adopt Cloud-Native Platforms as Barriers Fall
Large enterprises captured 63.46% of 2025 expenditure, reflective of balance-sheet strength sufficient to fund FPGA routers, direct market access lines, and cross-asset data mosaics. JPMorgan Chase alone invested over USD 500 million in trading technology in 2025, integrating quantum-inspired optimization modules into its Fusion platform. The share scale gives such banks negotiating leverage with data centers and vendors, securing colocation slots adjacent to matching engines.
Small and medium enterprises, while smaller in absolute spend, are projected to expand at an 8.34% CAGR through 2031 as open-source engines such as QuantConnect LEAN strip licensing fees from the equation. Cloud marketplaces let these firms subscribe to execution time in hourly bursts, aligning expenses with trading windows. Regional exchanges in Brazil and the United Arab Emirates introduced low-cost application-programming-interface tiers in 2025, creating fresh sandbox environments. Combined, falling infrastructure hurdles and accessible code repositories shift competitive dynamics, enabling garages-to-fund managers to stake positions inside a formerly esoteric algorithmic trading market.
Geography Analysis
North America generated 38.14% of 2025 global revenue, giving the region the largest algorithmic trading market share among all continents. New York and Chicago colocation hubs house most high-frequency desks, supported by exchange facilities that time-stamp trades at nanosecond precision. Regulatory modernization, including the Securities and Exchange Commission’s sub-penny disclosure mandate, compels continual upgrades to smart order routers, and technology stalwarts such as Bloomberg and Refinitiv reinforce the ecosystem by bundling venue connectivity with analytics.[3]Securities and Exchange Commission, “Proposed Amendments to Rule 605,” sec.gov Canadian and Mexican exchanges contribute incremental volumes, yet the critical mass of sophisticated participants remains clustered in United States venues where deep liquidity and high message caps justify capital-intensive strategies.
Asia Pacific is projected to be the fastest-growing geography at an 8.73% CAGR, rising from a 2025 revenue base energized by retail participation on Indian and Southeast Asian exchanges. The Securities and Exchange Board of India’s push to open colocation access for every member leveled infrastructure asymmetries, and Tokyo’s photonic network has created new arbitrage arcs linking cash equities with Osaka Exchange derivatives. South Korean and Australian regulators adopted sandbox frameworks for testing artificial-intelligence-driven order types, inviting foreign proprietary houses to pilot strategies without permanent licensing. While high-frequency penetration in mainland China remains controlled, incremental liberalization in Shenzhen and Shanghai suggests a gradual opening that could unlock additional demand as capital-controls ease.
Europe captured a substantial slice of 2025 spending, anchored by the United Kingdom’s foreign-exchange liquidity pools and passive rebalancing flows on STOXX Europe 600 and FTSE 100 indices. MiFID II best-execution audits increase demand for transaction-cost analytics, rewarding vendors that embed compliance logic inside execution paths. Deutsche Börse’s Frankfurt colocation and Euronext’s Paris data halls mirror United States latency benchmarks, enabling cross-venue arbitrage strategies that parse more than 30 trading platforms in real time. Although South America, the Middle East, and Africa currently represent smaller bases, Brazil’s B3 API expansion and Abu Dhabi’s new colocation hall could pivot local volumes upward, signaling nascent corridors of growth that the algorithmic trading market will monitor closely.

Regulatory Landscape
In Europe, MiFID II and MiFIR continue to anchor algorithmic trading obligations, supported by Delegated Regulation (EU) 2017/589 (RTS 6) on organizational requirements, testing, and controls for investment firms using algorithmic trading techniques. Supervisory convergence is also tightening: in February 2026, the European Securities and Markets Authority (ESMA) published a supervisory briefing on algorithmic trading in the EU, emphasizing governance, testing, and the use of AI. In May 2026, ESMA issued an opinion on the trading venue perimeter that addresses technology providers and systems that pre-arrange transactions, reinforcing where regulatory responsibilities sit as market structure evolves.
In the United Kingdom, the Financial Conduct Authority (FCA) completed a multi-firm review (July 2025) focused on firms' compliance with MiFID RTS 6 controls and conformance testing, reinforcing expectations around kill switches, monitoring, and documented change management for algorithms. At the global level, IOSCO published a Supervisory Toolkit for AI Use in Capital Markets in 2026, giving regulators practical approaches to assess AI-related risks that intersect with algorithmic trading and automated advice. This increases pressure on firms to maintain audit-ready model governance and oversight when relying on third-party tools or outsourced components.
Value Chain Analysis
The value chain starts with market access and venue infrastructure (exchanges, matching engines, and colocation or proximity hosting), then moves through connectivity and market data distribution, execution management and smart order routing, pre-trade risk and compliance controls, strategy research and back-testing, and finally post-trade analytics and best-execution reporting for both buy-side and sell-side users. Key participants include financial data and market infrastructure providers and platform vendors (for example, LSEG TORA for multi-asset order and execution management), specialist connectivity and execution infrastructure providers (such as Rithmic), and cloud-based research and back-testing ecosystems used by smaller desks and developers (such as QuantConnect).
Bottlenecks are increasingly concentrated around data engineering and performance under stress. Firms report market data performance issues during volatile conditions, and the practical constraints include multicast distribution without packet loss, non-deterministic latency in cloud environments, and high data egress fees when moving large tick datasets for research. A second friction point sits at the interface between brokers and client algorithms, where divergent certification and documentation requirements increase operational workload, pushing sell-side desks and vendors to productize testing, attestation, and ongoing monitoring as part of implementation and managed services.
Competitive Landscape
Liquidity provision in United States equities, European fixed income, and global foreign exchange remains concentrated among six high-frequency principals - Citadel Securities, Virtu Financial, Jump Trading, XTX Markets, Tower Research Capital, and Hudson River Trading - collectively estimated to furnish 30-40% of displayed depth on major venues. These firms operate deterministic hardware stacks that process orders in sub-microsecond pipelines, and they leverage machine-learning models to forecast short-term price moves, adjusting inventory with minimal adverse selection. Capital intensity and intellectual property barriers make displacement difficult, yet technology vendors compete vigorously in this tier.
Platform providers such as Thomson Reuters, Refinitiv, Bloomberg, MetaQuotes, AlgoTrader, and InfoReach jockey for share on application-programming-interface breadth, cloud scalability, and integrated compliance. More than 50 independent software vendors now sell execution management systems, risk dashboards, and back-testing sandboxes, a fragmentation that offers buy-side clients fine-grained choice but complicates vendor selection. Open-source frameworks, notably QuantConnect LEAN and Backtrader, add further pressure by eliminating licence fees and drawing community contributions that accelerate feature velocity.
White-space opportunities cluster around quantum-optimized back-testing and carbon-aware colocation. Early pilots by D-Wave and IBM show annealing accelerates factor-screen calibration, compressing strategy validation from weeks to hours. Simultaneously, European Union energy-efficiency rules oblige data centers to publish watt-per-compute metrics, and firms that minimize carbon per message stand to benefit from preferential tenancy fees. Vendors embedding sustainability dashboards inside their execution platforms differentiate on non-latency grounds, signaling an evolution in the competitive levers that define leadership inside the algorithmic trading market.
Algorithmic Trading Industry Leaders
Thomson Reuters Corporation
Refinitiv Limited
Virtu Financial Inc.
Jump Trading LLC
63 Moons Technologies Ltd
- *Disclaimer: Major Players sorted in no particular order

Market Opportunities and Future Outlook
Opportunities are clustering around compliance-grade algorithm governance and outsourced controls as regulators sharpen accountability for testing, monitoring, and the use of third-party components. ESMA's February 2026 supervisory guidance and IOSCO's 2026 AI supervisory toolkit reinforce demand for audit-ready controls that cover model governance, change management, and outsourcing oversight. This expands whitespace for vendors providing embedded surveillance analytics, best-execution reporting, and standardized algorithm certification workflows for brokers and mid-sized asset managers.
A second opportunity is emerging around agentic and AI-assisted trading workflows integrated into brokerage and execution platforms with security guardrails. In June 2026, Interactive Brokers expanded agentic integrations by enabling clients to connect AI agents through secure API connectors, including Claude, and adding ChatGPT and Grok, illustrating productized pathways for AI-driven assistance without direct credential sharing. In parallel, performance-driven venue modernization in digital assets, such as Deribit's Starbase matching engine launch in March 2026 targeting microsecond execution and high-performance API messaging, supports new algorithmic liquidity and cross-venue strategies that depend on deterministic execution and richer API capabilities.
Recent Industry Developments
- July 2026: Virtu Financial commenced marketing of USD 400 million in incremental first lien term loans to expand its senior secured credit facility to USD 1,930 million. The additional financing supports continued investment capacity across its multi-asset trading and execution services footprint, reinforcing its ability to fund technology upgrades and platform integration tied to algorithmic execution.
- June 2026: Virtu Financial obtained a Markets in Crypto-Assets (MiCA) license. The approval strengthens its ability to operate and offer regulated services in the EU crypto market structure, widening the addressable set of algorithmic execution and liquidity provision workflows under a harmonized regional framework.
- September 2024: Virtu Financial introduced Switcher, an algorithm designed to dynamically switch between its execution algorithms during an order lifecycle using real-time market inputs. The launch expanded its execution toolkit for clients seeking adaptive routing behavior across changing liquidity conditions, supporting differentiation in broker algos and execution services.


Research Methodology Framework and Report Scope
Market Definition and Coverage
For this study, the market covers revenues earned from algorithmic trading platforms, software tools, and related services that automate buy and sell order execution using pre-set rules (such as price, time, and volume) across major asset classes.
Scope exclusions: We exclude proprietary in-house algorithms that are not commercialized and one-off scripts created by hobbyist traders.
Segmentation Overview
- By Types of Traders
- Institutional Investors
- Retail Investors
- Long-term Traders
- Short-term Traders
- By Component
- Solutions
- Platforms
- Software Tools
- Services
- Solutions
- By Deployment
- Cloud
- On-premise
- By Organisation Size
- Small and Medium Enterprises
- Large Enterprises
- By Geography
- North America
- United States
- Canada
- Mexico
- South America
- Brazil
- Argentina
- Chile
- Rest of South America
- Europe
- Germany
- United Kingdom
- France
- Italy
- Spain
- Netherlands
- Russia
- Rest of Europe
- Asia Pacific
- China
- Japan
- South Korea
- India
- ASEAN
- Australia
- New Zealand
- Rest of Asia Pacific
- Middle East
- GCC
- Turkey
- Israel
- Rest of Middle East
- Africa
- South Africa
- Nigeria
- Kenya
- Rest of Africa
- North America
Data Sources, Market Sizing, and Validation
Desk Research
Desk research starts by mapping what must be true for algorithmic trading adoption to grow, and then tying that to measurable signals. We use public sources such as SEC and CFTC releases, FINRA and major exchange rulebooks and notices, and central bank publications that help track market structure changes that can affect automated execution.
To size the addressable demand pool, we also review sources such as BIS statistics on derivatives and FX activity, OECD and World Bank macro indicators, and peer reviewed finance and market microstructure journals that explain execution behavior and cost drivers. Company filings, annual reports, investor presentations, and reputable business press are used to confirm product positioning and revenue exposure. Where available, we supplement this with paid subscriptions for company financials and intelligence, and patent databases to spot where product roadmaps and automation features are moving. These are illustrative sources only, and many other public references are also used for cross-checks and clarification.
Primary Interviews and Surveys
Primary work is used to pressure-test the desk assumptions and convert broad demand signals into practical adoption and pricing ranges. We speak with platform and infrastructure providers, broker and exchange-adjacent experts, buy-side and sell-side users, and implementation specialists across key regions. This respondent input helps clarify which revenue lines should be treated as algorithmic trading execution automation versus adjacent analytics, market data, or data delivery spend.
Distribution of primary research fieldwork respondents
| Company type | Respondent position | Region |
|---|---|---|
| Top tier: 27% | CXOs: 14% | APAC: 50% |
| Mid tier: 55% | Functional/Unit leaders: 31% | EMEA: 32% |
| Smaller Players: 18% | Managers: 55% | Americas: 18% |
Market-Sizing & Forecasting
The core sizing uses top-down logic where trading activity and market participation indicators are used to reconstruct a realistic spend pool for automated execution tools and services. Once that is built, we corroborate totals with selective bottom-up approximations, such as sampled vendor revenue exposure, channel checks, and price-per-user or price-per-desk ranges multiplied by validated user counts.
Key inputs used in the model include institutional and broker participation trends, electronic trading penetration by asset class, regulatory and surveillance requirements that increase automation needs, average contract values for software and support, and cloud versus on-premises deployment preference (which affects pricing and refresh cycles). When data is patchy, gaps are handled through conservative ranges that are anchored to interview-confirmed adoption bands and then narrowed through cross-checks with publicly visible product footprints.
For forecasting, scenario analysis is applied because market growth is highly sensitive to volatility cycles, regulatory changes, and technology shifts. Assumptions on adoption, pricing, and deployment mix are updated using expert consensus from interviews, and the final trajectory is checked against broader capital markets activity to avoid unrealistic jumps between years.
Data Validation & Update Cycle
Validation is done through repeated cross-checks, where independent signals are compared against model outputs, followed by variance checks at region and major use-case levels. If a growth rate or share movement looks unusual, the assumptions are revisited, and the team re-contacts relevant experts when a mismatch cannot be explained by a documented market event.
Before sign-off, the model and key assumptions go through multiple analyst reviews so calculation errors and scope drift are caught early. Reports are refreshed annually, and interim updates are made when material events occur, such as major rule changes, shifts in market access, or structural changes in electronic trading. Right before delivery, a final analyst pass is completed so clients receive the most current view that can be traced back to clear inputs.
Mordor Intelligence's Algorithmic Trading Market Size Versus Other Published Estimates
Published estimates for algorithmic trading do not always match because groups define the market boundary in different ways, and they also pick different base years and growth assumptions. Differences can also come from how platforms versus services are treated, and from whether adjacent spending is counted as part of automated execution.
By tracking execution-focused platform and service revenues and refreshing scope checks through interview-led validation, Mordor Intelligence keeps the market tied to commercialized algorithmic trading spend and avoids folding in broader trading technology categories that inflate totals. Currency timing, base year choice, and the way cloud subscription pricing is annualized can also shift the reported number even when the narrative sounds similar.
Benchmark comparison
| Source | Market Size | Gaps in Research Methodology |
|---|---|---|
| Mordor Intelligence | USD 20.23 B (2026) | |
| Global Consultancy A | USD 23.48 B (2025) | Uses an earlier base year and a faster growth profile, and it typically groups a wider set of components and trading types together, which can pull adjacent analytics and data-related spend into the total. |
| Industry Publisher B | USD 18.80 B (2025) | Starts from a different year and scope framing, and the roll-up can lean more on broad segment splits by trading type and organization size, which may not separate pure execution automation revenues from surrounding market infrastructure. |
The spread in values is mainly explained by year selection and what is counted inside the market boundary, especially around services, deployment pricing, and adjacent technology spend. Our approach stays repeatable because the inputs are tied to observable activity signals, practical pricing logic, and re-validation triggers when assumptions drift.


Key Questions Answered in the Report
How large is the algorithmic trading market today?
The algorithmic trading market size stood at USD 20.23 billion in 2026 and is projected to reach USD 29.54 billion by 2031.
What is driving faster growth in Asia Pacific?
Retail participation on Indian and Southeast Asian exchanges, along with Japan’s photonic connectivity trials, is lifting Asia Pacific revenue at an 8.73% CAGR.
Why are services outpacing platform sales?
Compliance mandates under MiFID II and SEC Rule 605 push asset managers to outsource strategy design, best-execution analytics, and audit reporting, elevating service spend at a 9.14% CAGR.
How does cloud deployment affect trading speed?
Cloud nodes linked through direct-connect lines deliver single-digit-millisecond round trips, sufficient for most statistical strategies, while ultra-low latency market makers still rely on on-premise FPGA hardware.
What risks can flash crashes pose to algorithmic desks?
When volatility spikes, many algorithms withdraw quotes simultaneously, creating liquidity vacuums that deepen price swings and expose firms to execution slippage and regulatory scrutiny.
Which firms dominate liquidity provision?
Citadel Securities, Virtu Financial, Jump Trading, XTX Markets, Tower Research Capital, and Hudson River Trading collectively handle roughly one-third of visible depth on major venues.
Page last updated on:


