Shipping Software Market Size and Share
Market Overview
| Study Period | 2019 - 2030 |
|---|---|
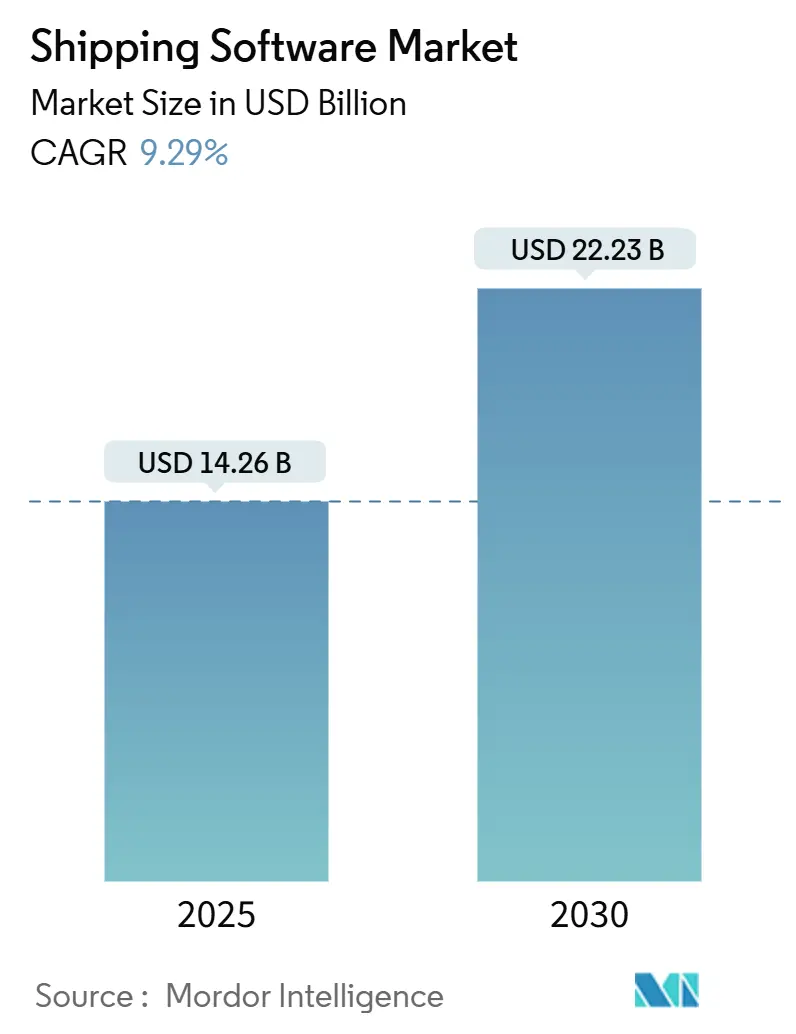
| Market Size (2025) | USD 14.26 Billion |
| Market Size (2030) | USD 22.23 Billion |
| Growth Rate (2025 - 2030) | 9.29% CAGR |
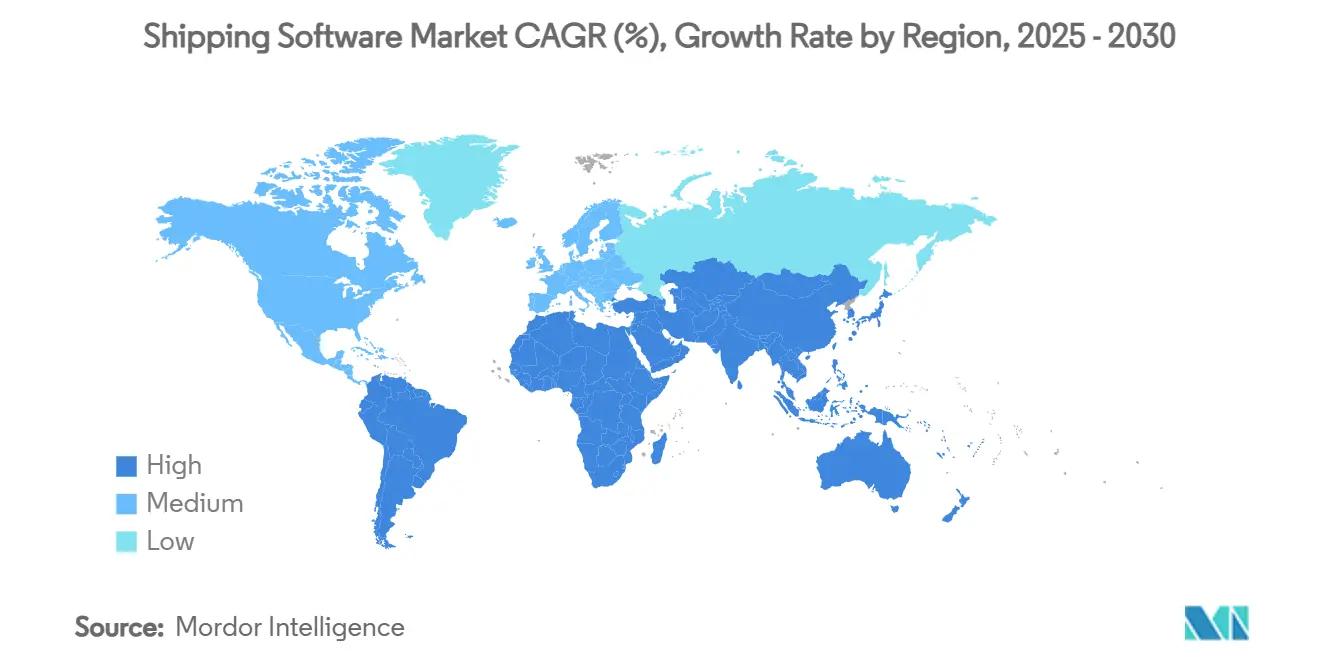
| Fastest Growing Market | Asia Pacific |
| Largest Market | North America |
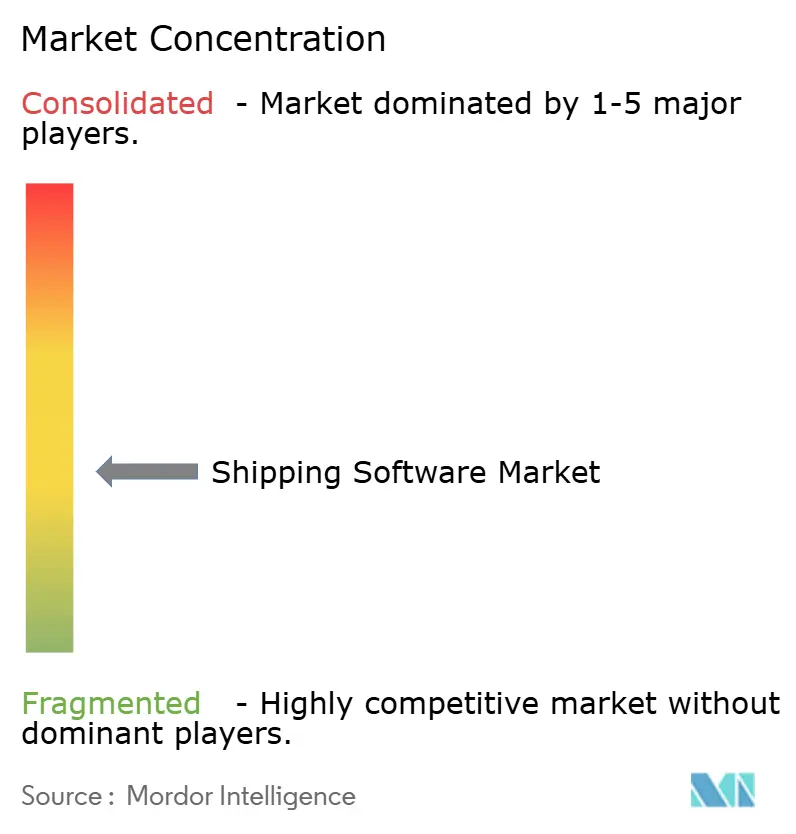
| Market Concentration | Medium |
Major Players
*Disclaimer: Major Players sorted in no particular order Image © Mordor Intelligence. Reuse requires attribution under CC BY 4.0. |
|
Shipping Software Market Analysis by Mordor Intelligence
The shipping software market size stood at USD 14.26 billion in 2025 and is forecast to reach USD 22.23 billion in 2030, advancing at a 9.29% CAGR during 2025-2030. Rapid e-commerce expansion, widening cloud uptake among small and mid-sized shippers, and the embedding of artificial intelligence (AI) in transportation networks have accelerated platform demand and broadened the competitive field. Vendors increasingly deliver cloud-native suites that connect carrier rating, routing, customs compliance, and real-time visibility in a single workspace, replacing fragmented legacy point solutions. North America retained the largest regional footprint thanks to mature e-commerce ecosystems and early TMS adoption, while Asia-Pacific recorded the fastest growth as governments backed digital trade corridors and as regional parcel volumes surged. Consolidation momentum intensified, with tier-one providers acquiring specialised software firms to add AI, cross-border compliance, and last-mile optimisation modules. At the same time, rising cybersecurity threats and a widening talent gap in logistics IT triggered elevated investment in automation and managed security services, further shaping the near-term outlook of the shipping software market.
Key Report Takeaways
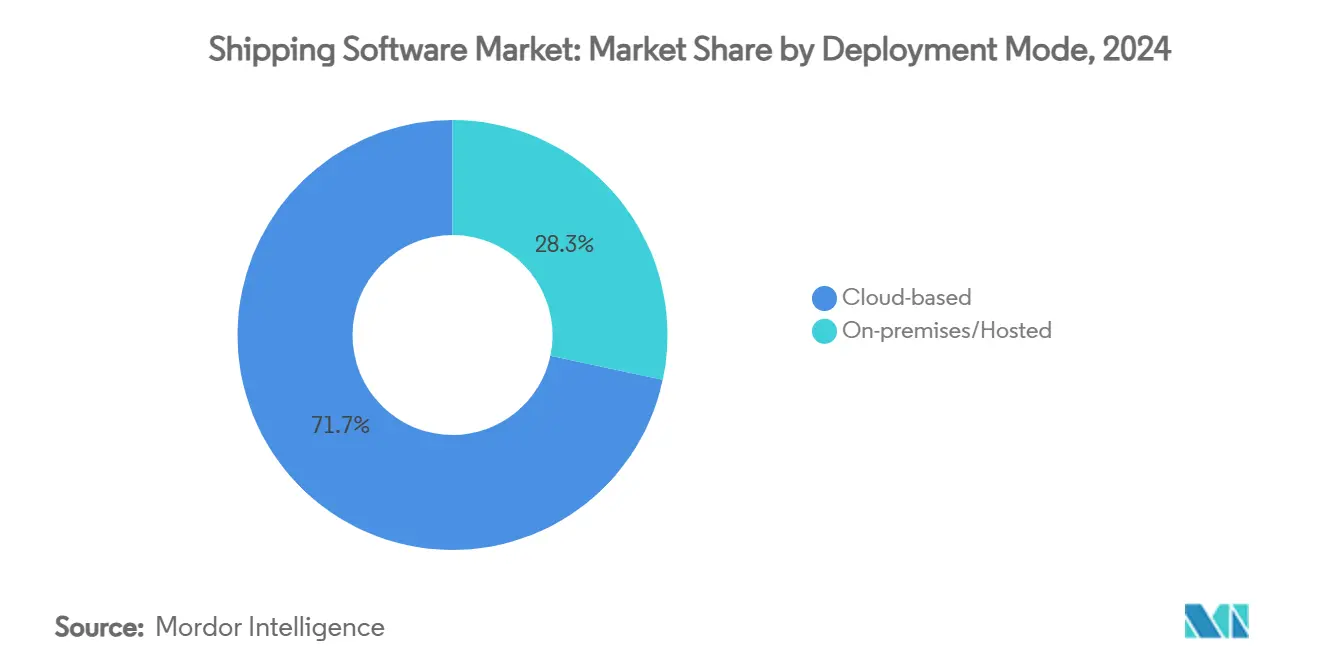
- By deployment mode, cloud platforms led with 71.67% of the shipping software market share in 2024.
- By geography, North America controlled 36.88% of the shipping software market size in 2024, whereas Asia-Pacific is projected to post the highest 11.34% CAGR through 2030.
- By application, parcel and small-package shipping commanded 58.78% of the shipping software market share in 2024, while cross-border compliance tools are forecast to expand at an 11.12% CAGR up to 2030.
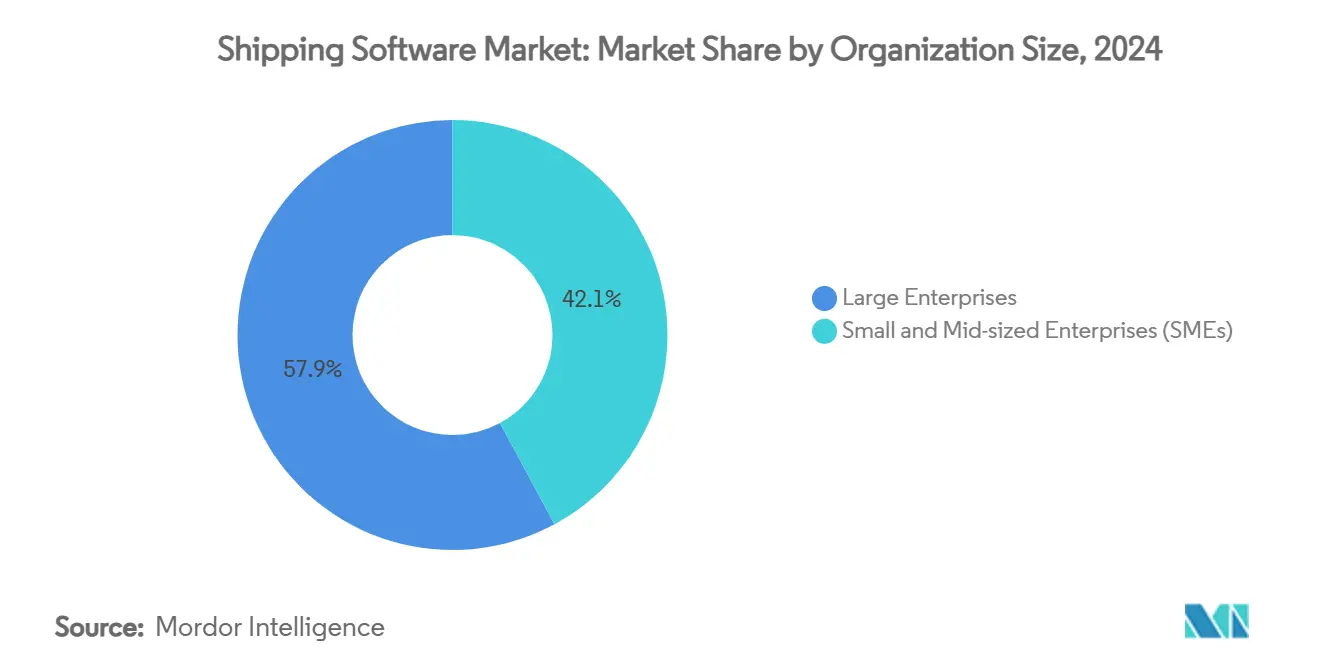
- By organisation size, large enterprises captured 57.86% of the shipping software market in 2024; small and mid-sized enterprises are poised to grow at a 9.81% CAGR through 2030.
- By end-user industry, healthcare and life-sciences are expected to register the fastest 11.25% CAGR between 2025 and 2030.
Global Shipping Software Market Trends and Insights
Drivers Impact Analysis*
| Driver | (~)% Impact on CAGR Forecast | Geographic Relevance | Impact Timeline |
|---|---|---|---|
| E-commerce parcel-volume explosion | +2.8% | Global, with highest impact in North America and Asia-Pacific | Medium term (2-4 years) |
| Cloud-native TMS adoption across SME and mid-market shippers | +2.1% | Global, particularly strong in Europe and North America | Short term (≤ 2 years) |
| AI-driven rate-shopping and routing optimisation | +1.9% | North America and Europe leading, expanding to Asia-Pacific | Medium term (2-4 years) |
| Digitisation of cross-border customs and trade documentation | +1.7% | Global, with emphasis on Asia-Pacific and Europe trade corridors | Long term (≥ 4 years) |
| Regional fulfilment centre proliferation (micro-FC networks) | +1.2% | Urban centers globally, concentrated in North America and Asia-Pacific | Medium term (2-4 years) |
| Reverse-logistics surge | +0.9% | Global, with highest impact in North America and Europe | Short term (≤ 2 years) |
| Source: Mordor Intelligence | |||
E-commerce Parcel-Volume Explosion
Parcel volumes climbed sharply and fundamentally reshaped software requirements as United States shipping activity was projected to hit 29 billion parcels by 2030, a 36% rise over 2024 levels. Market leaders responded with multi-carrier platforms that automate real-time rate comparisons across regional, national, and crowd-sourced carriers. Advanced algorithms now examine more than 1,100 shipment variables-including weight breaks, fuel indexes, guaranteed windows, and surcharges-to recommend the lowest landed cost within milliseconds. Shippers deploying these AI-led systems reported double-digit increases in on-time delivery and an average 17% uplift in revenue per truck, strengthening the business case for switching to fully integrated shipping software market suites.
Cloud-native TMS Adoption Across SME and Mid-market Shippers
Cloud delivery accelerated as software providers stripped away large upfront licence fees and lengthy on-premises roll-outs. Companies spending under USD 20 million on freight reported 7.5% logistics cost savings after migrating to software-as-a-service TMS environments. Subscription pricing aligned platform costs to monthly shipping volumes, while low-code configuration tools cut deployment cycles from months to weeks. As barriers fell, the shipping software market gained tens of thousands of first-time SME buyers, widening total addressable demand and intensifying vendor competition for mid-tier accounts that had previously relied on spreadsheets or carrier portals.
AI-driven Rate-shopping and Routing Optimisation
Machine-learning engines embedded inside modern TMS suites examined capacity, fuel costs, ETA promises, and driver availability in real time to craft shipment plans that trimmed transportation spend by 10% and accelerated transit times by 15% in benchmark studies. Continuous feedback loops strengthened prediction accuracy each week the model remained in production. Early adopters cited lower empty miles, faster dock turns, and better carrier scorecards. The approach gained momentum during 2025 as freight-rate volatility and driver shortages forced shippers to seek automated decision support inside the shipping software market.
Digitisation of Cross-border Customs and Trade Documentation
Heightened enforcement, tighter dual-use controls, and new carbon-border rules made digital compliance indispensable. Global enterprises used automated classification and restricted-party screening modules to cut file-creation times by 80% and avoid six-figure penalty exposures.[1]Descartes. "2025 Trade Compliance Trends: Insights Shaped by 2024." January 1, 2025. https://www.descartes.com/resources/knowledge-center/2025-trade-compliance-trends-insights-shaped-2024Integrated document engines now populate commercial invoices, import security filings, and health certificates directly from order data, eliminating manual rekeying errors. The capability has become a must-have buying criterion for any new shipping software market platform aimed at international shippers.
Restraints Impact Analysis*
| Restraint | (~)% Impact on CAGR Forecast | Geographic Relevance | Impact Timeline |
|---|---|---|---|
| Legacy-system integration complexity | -1.4% | Global, particularly acute in North America and Europe | Short term (≤ 2 years) |
| Escalating cyber-security and data-privacy risks | -1.1% | Global, with highest concern in North America and Europe | Medium term (2-4 years) |
| Scarcity of logistics-domain software talent | -0.8% | Global, most severe in developed markets | Long term (≥ 4 years) |
| Carrier-API throttling and outages | -0.7% | Global, with particular impact on multi-carrier platforms | Short term (≤ 2 years) |
| Source: Mordor Intelligence | |||
Legacy-system Integration Complexity
Decades of bolt-on ERP, WMS, and home-grown dispatch code created brittle data silos that complicated modernisation efforts. During a 2024 roll-out, a major 3PL had to map 450 partner data feeds and re-engineer EDI flows before activating a new cloud TMS. Such integration pain points extended project timelines, raised consulting costs, and discouraged risk-averse shippers from replacing legacy assets. Middleware connectors and standardised APIs eased the burden, yet full migration remained a barrier that shaved 1.4 percentage points from the sector CAGR forecast.
Escalating Cyber-security and Data-privacy Risks
Transportation ranked as the 8th most targeted sector for cyberattacks in 2023, with average breach losses of USD 3.59 million.[2]Marsh McLennan Agency, “Cybersecurity trends facing the trucking and transportation industry,” marshmma.com Only 35% of logistics firms maintained a chief information-security officer, leaving many operations exposed. Attackers exploited unsecured telematics devices and poorly segmented cloud environments, forcing shippers to prioritise zero-trust architectures and 24/7 threat monitoring. The risk environment added cost and complexity, especially for small operators entering the cloud-based shipping software market for the first time.
*Our forecasts treat driver/restraint impacts as directional, not additive. The impact forecasts reflect baseline growth, mix effects, and variable interactions.
Segment Analysis
By Deployment Mode: Cloud Dominance Accelerated
Cloud platforms commanded 71.67% of the shipping software market share in 2024 and are forecast to record a 10.86% CAGR up to 2030. Market leaders have used continuous delivery pipelines to push weekly upgrades that add new carrier APIs, duty calculators, and workflow widgets without user downtime. The shipping software market size allocated to on-premises installations is shrinking as CIOs migrate capital budgets toward OPEX-friendly subscription models that scale elastically during peak seasons.
Real-time visibility dashboards, built-in analytics, and sandbox testing environments were once reserved for large enterprises but are now bundled into mid-tier plans. Open-API frameworks allow out-of-the-box integration with CRM, WMS, and accounting suites, removing the integration friction that previously hampered adoption. Vendors differentiating on cyber-resilience-such as default multifactor authentication and SOC 2 Type II certifications-have gained share among security-sensitive shippers.


By Application: Cross-border Compliance Drives Growth
Parcel and small-package shipping held 58.78% of the shipping software market in 2024 thanks to entrenched omnichannel fulfilment workflows. Growth momentum, however, shifted to cross-border compliance modules, which are projected to advance at an 11.12% CAGR through 2030. The shipping software market size tied to trade-documentation engines rose each quarter of 2024 as agencies in Europe and Asia toughened inspection regimes and expanded denied-party lists.
Automated licence-verification, landed-cost calculators, and predictive duty-refund workflows became core add-ons that sealed high-value platform deals. Meanwhile, returns-management modules used AI to trigger instant exchange offers, preserving revenue while curbing costly refunds.
By Organisation Size: SME Adoption Accelerated
Large enterprises controlled 57.86% of 2024 revenue but the SME cohort is slated to grow 9.81% per year to 2030. User-centric design and intuitive onboarding tutorials shortened learning curves, while native mobile apps let owner-operators approve loads from the road. As a result, the shipping software market has become more inclusive, enabling small regional fleets to access the same carrier-rating engines once exclusive to Fortune 500 chains.
Case studies of fleets expanding from single digits to double-digit truck counts while maintaining lean back-office staffing resonated across industry conferences, signalling a tipping point in perceived accessibility. Vendors now launch pre-configured templates for fashion, furniture, or perishables that compress implementation into days rather than months.
By End-user Industry: Healthcare Leads Growth
Retail and e-commerce users generated 43.67% of 2024 revenue, reflecting the scale of global parcel flows. Yet healthcare and life-sciences users are predicted to log the fastest 11.25% CAGR between 2025 and 2030 as biologic drugs, cell-and-gene therapies, and temperature-sensitive vaccines proliferate. The shipping software market size attributed to cold-chain compliance grew in tandem with stricter Good Distribution Practice guidelines.
Temperature-monitoring IoT probes stream data directly into TMS dashboards, triggering proactive exception workflows when lane temperatures drift outside tolerance. Pharmaceutical shippers demanded end-to-end traceability to prove chain-of-custody for high-value payloads, making industry-specific compliance reporting a decisive buying factor.
Geography Analysis
North America held 36.88% of 2024 revenue, buoyed by deeply entrenched e-commerce ecosystems, advanced carrier APIs, and early adoption of AI-based rate-shopping. United States parcel leaders integrated predictive dock-scheduling and automated bill-audit modules that cut invoice errors by nearly one-third, cementing regional leadership in the shipping software market. Canada’s cross-border lanes with the United States spurred demand for single-screen customs and freight visibility tools that harmonise USMCA documentation and automate duty reconciliation.
Asia-Pacific delivered the highest 11.34% CAGR projection for 2025-2030. Governments in China, India, and Indonesia launched digitisation programmes that subsidised logistics-tech uptake, while merchant adoption soared as marketplaces drove free-shipping promises. Regional providers invested heavily in multi-language interfaces and instant-on integrations with local parcel carriers to capture expanding volumes. The rise of Southeast Asian social-commerce and same-day services further stretched legacy systems, accelerating migration to modern shipping software market platforms.
Europe maintained steady growth driven by stringent sustainability and cross-border trade rules. Shippers adopted carbon-footprint dashboards that calculate per-shipment CO₂ using real-time distance, mode, and payload data to comply with EU taxonomy reporting. The Middle East and Africa, along with South America, stayed early in the adoption curve; infrastructure constraints slowed penetration but niche segments such as perishable-export corridors and duty-free zones created pockets of high growth.

Competitive Landscape
The market displayed moderate concentration and accelerating merger activity. Descartes Systems Group bought 3GTMS for USD 115 million in March 2025 and Sellercloud in October 2024, adding domestic planning and omnichannel order-management modules that round out end-to-end visibility.[3]Descartes Systems Group, “Descartes acquires 3GTMS,” descartes.com Körber Supply Chain Software closed its MercuryGate deal in October 2024, boosting multi-modal reach. WiseTech Global acquired Blume Global for USD 414 million, tightening its foothold in intermodal rail and ocean scheduling.
Technology roadmaps converged on AI, real-time visibility, and industry-specific compliance. Leading suites invested in no-code workflow editors and carrier-agnostic labelling engines that future-proofed shippers against carrier-rate volatility. Challengers sought differentiation in user experience and rapid deployment by offering pre-built connectors to hundreds of regional parcel networks, thus lowering onboarding friction for small spenders entering the shipping software market.
Strategic partnerships also shaped competition. TMS providers embedded carbon-calculation APIs from sustainability specialists, while ERP vendors white-labelled lightweight shipping plugins to retain customers seeking native fulfilment functions. As buyer expectations rose, vendors competed on uptime guarantees, integrated security operations centres, and consultative onboarding services that de-risked large-scale cut-overs.
Shipping Software Industry Leaders
-
Descartes Systems Group Inc.
-
WiseTech Global Limited
-
Pitney Bowes Inc.
-
Oracle Corporation
-
SAP SE
- *Disclaimer: Major Players sorted in no particular order

Recent Industry Developments
- March 2025: Descartes Systems Group acquired 3GTMS for USD 115 million, expanding North American cloud TMS capabilities.
- October 2024: Körber Supply Chain Software completed the acquisition of MercuryGate International, adding multi-modal transportation management to its supply-chain suite.
- October 2024: Descartes Systems Group purchased Sellercloud for USD 110 million, broadening omnichannel inventory and order-management reach.
- September 2024: Magaya Corporation bought Omniboom to enhance integration connectivity for logistics service providers.


Global Shipping Software Market Report Scope
| Cloud-based |
| On-premises/Hosted |
| Parcel / Small-package Shipping |
| Freight and LTL / FTL Shipping |
| Cross-border and Compliance |
| Returns and Reverse-logistics |
| Large Enterprises |
| Small and Mid-sized Enterprises (SMEs) |
| Retail and E-commerce |
| Third-Party Logistics (3PL) and Freight Forwarders |
| Manufacturing and Industrial |
| Healthcare and Life-sciences |
| North America | United States | |
| Canada | ||
| South America | Brazil | |
| Rest of South America | ||
| Europe | Germany | |
| United Kingdom | ||
| France | ||
| Spain | ||
| Italy | ||
| Russia | ||
| Rest of Europe | ||
| Asia Pacific | China | |
| India | ||
| Japan | ||
| South Korea | ||
| Australia and New Zealand | ||
| Rest of Asia Pacific | ||
| Middle East and Africa | Middle East | Saudi Arabia |
| United Arab Emirates | ||
| Turkey | ||
| Rest of Middle East | ||
| Africa | South Africa | |
| Nigeria | ||
| Rest of Africa | ||
| By Deployment Mode | Cloud-based | ||
| On-premises/Hosted | |||
| By Application | Parcel / Small-package Shipping | ||
| Freight and LTL / FTL Shipping | |||
| Cross-border and Compliance | |||
| Returns and Reverse-logistics | |||
| By Organisation Size | Large Enterprises | ||
| Small and Mid-sized Enterprises (SMEs) | |||
| By End-user Industry | Retail and E-commerce | ||
| Third-Party Logistics (3PL) and Freight Forwarders | |||
| Manufacturing and Industrial | |||
| Healthcare and Life-sciences | |||
| By Geography | North America | United States | |
| Canada | |||
| South America | Brazil | ||
| Rest of South America | |||
| Europe | Germany | ||
| United Kingdom | |||
| France | |||
| Spain | |||
| Italy | |||
| Russia | |||
| Rest of Europe | |||
| Asia Pacific | China | ||
| India | |||
| Japan | |||
| South Korea | |||
| Australia and New Zealand | |||
| Rest of Asia Pacific | |||
| Middle East and Africa | Middle East | Saudi Arabia | |
| United Arab Emirates | |||
| Turkey | |||
| Rest of Middle East | |||
| Africa | South Africa | ||
| Nigeria | |||
| Rest of Africa | |||


Key Questions Answered in the Report
What is the projected value of the global shipping software market in 2030?
The market is forecast to reach USD 22.23 billion by 2030
Which deployment mode is expanding the fastest in shipping software?
Cloud-based platforms are advancing at a 10.86% CAGR through 2030, far outpacing on-premises models.
Which region is expected to post the highest growth in shipping software?
Asia-Pacific shows the strongest outlook with an 11.34% CAGR during 2025-2030.
Why are healthcare shippers investing heavily in shipping software?
Strict temperature-control rules and expanding cold-chain volumes are driving adoption of compliance-centric TMS features.
What is the biggest restraint limiting new TMS deployments?
Integration complexity with legacy ERP and WMS systems remains the primary barrier, shaving 1.4 percentage points off forecast growth.
How are vendors addressing rising cybersecurity threats?
Providers are embedding zero-trust architectures, SOC-2 certifications, and 24/7 managed security services directly into their cloud suites.
Page last updated on:


