Software-Defined Perimeter Market Size and Share
Market Overview
| Study Period | 2020 - 2031 |
|---|---|
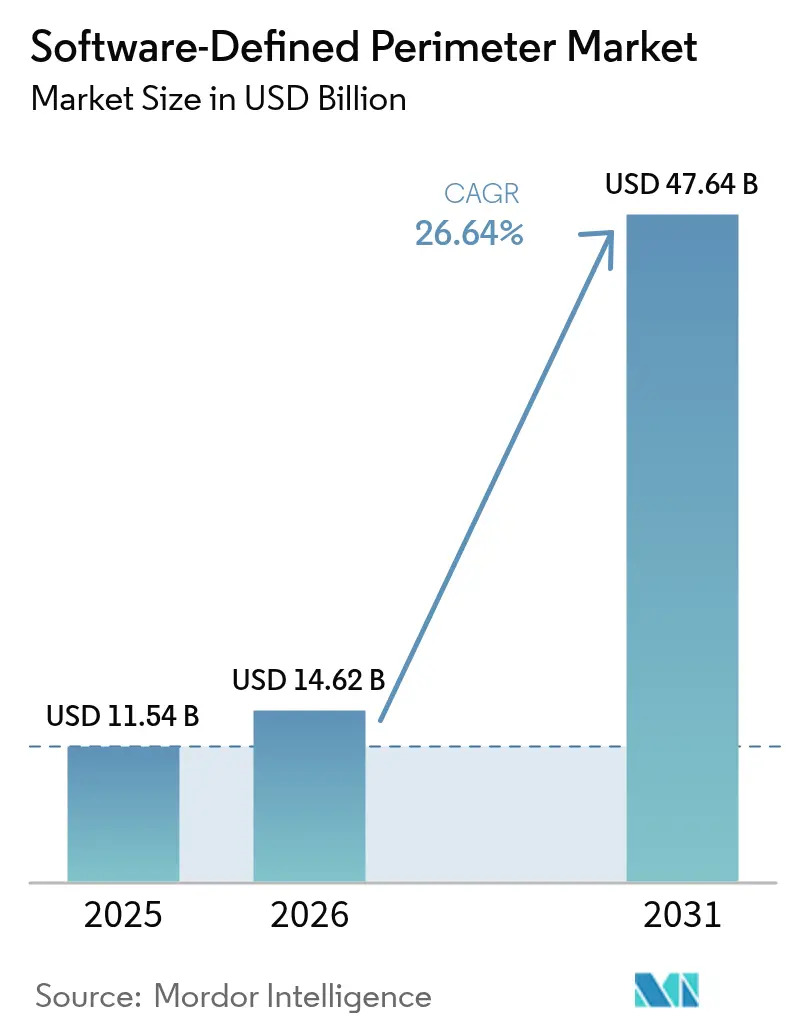
| Market Size (2026) | USD 14.62 Billion |
| Market Size (2031) | USD 47.64 Billion |
| Growth Rate (2026 - 2031) | 26.64% CAGR |
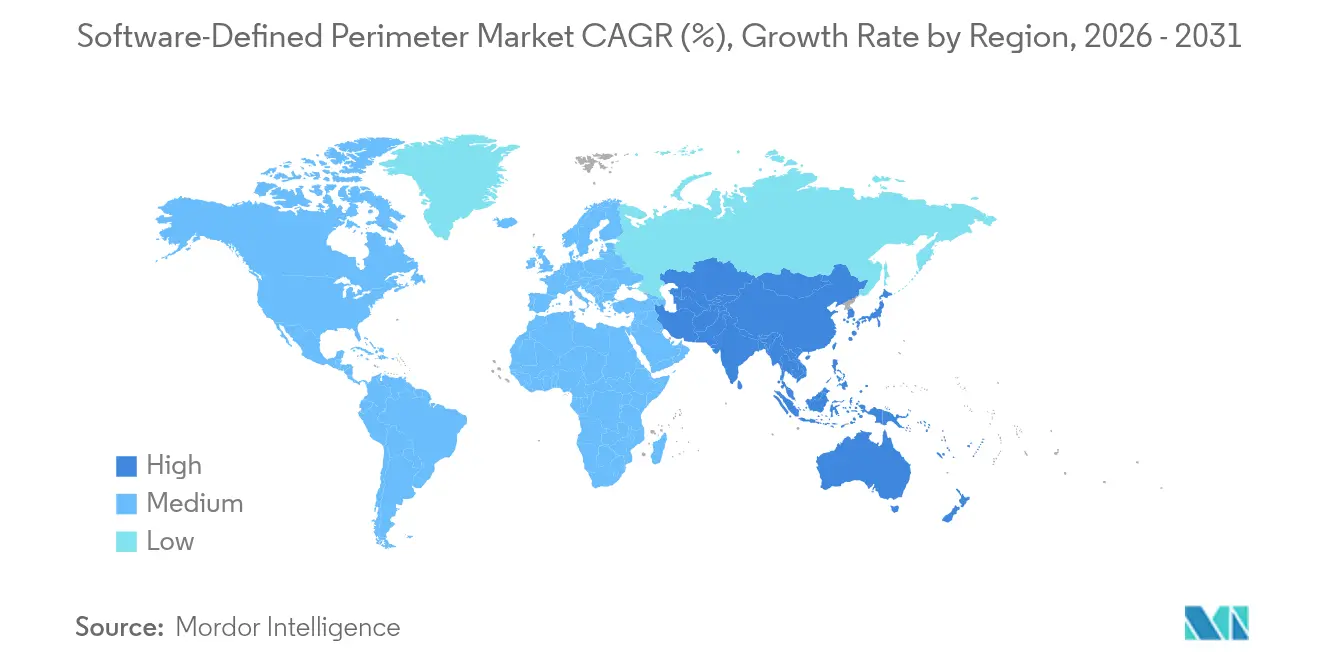
| Fastest Growing Market | Asia Pacific |
| Largest Market | North America |
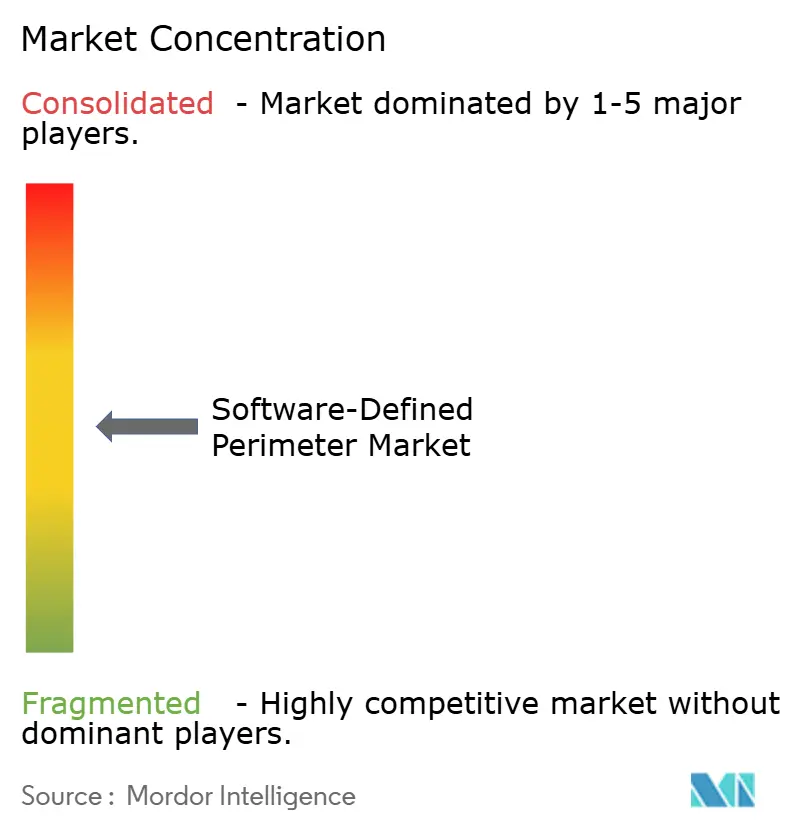
| Market Concentration | Medium |
Major Players *Disclaimer: Major Players sorted in no particular order Image © Mordor Intelligence. Reuse requires attribution under CC BY 4.0. | |
Software-Defined Perimeter Market Analysis by Mordor Intelligence
Software-Defined Perimeter market size in 2026 is estimated at USD 14.62 billion, growing from 2025 value of USD 11.54 billion with 2031 projections showing USD 47.64 billion, growing at 26.64% CAGR over 2026-2031. This momentum reflects a decisive migration from network-centric defenses to identity-centric controls that remove implicit trust. Executive mandates, the surge in remote work, and escalating breach costs now make zero-trust adoption an enterprise imperative. Cloud-delivered platforms scale more gracefully than legacy VPNs, while converging Secure Access Service Edge (SASE) functions simplify operations. Skill shortages have lifted demand for managed services, and 5G network-slice security APIs are opening telco-backed channels for rapid rollout. North America dominates revenue, but Asia-Pacific is compounding fastest as organizations seek to curb average breach losses of USD 30 million. [1]Cloud Security Alliance, “Software-Defined Perimeter Specification v2.0,” cloudsecurityalliance.org
Key Report Takeaways
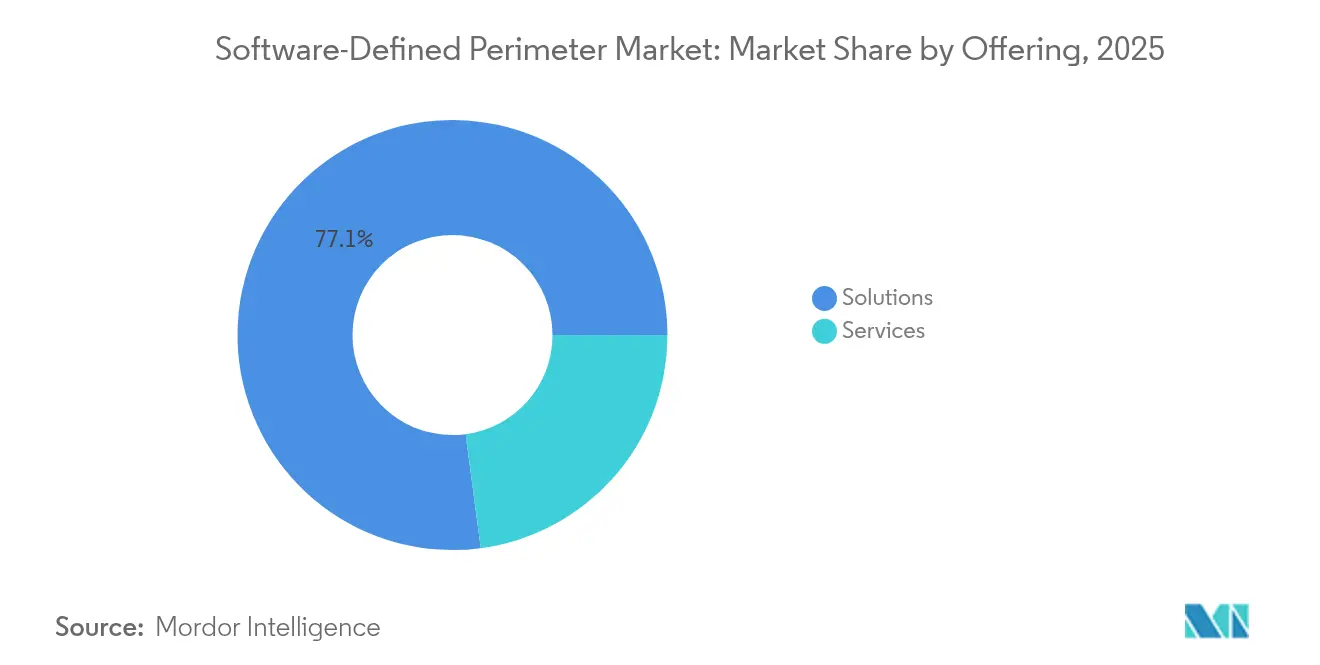
- By offering, solutions, held 77.10% of the Software-Defined Perimeter market share in 2025, whereas services are projected to grow at a 30.05% CAGR through 2031.
- By connectivity model, cloud-edge approaches led with 51.90% revenue share in 2025; endpoint-centric models are forecast to expand at a 33.62% CAGR.
- By deployment mode, cloud accounted for 68.55% of the Software-Defined Perimeter market size in 2025, yet hybrid deployments are advancing at a 29.82% CAGR.
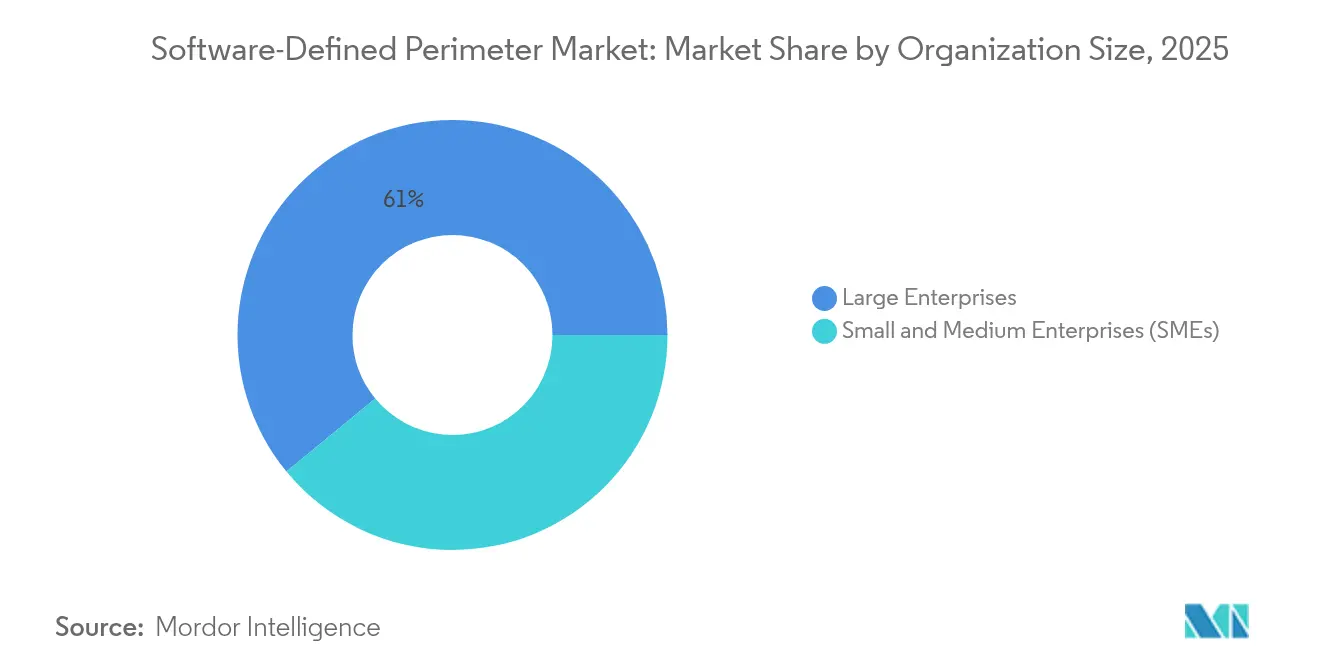
- By organization size, large enterprises captured 60.95% of 2025 revenue, while SMEs record the highest projected CAGR at 28.62%.
- By end-user industry, BFSI led with 21.05% revenue share in 2025; healthcare is set to post the fastest 31.28% CAGR.
- By geography, North America commanded 39.05% of 2025 revenue; Asia-Pacific is poised for a 27.90% CAGR through 2031.
Note: Market size and forecast figures in this report are generated using Mordor Intelligence’s proprietary estimation framework, updated with the latest available data and insights as of 2026.
Global Software-Defined Perimeter Market Trends and Insights
Drivers Impact Analysis*
| Driver | (~) % Impact on CAGR Forecast | Geographic Relevance | Impact Timeline |
|---|---|---|---|
| Rapid multi-cloud adoption & expanding attack-surface | 8.20% | Global, with early gains in North America, Europe | Medium term (2-4 years) |
| Surge in remote & hybrid workforce post-2024 | 7.10% | Global, spill-over to emerging markets | Short term (≤ 2 years) |
| Escalating zero-trust mandates from regulators | 6.80% | North America & EU core, expanding to APAC | Long term (≥ 4 years) |
| Convergence of SDP with SASE edge nodes | 3.40% | APAC core, spill-over to MEA | Medium term (2-4 years) |
| Telco rollout of 5G network-slice security APIs | 1.80% | APAC, North America early deployment zones | Long term (≥ 4 years) |
| Source: Mordor Intelligence | |||
Rapid multi-cloud adoption & expanding attack-surface
Organizations now run an average of 2.6 public clouds, fragmenting control planes and eroding legacy perimeter defenses. Software-Defined Perimeter solutions mitigate this sprawl by establishing application-specific micro-tunnels that follow workloads wherever they reside. Financial-services spending illustrates the stakes: USD 623 billion in IT outlays during 2024 drove parallel investments in zero-trust overlays. Agencies such as the UK Ministry for Levelling Up trimmed connection times by 80% after moving to an SDP fabric that blocked 81 million policy violations.
Surge in remote and hybrid workforce post-2024
VPN weaknesses surfaced when remote traffic ballooned; 56% of firms reported incidents tied to over-permissive tunnels. Manufacturers like Flex secured 20,000 staff with Prisma Access, isolating sessions and halting lateral malware spread. Identity-aware segmentation proved decisive for maintaining uptime during crisis-level ventilator output.[3]Zscaler, “Zero Trust Exchange Surpasses Half a Trillion Daily Transactions,” zscaler.com
Escalating zero-trust mandates from regulators
U.S. Executive Orders 14028 and 14144 force federal bodies and contractors to adopt zero-trust baselines, pressing vendors to prove software supply-chain security. The Cybersecurity and Infrastructure Security Agency’s follow-on requirements codify system- and data-level protections, extending compliance pressure into the private sector. [2]The White House, “Executive Order on Strengthening and Promoting Innovation in the Nation’s Cybersecurity,” whitehouse.gov
Convergence of SDP with SASE edge nodes
Zscaler released a Zero Trust SASE stack that eliminates stand-alone firewalls and VPNs while inspecting 400 billion daily transactions for BT-delivered managed services. Platform unification lowers administrative overhead and tightens policy consistency as traffic shifts to the edge.
Telco rollout of 5G network-slice security APIs
3GPP releases 15-17 embed Network Slice Specific Authentication, enabling carriers to expose programmable security slices. T-Mobile’s T-SIMsecure pioneers SIM-based clientless access for IoT devices, packaging SDP controls into a carrier-managed service.
Restraints Impact Analysis*
| Restraint | (~) % Impact on CAGR Forecast | Geographic Relevance | Impact Timeline |
|---|---|---|---|
| Integration complexity with legacy NAC/VPN estates | -4.30% | Global, particularly in established enterprises | Short term (≤ 2 years) |
| Shortage of zero-trust skills inflates deployment cost | -3.70% | Global, acute in APAC and emerging markets | Medium term (2-4 years) |
| Vendor lock-in fears due to proprietary overlay protocols | -1.90% | North America & EU, enterprise segment focus | Long term (≥ 4 years) |
| Source: Mordor Intelligence | |||
Integration Complexity with Legacy NAC/VPN Estates
Enterprises often run overlapping NAC, VPN, and SD-WAN tools. Policy migration thus becomes labor-intensive, as shown by a Fortune 500 bank that only realized a 25× bandwidth boost and 50% opex cut after aligning disparate rule sets. SMEs are hit harder, with up to 70% adopting digital tools during COVID-19 yet lacking security budgets, according to the OECD.
Shortage of zero-trust skills inflates deployment cost
Cybersecurity headcount deficits top 2.8 million. Fewer than three-quarters of roles are staffed, prolonging rollout times and raising dependence on external experts. European SMEs, which represent 99% of businesses, typically outsource orchestration to compensate for limited in-house capability.
*Our forecasts treat driver/restraint impacts as directional, not additive. The impact forecasts reflect baseline growth, mix effects, and variable interactions.
Segment Analysis
By Offering: Services Accelerate as Complexity Demands Expertise
Solutions accounted for 77.10% of 2025 revenue, anchoring the Software-Defined Perimeter market with policy engines and control planes. Services, however, are on pace for a 30.05% CAGR through 2031 as firms lean on design, migration, and managed detection expertise. BT’s global managed service based on the Zero Trust Exchange underscores the pivot to as-a-service consumption models. This mix suggests the Software-Defined Perimeter market will remain solution-led but service-dependent for execution.
Managed engagements cover architecture blueprints, pilot staging, and 24×7 incident response—tasks that internal teams cannot absorb amid talent shortfalls. As organizations unify identity, device, and application postures, specialist partners fine-tune conditional-access logic and continuous verification loops.


By Connectivity Model: Endpoint-centric Gains Momentum Amid Edge Computing Convergence
Cloud-edge connectivity secured 51.90% of 2025 spend, but endpoint-centric models are set to outpace at a 33.62% CAGR. Rising edge workloads and IoT adoption pull enforcement closer to the device, aligning with Zero Trust SASE nodes that collapse inspection into single-pass exchanges. Supermicro’s cloud-managed gateways showcase how lightweight agents and over-the-air policy pushes deliver context-aware shields at the network’s extreme.
Latency-sensitive industries such as manufacturing and healthcare value this proximity, especially when device operating systems cannot host full agents. As multi-access edge computing matures, endpoint-centric frameworks will anchor new micro-perimeters around every sensor and actuator, reinforcing Software-Defined Perimeter market resilience.
By Deployment Mode: Hybrid Architectures Bridge Legacy and Cloud-native Requirements
Cloud instances represented 68.55% of 2025 revenue thanks to on-demand scalability and global reach. Hybrid deployments are poised for a 29.82% CAGR because regulated sectors still maintain on-premises data stores that must connect securely with SaaS and IaaS. The Department for Levelling Up achieved an 80% drop in session setup times by pairing cloud control planes with local gateways, illustrating the flexibility of a hybrid Software-Defined Perimeter market size for mixed topologies.
Enterprises phase in cloud brokers for new workloads while retaining on-site enforcement for sovereign data, meeting residency laws without re-architecting critical apps. As jurisdictional rules evolve, hybrid modes will remain a strategic middle ground that sustains migration velocity.
By Organization Size: SMEs Embrace Simplified Solutions Despite Resource Constraints
Large enterprises command 60.95% of current spend, yet SMEs show a 28.62% CAGR as turnkey SaaS lowers entry barriers. Clientless browser isolation, policy templates, and AI-guided baselines let lean teams adopt enterprise-grade safeguards with minimal tuning. EU projects such as the PUZZLE Framework validate blueprint-driven deployments that diagnose vulnerabilities and automate response cycles, benefiting the broader Software-Defined Perimeter industry.
As mid-market firms digitize supply chains, they favor subscription-priced models that shift capex to opex and outsource 24×7 monitoring. This pattern expands addressable demand and diversifies revenue away from a few flagship accounts.
By End-User Industry: Healthcare Accelerates Adoption Amid Legacy System Challenges
BFSI maintained a 21.05% share in 2025, reflecting its early pivot to micro-segmentation to curb lateral breach propagation. Healthcare now leads growth with a 31.28% CAGR, pressured by telemedicine traffic and connected medical devices that lack modern authentication stacks. Application-layer segmentation shields legacy imaging equipment, while continuous posture checks guard patient data in transit, reinforcing the Software-Defined Perimeter market across life sciences.
In manufacturing, Industry 4.0 plants require secure robot-to-cloud telemetry. Government and defense agencies extend zero-trust to contractors in order to retain procurement eligibility under Executive Order mandates.
Geography Analysis
North America generated 39.05% of 2025 revenue, underpinned by federal zero-trust edicts and mature cloud infrastructure. Executive Order 14144 mandates secure-by-design software for agencies, sustaining funnel growth among contractors. Enterprises across critical infrastructure adopt Software-Defined Perimeter market controls to pass audit checkpoints and win public-sector bids.
Asia-Pacific is the fastest-growing territory at a 27.90% CAGR. Accelerated digitization, elevated breach costs of USD 30 million per incident, and government-led cyber programs spur spending. Telcos supply network-slice APIs that embed identity, making SDP adoption viable even where skills are scarce. Despite acute talent gaps, cloud-hosted policy brokers offset operational hurdles, broadening the Software-Defined Perimeter market footprint in Japan, Australia, India, and Singapore.
Europe follows with GDPR-driven demand for granular access and data sovereignty. Cloud brokers that geofence workloads—while authenticating users via EU-hosted IdPs—help firms satisfy cross-border transfer rules. Middle East and Africa remain nascent but gain traction through smart-city builds and oil-and-gas digitization. Government grants and regional SOC hubs foster early pilots, paving the way for wider Software-Defined Perimeter market penetration.

Competitive Landscape
The market is moderately concentrated. Platform leaders such as Zscaler process over 500 billion daily transactions for 8,600 customers, showcasing cloud scale that deters smaller rivals. Strategic alliances deepen reach: Zscaler integrates Okta for adaptive policies, CrowdStrike for threat telemetry, and NVIDIA AI engines for automated response.
Acquisition velocity shapes boundaries. Check Point’s USD 490 million buyout of Perimeter 81 adds SSE assets and compresses valuations, signaling maturity. Palo Alto Networks folded IBM’s QRadar cloud assets into Cortex Xsiam, cross-training 1,000 IBM consultants to expand its funnel. Networking incumbents such as Cisco insert SDP modules into SASE suites, leveraging existing SD-WAN footprints.
Telcos emerge as channel disruptors. BT bundles Zero Trust Exchange services, while T-Mobile couples SASE slices with SIM authentication, turning network providers into security brokers. Vendor differentiation now hinges on unified policy engines, AI-driven analytics, and pre-integrated ecosystems that shrink deployment time across the Software-Defined Perimeter market.
Software-Defined Perimeter Industry Leaders
Perimeter 81
ZScaler
Cisco Systems, Inc
Okta, Inc
APPGate
- *Disclaimer: Major Players sorted in no particular order

Recent Industry Developments
- March 2025: Zscaler and BT unveiled a managed security service built on the Zero Trust Exchange, processing 400 billion daily transactions.
- February 2025: Check Point completed the USD 490 million acquisition of Perimeter 81, expanding SSE capabilities.
- February 2025: Check Point completed the USD 490 million acquisition of Perimeter 81, expanding SSE capabilities.
- March 2025: Zscaler and BT unveiled a managed security service built on the Zero Trust Exchange, processing 400 billion daily transactions.


Global Software-Defined Perimeter Market Report Scope
A software-defined perimeter is an approach to computer security that micro-segments network access and eliminates the surface of attack. It authenticates and authorizes all endpoints that try to access a particular infrastructure and reduces the surface area of attack by hiding network resources from unauthorized users. It operates in cloud networks, provides expandable security, and eliminates credential theft, internal network attacks, malware, and man-in-the-middle attacks.
The software-defined perimeter market is segmented by type (solutions and services), by deployment mode (cloud and on-premise), by end-user verticals (BFSI, telecom and it, healthcare, retail, and government), and by geography (North America, Europe, Asia-Pacific, and Rest of the World).
The market sizes and forecasts regarding value (USD million) for all the above segments are provided.
| Solutions |
| Services |
| Cloud Edge |
| Data-centre Gateway |
| Endpoint-centric (Client/Agent) |
| Cloud |
| On-Premise |
| Hybrid |
| Large Enterprises |
| Small and Medium Enterprises (SMEs) |
| BFSI |
| IT and Telecom |
| Healthcare and Life-Sciences |
| Retail and E-commerce |
| Government and Defence |
| Manufacturing, Energy and Others |
| North America | United States | |
| Canada | ||
| Mexico | ||
| South America | Brazil | |
| Argentina | ||
| Rest of South America | ||
| Europe | United Kingdom | |
| Germany | ||
| France | ||
| Spain | ||
| Italy | ||
| Rest of Europe | ||
| Asia-Pacific | China | |
| Japan | ||
| India | ||
| South Korea | ||
| ASEAN | ||
| Rest of Asia-Pacific | ||
| Middle East and Africa | Middle East | GCC |
| Turkey | ||
| Rest of Middle East | ||
| Africa | South Africa | |
| Nigeria | ||
| Rest of Africa | ||
| By Offering | Solutions | ||
| Services | |||
| By Connectivity Model | Cloud Edge | ||
| Data-centre Gateway | |||
| Endpoint-centric (Client/Agent) | |||
| By Deployment Mode | Cloud | ||
| On-Premise | |||
| Hybrid | |||
| By Organisation Size | Large Enterprises | ||
| Small and Medium Enterprises (SMEs) | |||
| By End-User Industry | BFSI | ||
| IT and Telecom | |||
| Healthcare and Life-Sciences | |||
| Retail and E-commerce | |||
| Government and Defence | |||
| Manufacturing, Energy and Others | |||
| By Geography | North America | United States | |
| Canada | |||
| Mexico | |||
| South America | Brazil | ||
| Argentina | |||
| Rest of South America | |||
| Europe | United Kingdom | ||
| Germany | |||
| France | |||
| Spain | |||
| Italy | |||
| Rest of Europe | |||
| Asia-Pacific | China | ||
| Japan | |||
| India | |||
| South Korea | |||
| ASEAN | |||
| Rest of Asia-Pacific | |||
| Middle East and Africa | Middle East | GCC | |
| Turkey | |||
| Rest of Middle East | |||
| Africa | South Africa | ||
| Nigeria | |||
| Rest of Africa | |||


Key Questions Answered in the Report
What is driving the rapid growth of the Software-Defined Perimeter market?
Rising multi-cloud adoption, zero-trust mandates such as U.S. Executive Order 14144, and persistent VPN vulnerabilities are pushing organizations toward identity-centric controls that expand the market at a 26.64% CAGR.
How large will the Software-Defined Perimeter market be by 2031?
The Software-Defined Perimeter market size is projected to reach USD 47.64 billion by 2031 on the strength of cloud-delivered platforms and managed-service uptake.
Which connectivity model is growing fastest within SDP deployments?
Endpoint-centric architectures, aligned with edge-computing and IoT rollouts, are forecast to expand at a 33.62% CAGR, overtaking cloud-edge growth rates.
Why are services segments outpacing product revenue?
Skill shortages leave 2.8 million cybersecurity roles unfilled, so enterprises rely on professional and managed services, which are tracking a 30.05% CAGR.
Which region presents the strongest future opportunity?
Asia-Pacific is expected to log a 27.90% CAGR through 2031, fuelled by double-digit cybersecurity budget growth and carrier-backed SASE slices that simplify adoption.
How are executive orders influencing vendor roadmaps?
Orders 14028 and 14144 require federal agencies and suppliers to adopt zero-trust baselines, prompting vendors to harden software supply chains and embed continuous verification into product suites.
Page last updated on:


