Playout Automation And Channel-In-A-Box Market Size and Share
Market Overview
| Study Period | 2020 - 2031 |
|---|---|
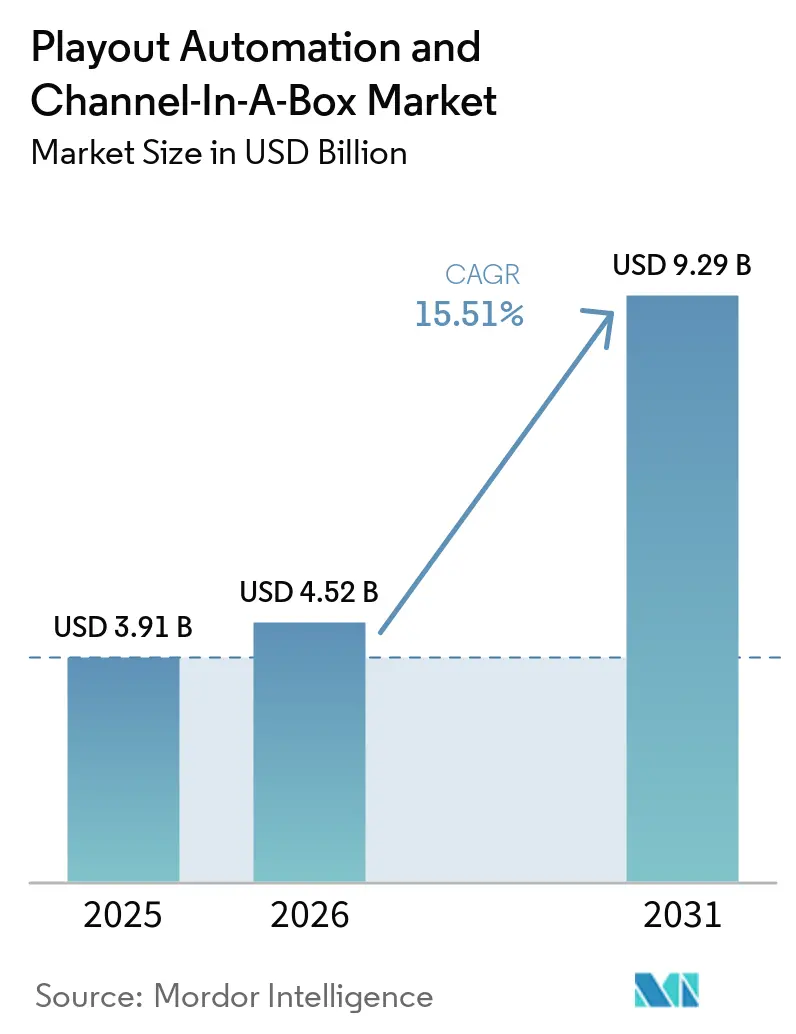
| Market Size (2026) | USD 4.52 Billion |
| Market Size (2031) | USD 9.29 Billion |
| Growth Rate (2026 - 2031) | 15.51% CAGR |
| Fastest Growing Market | Asia Pacific |
| Largest Market | North America |
| Market Concentration | Medium |
Major Players *Disclaimer: Major Players sorted in no particular order Image © Mordor Intelligence. Reuse requires attribution under CC BY 4.0. | |
Playout Automation And Channel-In-A-Box Market Analysis by Mordor Intelligence
The playout automation and channel-in-a-box market size is projected to expand from USD 3.91 billion in 2025 and USD 4.52 billion in 2026 to USD 9.29 billion by 2031, registering a 15.51% CAGR between 2026 and 2031. Intensifying migration from satellite and SDI master control to software-defined IP workflows is compressing launch timelines, lowering entry costs, and enabling elastic scaling across linear, FAST, and pop-up feeds. Broadcasters are prioritizing cloud-native deployment to meet multi-platform delivery demands while embedding ML-driven automated QC to reduce errors and staffing overhead. Competitive pressure from cloud entrants is accelerating feature convergence around API-first orchestration, real-time graphics, and dynamic ad insertion, while cybersecurity posture and skill availability in SMPTE ST 2110 remain gating factors for many emerging-market projects.
Key Report Takeaways
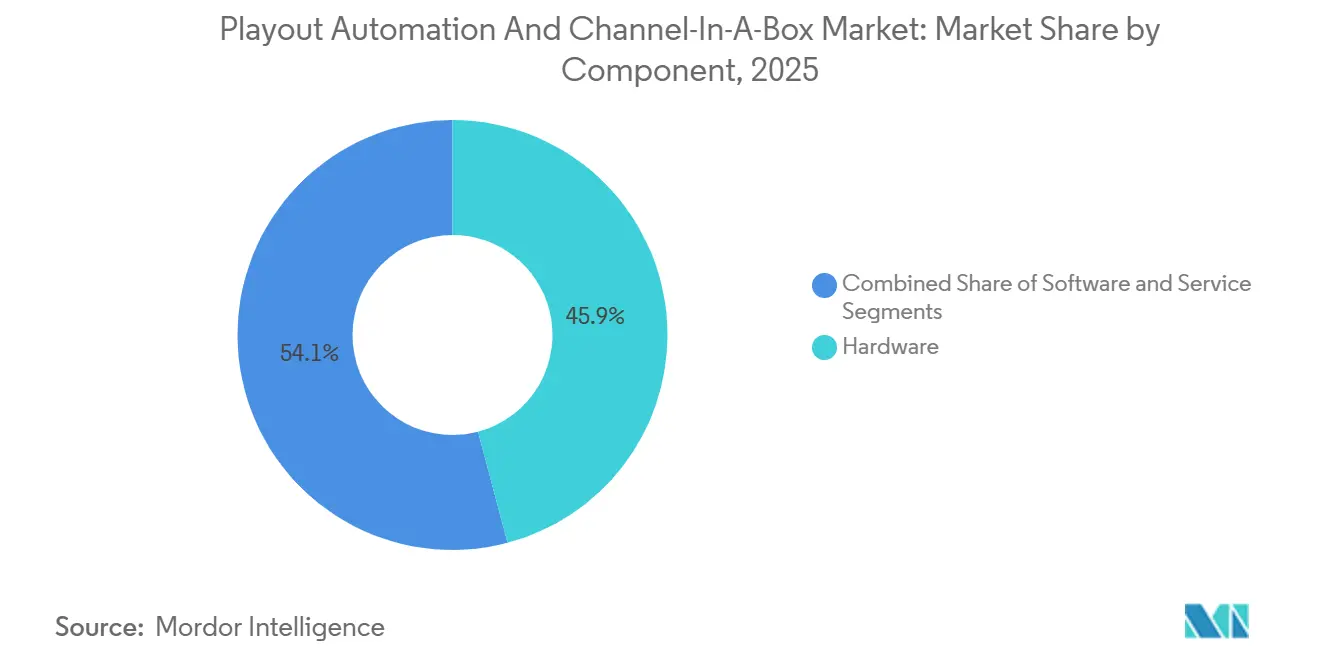
- By component, hardware led with 45.89% of playout automation and channel-in-a-box market share in 2025, while services are advancing at a 16.11% CAGR through 2031.
- By deployment model, cloud captured 41.36% revenue in 2025 and is expanding at a 16.17% CAGR, outpacing on-premise and hybrid alternatives.
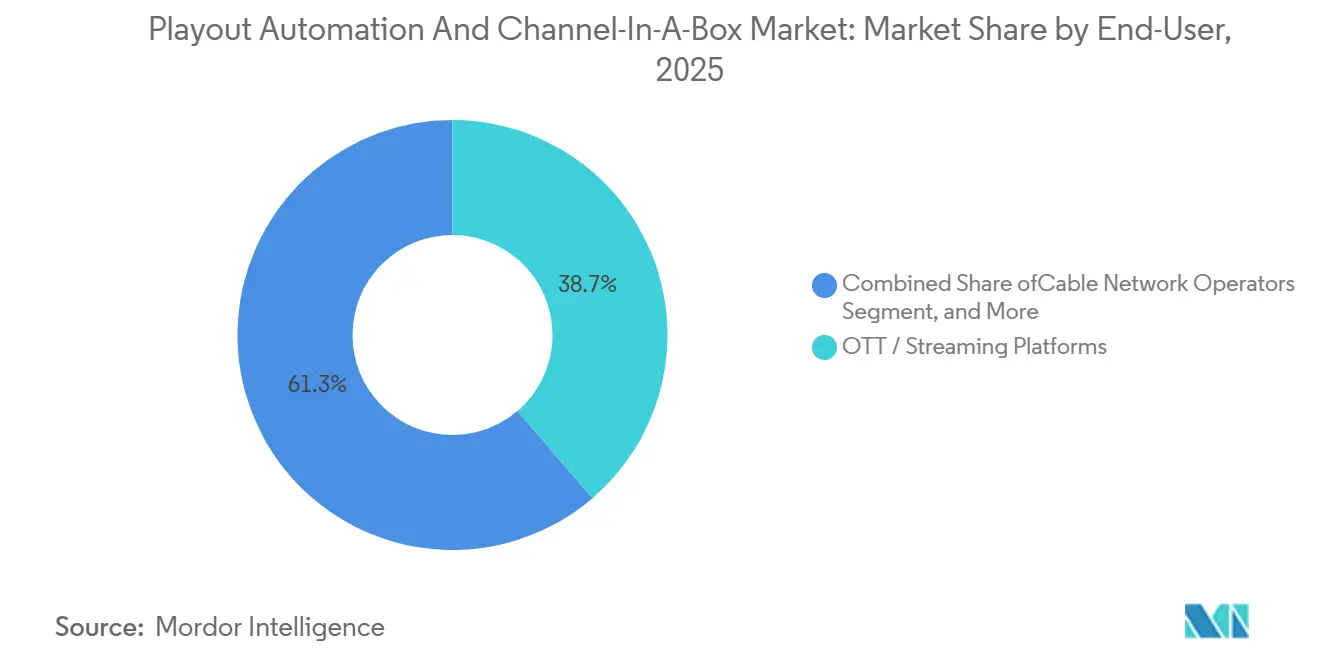
- By end-user industry, OTT and streaming platforms commanded 38.72% share in 2025 and show the fastest 16.31% CAGR to 2031.
- By channel type, multi-channel automation accounted for 54.28% share of the playout automation and channel-in-a-box market size in 2025 and is growing at 15.71% CAGR.
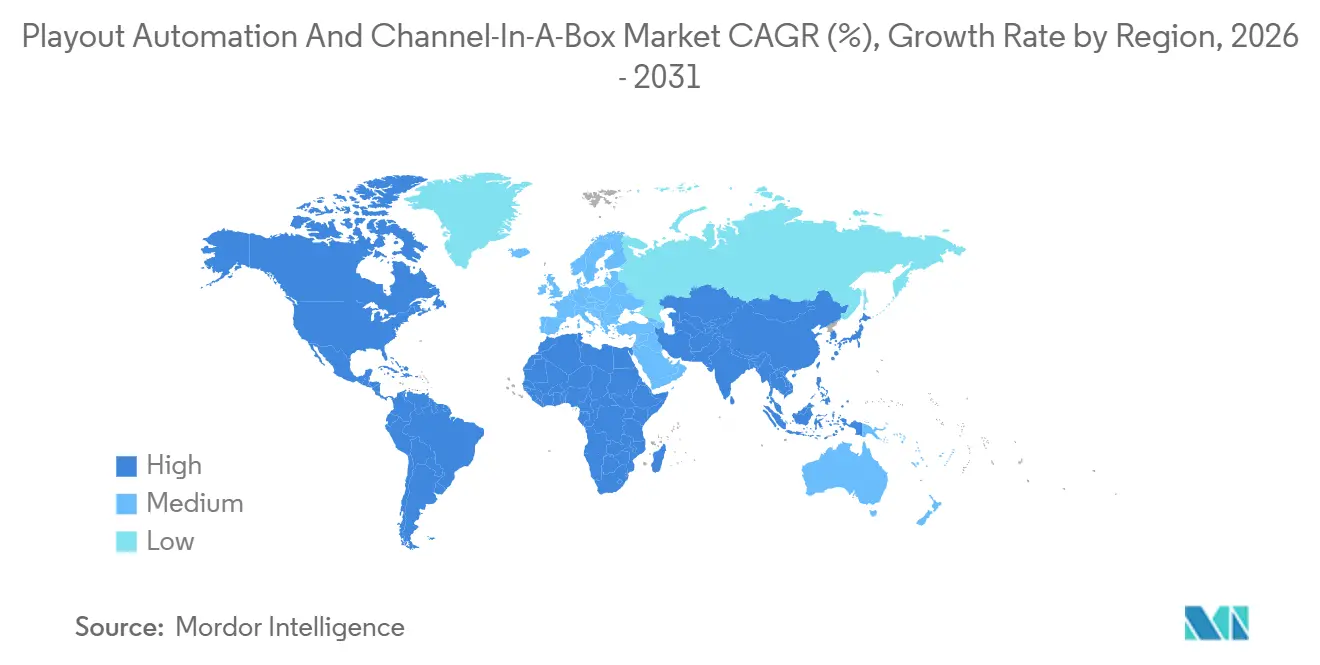
- By geography, North America held 32.84% revenue in 2025, while Asia-Pacific is the fastest-growing region at a 16.51% CAGR.
Note: Market size and forecast figures in this report are generated using Mordor Intelligence’s proprietary estimation framework, updated with the latest available data and insights as of January 2026.
Global Playout Automation And Channel-In-A-Box Market Trends and Insights
Drivers Impact Analysis*
| Driver | (~) % Impact on CAGR Forecast | Geographic Relevance | Impact Timeline |
|---|---|---|---|
| Shift Toward IP-Based Playout Infrastructure | +3.2% | Global, early in North America and Europe, accelerating in Asia-Pacific | Medium term (2-4 years) |
| Proliferation of OTT and FAST Channels | +4.1% | Global, led by North America, rapid in Asia-Pacific and Europe | Short term (≤ 2 years) |
| Need for Cost-Effective Multi-Channel Ops | +2.8% | Global, strongest among emerging markets and mid-sized broadcasters | Medium term (2-4 years) |
| Regulatory Push Toward HD and UHD | +1.9% | Asia-Pacific, Europe, Middle East | Long term (≥ 4 years) |
| Adoption of ML-Driven Automated QC | +1.6% | North America and Europe first movers, spreading to Asia-Pacific | Medium term (2-4 years) |
| Demand for Disaster-Recovery Pop-Up Channels | +1.2% | Global, higher in disaster-prone and unstable regions | Short term (≤ 2 years) |
| Source: Mordor Intelligence | |||
Shift Toward IP-Based Playout Infrastructure
Broadcasters are retiring SDI master-control rooms in favor of SMPTE ST 2110 IP workflows that enable remote production, flexible routing, and cloud-burst capacity for major events. PBS replaced satellite links with Ateme TITAN Edge across its MPLS backbone connecting more than 170 stations, reducing distribution cost by 50% and paving the way for ATSC 3.0 regional rollout. BBC World Service completed an IP migration using Encompass Altitude Connect with Zixi transport, proving reliability for global radio and TV partners. While IP routing trims cabling and hardware, packet loss management and frame-accurate sync remain critical for live sports, and skill shortages in Asia-Pacific delay full adoption.
Proliferation of OTT and FAST Channels
OTT and FAST operators expand quickest as advertisers pivot to programmatic inventory and viewers favor ad-supported streaming. Amagi processed 21% more video hours year over year on its CLOUDPORT platform, with most new channels classed as FAST. AIS PLAY doubled Thai League football feeds after adding six PlayBox Neo channel-in-a-box units, underscoring regional demand for low-cost rapid launch. Cloud playout eliminates USD 500 000 hardware spends and allows seasonal pop-up channels, though fragmented advertising-disclosure rules create compliance complexity across jurisdictions.
Need for Cost-Effective Multi-Channel Operations
Multi-channel automation captured 54.28% share in 2025 as central orchestration reduces per-channel cost and staff. Sky Network Television swapped legacy appliances for Grass Valley AMPP cloud pipelines across 10 UHD and HD feeds, scaling automatically for marquee sports while preserving precise ad triggers.[1]Grass Valley, “Sky Network Television Transforms Playout With AMPP,” grassvalley.com Great American Media outsourced three national networks to Comcast Technology Solutions, gaining 24-hour operations, graphics, SCTE insertion, and multi-MVPD delivery without capital commitment. Managed-service models claim up to 20% cost savings and let broadcasters focus on content strategy rather than routine engineering.
Regulatory Push Toward HD and UHD Broadcasting
Mandates for HD and UHD spur long-term equipment refresh across Asia-Pacific, Europe, and the Middle East. Japan’s ARIB maintains detailed UHD specs such as STD-B31 for transmission and STD-B24 for data coding, expediting vendor certification. The European Broadcasting Union’s R 153 and R 128 harmonize HDR and loudness guidelines, easing cross-border content exchange. U.S. ATSC 3.0 rulings require simulcast of ATSC 1.0 during transition, creating dual-playout demands that favor channel-in-a-box systems capable of multiple parallel outputs.[2]FCC, “ATSC 3.0 Guidelines,” fcc.gov Compliance references to ISO 9001 and ISO 27001 are increasingly written into public-service tenders, forcing vendors to harden quality and security processes.
Restraints Impact Analysis*
| Restraint | (~) % Impact on CAGR Forecast | Geographic Relevance | Impact Timeline |
|---|---|---|---|
| High Upfront Capital Expenditure for Hardware | -2.1% | Global, acute for small and mid-sized players and emerging markets | Short term (≤ 2 years) |
| Complex Integration with Legacy Systems | -1.8% | Global, greater friction in North America and Europe where installed base is large | Medium term (2-4 years) |
| Skill Shortage in SMPTE ST 2110 Workflows | -1.3% | Asia-Pacific and Middle East, moderate in Europe | Medium term (2-4 years) |
| Cybersecurity Concerns for Cloud Playout | -1.1% | Global, heightened in regulated and public-service environments | Long term (≥ 4 years) |
| Source: Mordor Intelligence | |||
High Upfront Capital Expenditure for Hardware Refresh
Smaller broadcasters struggle to finance USD 500 000 master-control overhauls, delaying IP adoption and subtracting 2.1 percentage points from growth. Although cloud models offer pay-as-you-go pricing, migration still incurs network upgrades and dual-run periods. Sky Deutschland’s shift of Vodafone cable feeds to IP required costly set-top box swaps to Sky Q hardware, demonstrating downstream capital impacts.
Complex Integration with Legacy Automation Systems
Serial-based, proprietary automation complicates IP migration, extending project timelines and shaving 1.8 percentage points off CAGR. Sky New Zealand integrated Grass Valley Playout X with legacy traffic databases through AMPP OS APIs, but custom bridges inflated cost and risk. Gateway devices to convert SDI to ST 2110 add latency and license overhead, while vendor-specific file formats lock customers into costly re-ingest cycles when switching suppliers.
*Our forecasts treat driver/restraint impacts as directional, not additive. The impact forecasts reflect baseline growth, mix effects, and variable interactions.
Segment Analysis
By Component: Services Gain Momentum as Broadcasters Outsource Operations
Services recorded the fastest 16.11% CAGR while hardware held the largest 45.89% share of the playout automation and channel-in-a-box market in 2025. Managed playout providers bundle origination, encoding, monitoring, and distribution so content owners avoid staffing 24-hour control rooms. Comcast Technology Solutions consolidated multiple client feeds into a single IP Broadcast Operations Center, illustrating how centralized oversight trims personnel and facility expense. Hardware remains critical in markets enforcing data-sovereignty, where on-premise appliances satisfy local storage mandates. Subscription-based software maintenance converts one-time capital sales into recurring revenue, letting vendors smooth cash flow and continuously push feature updates. Over the forecast period, the playout automation and channel-in-a-box market size for services is widening as broadcasters reallocate capex toward content acquisition rather than infrastructure upkeep.
Demand for integrated support contracts also lifts service revenue, with PlayBox Neo’s 24-hour ASM and TS programs guaranteeing software upgrades and remote troubleshooting. North America and Europe drive adoption because mature ecosystems value predictable opex. Asia-Pacific and the Middle East lean toward hardware while wide-area bandwidth and latency remain concerns for live sports. Hybrid engagements that place ingest hardware on site but route schedules to cloud orchestration are emerging as a transitional bridge, anchoring vendor relationships and locking in multiyear SLA revenue streams.


By Deployment Model: Cloud Leads Rapid Channel Launches
Cloud captured 41.36% revenue in 2025, growing 16.17% annually as broadcasters prioritize time-to-market and elastic scaling. Amagi CLOUDPORT provisions multi-region redundancy with AES-128 encryption and role-based permissions, allowing clients to stand up global FAST networks in days. The playout automation and channel-in-a-box market share for cloud rises when operators spin seasonal pop-up feeds or add language variants without new on-premise hardware. Hybrid models remain popular where baseline playout stays local but surges burst to AWS or Azure during major tournaments, balancing latency and scalability.
On-premise systems stay relevant for national networks bound by sovereignty laws or reliant on SDI contribution. Arqiva offers deployment choices from single-region cloud to customer-owned tenancy, giving engineers precise control over geographic failover.[3]Arqiva, “Cloud Playout,” media.arqiva.network Cybersecurity risk tempers cloud enthusiasm, but vendors respond with ISO 27001 compliance and real-time threat monitoring. As internet backbone capacity improves, cloud’s unit economics strengthen, positioning it to eclipse on-premise share before 2031.
By End-User Industry: OTT Platforms Drive Highest Growth
OTT and streaming platforms controlled 38.72% revenue in 2025 and deliver the leading 16.31% CAGR. Advertisers favor programmatic inventory and dynamic ad insertion that cloud playout supports natively. FAST operators leverage a single ingest workflow to push linear, VOD, and social clips, maximizing asset reuse. Terrestrial and satellite broadcasters wrestle with dual-format simulcast during ATSC 3.0 and DVB-T2 transitions, weighing on their budget for new channels. Cable operators migrate to IP to cut head-end lease fees, as shown by Sky Deutschland moving Vodafone cable viewers to IPTV delivery.
Corporate, education, and government channels continue to represent small yet resilient niches within the market. These sectors often prefer single-channel appliances tailored for specific purposes, such as managing internal networks or disseminating emergency alerts efficiently. Over the long term, the market size for playout automation and channel-in-a-box solutions catering to OTT cohorts is projected to experience significant growth. This expansion is primarily driven by the increasing penetration of connected TVs in emerging economies, where access to such technologies is steadily improving. Additionally, the growing acceptance of ad-supported models among viewers is expected to further contribute to this market's growth trajectory.
By Channel Type: Multi-Channel Automation Dominates
Multi-channel setups owned 54.28% revenue in 2025 and rise 15.71% per year because one orchestration layer can schedule dozens of feeds. Grass Valley’s Playout X automates playlist ingestion, graphics, and SCTE marker insertion, reducing manual intervention while scaling resources horizontally. Single-channel systems persist for premium sports services that demand guaranteed bandwidth and minimal latency, or where regulatory constraints necessitate local storage. Vendors such as makalu introduced pay-per-use cloud pop-up options that replicate traditional single-channel appliances without capital burden, blurring boundaries between the two categories.
As FAST (Free Ad-Supported Television) bouquets exceed 50 feeds at major aggregators, multi-channel suites provide significant cost efficiencies by distributing software licensing and monitoring expenses across the entire portfolio. This approach effectively reduces the operational expenditure per feed, making it a more economical solution. The market share for multi-channel platforms in the playout automation and channel-in-a-box segment is projected to grow further. However, regional compliance regulations, particularly in markets with strict protected speech laws, are likely to continue driving demand for single-channel solutions to ensure adherence to local broadcasting standards.
Geography Analysis
North America retained 32.84% market share in 2025, supported by early SMPTE ST 2110 adoption and robust managed-service ecosystems. PBS’s conversion to IP terrestrial distribution cut satellite spend by 50%, proving commercial viability for public broadcasters. Comcast’s Dry Creek hub centralizes playout for broadcast and streaming brands, highlighting scale economics. Canadian and Mexican uptake is slower due to rural bandwidth gaps, yet both leverage cross-border service bureaus housed in the United States. FCC rules mandating parallel ATSC 1.0 and 3.0 outputs elevate demand for channel-in-a-box appliances capable of multi-standard playout.
Asia-Pacific records the fastest 16.51% CAGR. India, Japan, and Southeast Asia replace SDI with IP to support regional language feeds, while OTT operators chase mobile-first consumers. Sky New Zealand’s AMPP deployment underscores hybrid cloud momentum. Thailand’s AIS PLAY doubled sports channels via PlayBox Neo appliances, reflecting how local rights deals drive incremental capacity. Japan’s stringent ARIB UHD specifications quicken hardware refresh cycles, whereas China and India lean on on-premise gear for sovereignty reasons. South Korea and Australia run baseline playout locally then burst to cloud during live events, balancing cost and performance.
Europe demonstrates steady growth as public-service mandates require universal access yet budgets push engineers toward IP to curtail satellite and cable costs. BBC World Service completed a full IP handoff across the continent, and Sky Deutschland shifted Vodafone cable customers to IPTV, reducing head-end fees while adding interactive features. Sweden’s BoxerTV exit from DTT catalyzes debate over terrestrial spectrum value, nudging policymakers toward OTT support. South America, the Middle East, and Africa trail due to connectivity gaps and import tariffs, but managed-service vendors entice broadcasters with opex models that convert capex into subscription fees, stimulating gradual adoption.

Competitive Landscape
Competition in the playout automation and channel-in-a-box market is moderately consolidated, with the top five suppliers, Grass Valley, Imagine Communications, Harmonic, Evertz, and Pebble Beach Systems, controlling about 40-45% of global revenue. These leading players maintain their dominance by leveraging established customer relationships, comprehensive product portfolios, and strong brand recognition. However, the market is witnessing increasing competition from cloud-native challengers such as Amagi, PlayBox Neo, and Dalet. These emerging players are gaining traction in the OTT and FAST segments by offering flexible pay-as-you-go pricing models and API-first orchestration, which allow customers to bypass lengthy capital expenditure approval processes. To counter this, incumbents are integrating advanced machine-learning-based quality control (QC) tools into their solutions. For instance, Telestream, Colorfront, and Point Media have developed tools capable of identifying sync, loudness, and grading anomalies in real time, enhancing operational efficiency for broadcasters. Additionally, vendors are bundling playout solutions with other services such as ingest, encoding, monitoring, and CDN routing to strengthen customer retention, increase switching costs, and create a more comprehensive service offering. Strategic acquisitions, such as Imagine’s planned purchase of Pixel Power, aim to combine graphics and automation capabilities, simplifying procurement processes for broadcasters that previously relied on multiple point solutions.[4]Imagine Communications, “Imagine Acquires Pixel Power,” imaginecommunications.com Similarly, EVS’s acquisition of Telemetrics expands its portfolio into robotic camera control, signaling a growing convergence between live production and downstream playout operations.
New growth opportunities are emerging in niche areas such as disaster-recovery pop-up capacity and multilingual feed management. Disaster-recovery solutions, offered by companies like Arqiva and makalu, provide on-demand channels that can be deployed within minutes during emergencies such as natural disasters or political unrest. These solutions are becoming increasingly important as broadcasters seek to ensure uninterrupted service during crises. Meanwhile, multilingual feed management is gaining prominence as diaspora audiences demand seamless switching between subtitles and audio tracks in their preferred languages. This trend has created opportunities for regional specialists who excel in customizing compliance workflows to meet local market requirements, including content-rating regulations, advertising disclosures, and time-shift rules. These specialists are well-positioned to address the unique needs of broadcasters operating in diverse regulatory environments. Furthermore, price competition is intensifying in the entry-level single-channel box segment, where vendors are focusing on affordability to attract smaller broadcasters. In contrast, enterprise-level deals are increasingly influenced by factors such as the depth of service-level agreements (SLAs), security certifications, and the transparency of product roadmaps, which are critical for large-scale deployments.
Supply-chain resilience has become a key differentiator in the market, particularly concerning FPGA-based I/O cards, as vendors strive to reduce lead times and ensure timely delivery of critical components. This focus on supply-chain efficiency is especially important in a competitive market where delays can result in lost business opportunities. Additionally, energy efficiency is emerging as a significant consideration, with market participants emphasizing sustainability metrics to align with broadcasters’ growing focus on environmental responsibility. Many broadcasters are now including sustainability clauses in their requests for proposals (RFPs), prompting vendors to highlight the energy-saving features of their solutions. Overall, the bargaining power in the market remains balanced, as customers have the flexibility to combine hardware, software, and managed services from multiple suppliers without facing significant interoperability challenges. This flexibility allows broadcasters to optimize their operations while maintaining competitive pricing and service quality, ensuring a dynamic and evolving market landscape.
Playout Automation And Channel-In-A-Box Industry Leaders
Harmonic Inc.
Imagine Communications Corp.
Pebble Beach Systems Group plc
Grass Valley Canada Holdings Limited
Evertz Microsystems Ltd.
- *Disclaimer: Major Players sorted in no particular order

Recent Industry Developments
- April 2026: AJA Video Systems acquired Comprimato, adding low-latency JPEG XS codecs to bolster SMPTE ST 2110 product lines.
- April 2026: Grass Valley unveiled Framelight X integration with Playout X on AMPP at NAB 2026, enabling drag-and-drop asset registration that trims channel-launch time.
- April 2026: Dalet demonstrated Dalia AI assistant for multilingual transcription and localization, embedding C2PA content tracking for editorial integrity.
- April 2026: Sportway and Broadcast Solutions bought Studio Automated, expanding into centralized playout for mid-tier broadcasters.


Global Playout Automation And Channel-In-A-Box Market Report Scope
The Playout Automation and Channel-In-A-Box (CiaB) market refers to the global ecosystem of technologies, solutions, and services used to manage, schedule, control, and deliver broadcast and streaming content in a highly automated and integrated manner. This market encompasses both standalone playout automation systems and fully integrated Channel-In-A-Box solutions that combine multiple broadcast functions, such as ingest, scheduling, graphics insertion, content storage, and transmission, into a single, unified platform.
The Playout Automation and Channel-In-A-Box Market Report is Segmented by Component (Hardware, Software, and Services), Deployment Model (On-Premise, Cloud, and Hybrid), End-User Industry (Terrestrial and Satellite Broadcasters, Cable Network Operators, OTT/Streaming Platforms, and Other End-User Industries), Channel Type (Single-Channel Automation, and Multi-Channel Automation), and Geography (North America, South America, Europe, Asia-Pacific, and Middle East and Africa). The Market Forecasts are Provided in Terms of Value (USD).
| Hardware |
| Software |
| Services |
| On-Premise |
| Cloud |
| Hybrid |
| Terrestrial and Satellite Broadcasters |
| Cable Network Operators |
| OTT / Streaming Platforms |
| Other End-User Inudustries |
| Single-Channel Automation |
| Multi-Channel Automation |
| North America | United States | |
| Canada | ||
| Mexico | ||
| South America | Brazil | |
| Argentina | ||
| Rest of South America | ||
| Europe | United Kingdom | |
| Germany | ||
| France | ||
| Italy | ||
| Spain | ||
| Rest of Europe | ||
| Asia-Pacific | China | |
| Japan | ||
| India | ||
| South Korea | ||
| Rest of Asia-Pacific | ||
| Middle East and Africa | Middle East | United Arab Emirates |
| Saudi Arabia | ||
| Rest of Middle East | ||
| Africa | South Africa | |
| Egypt | ||
| Rest of Africa | ||
| By Component | Hardware | ||
| Software | |||
| Services | |||
| By Deployment Model | On-Premise | ||
| Cloud | |||
| Hybrid | |||
| By End-user Industry | Terrestrial and Satellite Broadcasters | ||
| Cable Network Operators | |||
| OTT / Streaming Platforms | |||
| Other End-User Inudustries | |||
| By Channel Type | Single-Channel Automation | ||
| Multi-Channel Automation | |||
| By Geography | North America | United States | |
| Canada | |||
| Mexico | |||
| South America | Brazil | ||
| Argentina | |||
| Rest of South America | |||
| Europe | United Kingdom | ||
| Germany | |||
| France | |||
| Italy | |||
| Spain | |||
| Rest of Europe | |||
| Asia-Pacific | China | ||
| Japan | |||
| India | |||
| South Korea | |||
| Rest of Asia-Pacific | |||
| Middle East and Africa | Middle East | United Arab Emirates | |
| Saudi Arabia | |||
| Rest of Middle East | |||
| Africa | South Africa | ||
| Egypt | |||
| Rest of Africa | |||


Key Questions Answered in the Report
What is the current playout automation and channel-in-a-box market size and projected growth to 2031?
The market is valued at USD 4.52 billion in 2026 and is forecast to reach USD 9.29 billion by 2031, posting a 15.51% CAGR.
Which deployment model is expanding fastest within playout automation solutions?
Cloud-based deployments lead with a 16.17% CAGR as broadcasters favor rapid channel launch and elastic scaling.
Why are OTT and FAST operators driving demand for channel-in-a-box offerings?
They need low-cost, API-driven playout that supports programmatic ad insertion and can spin up seasonal or pop-up channels quickly.
What is the main barrier slowing IP playout adoption among small broadcasters?
High upfront hardware refresh costs and the need to run legacy systems in parallel during migration constrain budgets.
Which region shows the highest growth rate through 2031?
Asia-Pacific posts the fastest 16.51% CAGR, propelled by IP migration in India, Japan, and Southeast Asia.
How concentrated is vendor competition in this market?
The top five firms hold roughly 40-45% share, indicating moderate concentration with room for regional specialists and cloud entrants.
Page last updated on:


