In-game Advertising Market Size and Share
Market Overview
| Study Period | 2020 - 2031 |
|---|---|
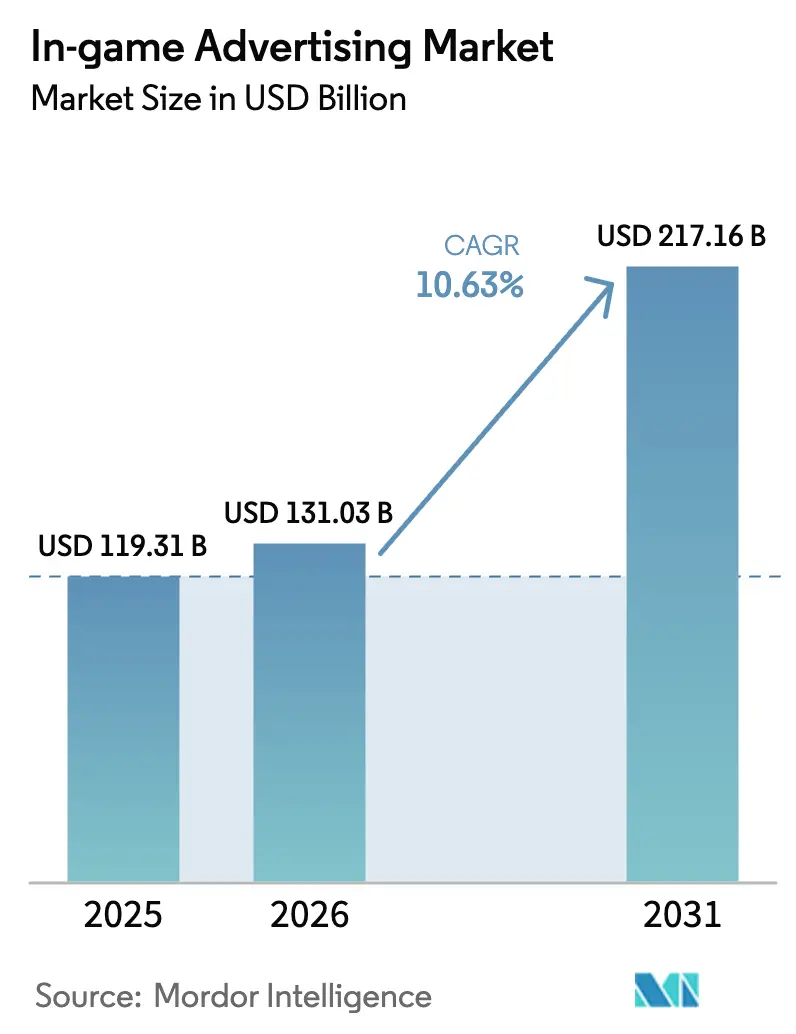
| Market Size (2026) | USD 131.03 Billion |
| Market Size (2031) | USD 217.16 Billion |
| Growth Rate (2026 - 2031) | 10.63% CAGR |
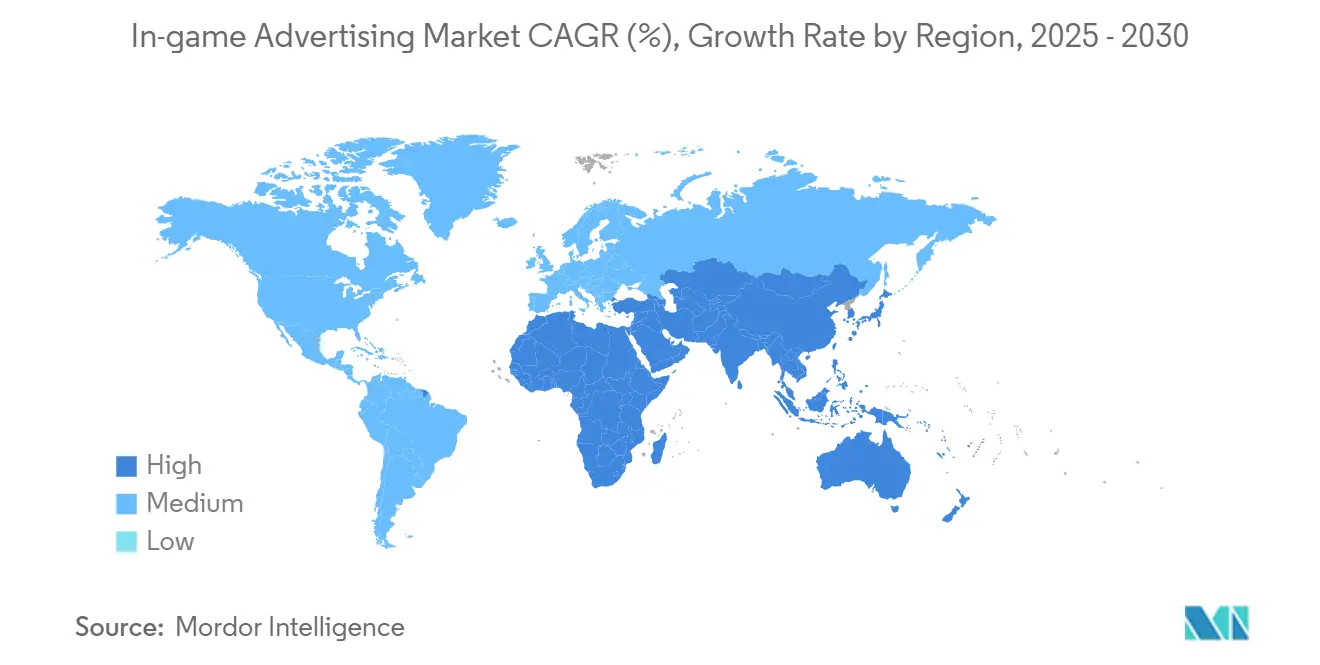
| Fastest Growing Market | Africa |
| Largest Market | North America |
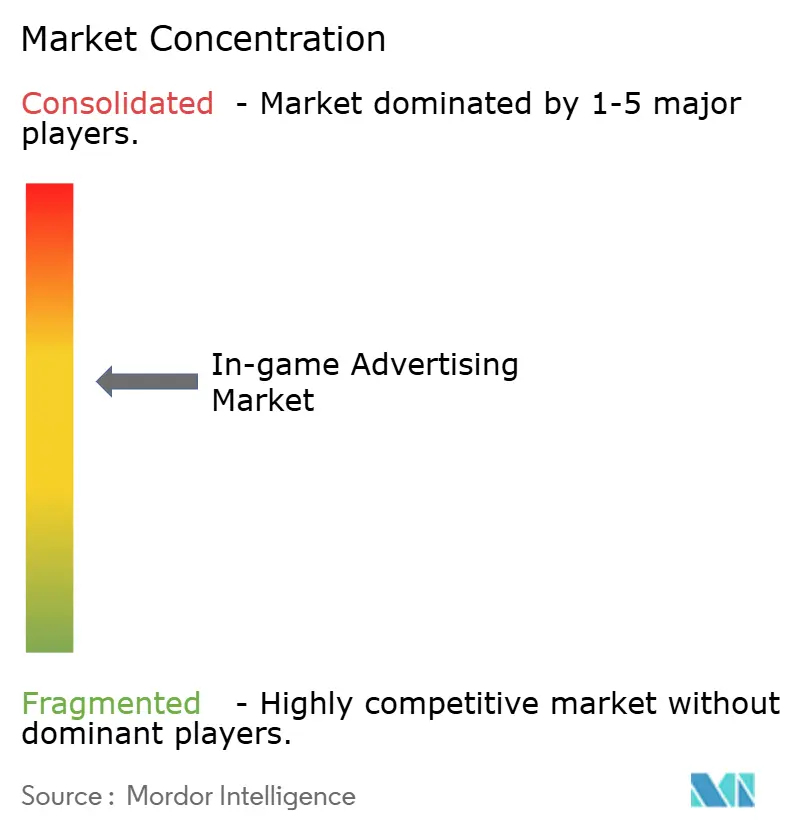
| Market Concentration | Medium |
Major Players *Disclaimer: Major Players sorted in no particular order Image © Mordor Intelligence. Reuse requires attribution under CC BY 4.0. | |
In-game Advertising Market Analysis by Mordor Intelligence
The in-game advertising market size is expected to increase from USD 119.31 billion in 2025 to USD 131.03 billion in 2026 and reach USD 217.16 billion by 2031, growing at a CAGR of 10.63% over 2026-2031. Brands are reallocating budgets from traditional display and video toward immersive environments where players actively engage with creative units. Engagement-led formats are pulling dollars away from passive banners as marketers push for measurable attention and brand lift. Cloud gaming, edge computing, and 5G are expanding premium inventory by removing latency that once limited real-time ad insertion. At the same time, privacy regulation and identity deprecation are steering spend toward deterministic contexts, positioning the in-game advertising market as a rare channel that pairs first-party data with creative flexibility.
Key Report Takeaways
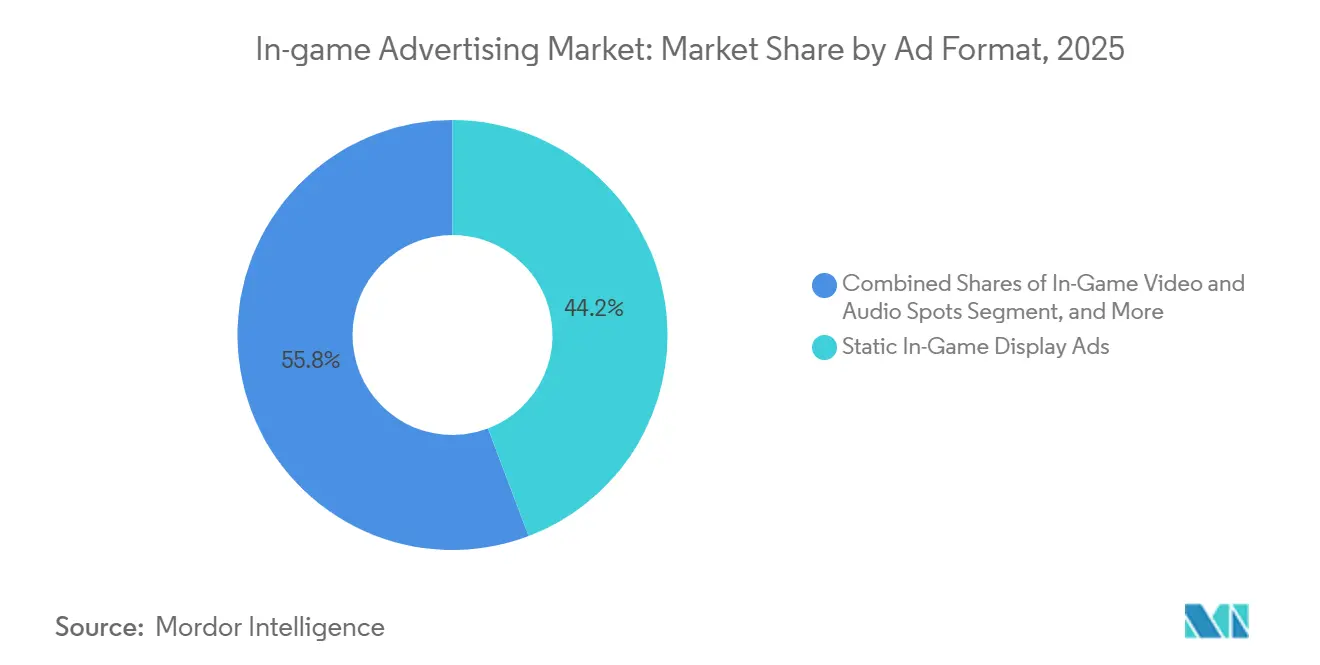
- By ad format, static in-game display ads held 44.23% of the in-game advertising market share in 2025, while rewarded and playable formats are projected to expand at an 11.58% CAGR through 2031.
- By device platform, PC titles accounted for 40.53% of the in-game advertising market size in 2025, and cloud and streaming games are forecast to grow at an 11.54% CAGR between 2026-2031.
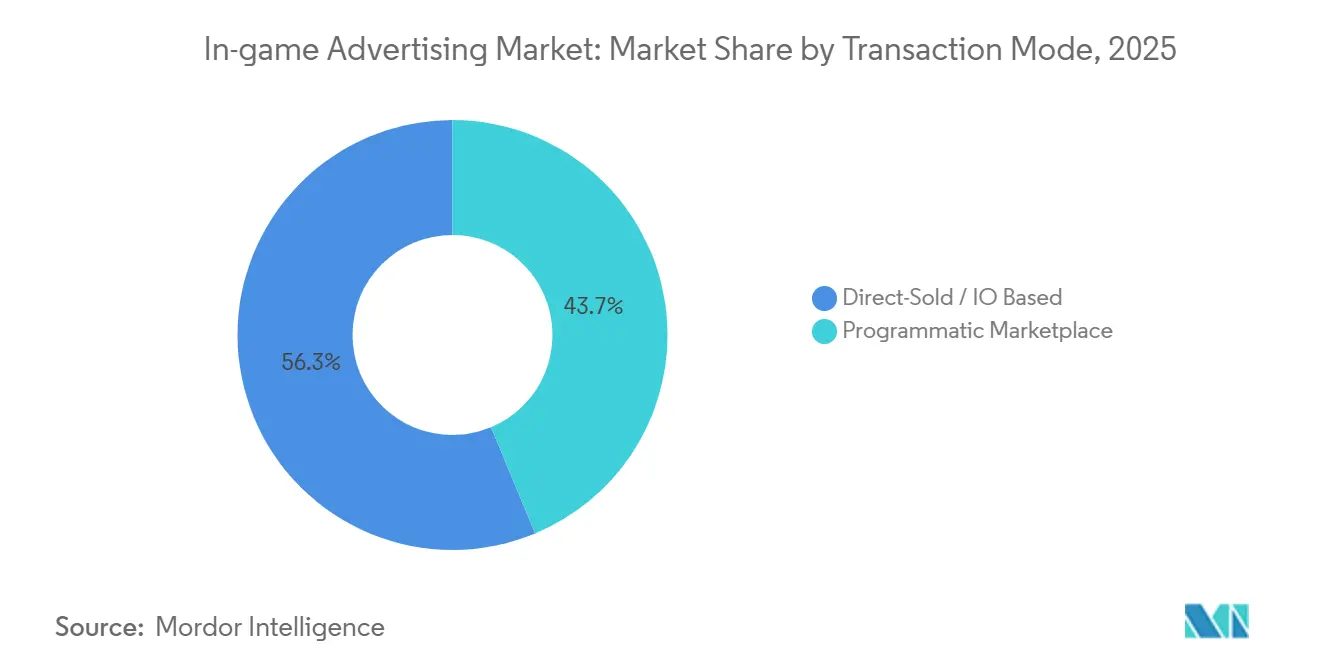
- By transaction mode, direct-sold deals accounted for 56.28% of revenue share in 2025, but programmatic exchanges are set to post a 12.02% CAGR through 2031.
- By region, North America led with a 33.12% revenue share in 2025, yet Africa is the fastest-growing region, with a 11.49% CAGR over the forecast window.
Note: Market size and forecast figures in this report are generated using Mordor Intelligence’s proprietary estimation framework, updated with the latest available data and insights as of January 2026.
Global In-game Advertising Market Trends and Insights
Drivers Impact Analysis*
| Driver | (~) % Impact on CAGR Forecast | Geographic Relevance | Impact Timeline |
|---|---|---|---|
| Surge In Reward-Based Playable Ads Adoption In Mobile Esports Tournaments | +2.1% | Global, Asia-Pacific And North America Focus | Medium Term (2–4 Years) |
| Advancements In Real-Time Rendering Enabling Dynamic Cross-Platform Placements | +1.8% | Global, Led By North America And Europe | Long Term (≥ 4 Years) |
| Brand Shift Toward Metaverse Product-Placement-Led Storytelling | +1.5% | Asia-Pacific Core, Spill-Over To North America And Europe | Medium Term (2–4 Years) |
| 5G Rollouts Accelerating Low-Latency Cloud-Gaming Monetization | +1.4% | Asia-Pacific, Middle East, Select North America Markets | Short Term (≤ 2 Years) |
| Programmatic AAA-Publisher Ad-Exchange Partnerships Unlocking Premium Inventory | +1.9% | North America And Europe, Expanding To Asia-Pacific | Medium Term (2–4 Years) |
| Rising CPG And Automotive Spend On Measurement-Verified In-Game Ads | +1.3% | North America And Europe, Early Asia-Pacific Adoption | Long Term (≥ 4 Years) |
| Source: Mordor Intelligence | |||
Surge in Reward-Based Playable Ads Adoption in Mobile Esports Tournaments
Mobile esports organizers now weave rewarded videos and offer walls into match intermissions, granting players coins or cosmetic items for 30-second brand interactions. Unity recorded 26.7% year-over-year growth in in-app ad revenue during 2024, with rewarded formats boosting day-7 retention above interstitial placements. Tournament organizers are layering playable ads into bracket intermissions, offering in-game currency or cosmetic unlocks in exchange for 30-second brand interactions. This model aligns advertiser objectives with player incentives, reducing the friction that triggers backlash in premium console titles. Roblox extended programmatic links to Amazon DSP, Liftoff, Magnite, Index Exchange, and PubMatic in January 2026, signaling large-scale confidence in opt-in creative units. Younger esports viewers accept incentives in exchange for attention, making tournaments a sandbox for formats that will seep into wider mobile catalogs.
Advancements in Real-Time Rendering Enabling Dynamic Cross-Platform Placements
Next-generation engines swap billboard textures or stadium signage on the server side so that ads match player location and time of day without client updates. Unity and Unreal now expose APIs that route bid responses straight into live scenes, collapsing operational silos between gaming and display channels. The Trade Desk’s OpenPath integration with Overwolf lets buyers cap frequency across screens and added 15% revenue to participating publishers in 2025. Cross-device consistency improves recall while controlling production costs, enhancing the total addressable spend for the in-game advertising market.
Brand Shift Toward Metaverse Product-Placement-Led Storytelling
Asia-Pacific marketers are embedding products into quests rather than interrupting gameplay. AirAsia World on Roblox, launched in August 2025 with support from the Malaysia Digital Economy Corporation, turns virtual travel puzzles into airline brand moments.[1]Malaysia Digital Economy Corporation, “MDEC Grants Fund AirAsia Roblox World Launch,” MDEC.MY Panda Express’ July 2025 crossover inside Roblox and Fortnite attracted 265,000 players and 185,000 engagements, proving food labels can translate menus into interactive missions. Dentsu reported that 79% of regional gamers welcome such crossovers and 81% start a title after seeing a related show or movie, validating narrative-led exposure.
5G Rollouts Accelerating Low-Latency Cloud-Gaming Monetization
Edge nodes and network slicing now push round-trip latency below 20 milliseconds, the threshold at which servers can tailor ads to in-game events without stutter. Ericsson’s 2025 tests showed dynamic bitrate allocation that aligns creative delivery to real-time network quality. Ribbon Communications linked these conditions to converging needs of both gameplay packets and ad assets, making telcos joint beneficiaries of ad-supported tiers.[2]Ribbon Communications, “Low-Latency Requirements for Cloud Gaming,” RIBBONCOMMUNICATIONS.COM Subsidized plans attract price-sensitive users in Southeast Asia and the Middle East, broadening the in-game advertising market base. The convergence of 5G and cloud gaming is particularly pronounced in Asia-Pacific and Middle East markets, where mobile-first populations bypass legacy console adoption.
Restraints Impact Analysis*
| Restraint | (~) % Impact on CAGR Forecast | Geographic Relevance | Impact Timeline |
|---|---|---|---|
| Ad-Format Standardization And Viewability-Validation Gaps | -1.2% | Global, Acute In Europe And North America | Medium Term (2–4 Years) |
| Expanding Privacy Regulations Curbing Device-ID Targeting | -1.6% | Europe And North America, Spreading To Asia-Pacific | Short Term (≤ 2 Years) |
| Player Backlash Against Intrusive Ads In Core Console Titles | -0.9% | North America And Europe Console Markets | Short Term (≤ 2 Years) |
| Legacy Game-Engine Integration Complexity For Indie Studios | -0.7% | Global, Concentrated In Indie-Heavy Hubs | Long Term (≥ 4 Years) |
| Source: Mordor Intelligence | |||
Ad-Format Standardization and Viewability-Validation Gaps
IAB Tech Lab’s OpenRTB 2.6 added in-game object fields, yet many exchanges still cannot confirm whether a message stayed in a player’s field of view for two consecutive seconds.[3]IAB Tech Lab, “OpenRTB 2.6 Specification With In-Game Inventory Support,” IABTECHLAB.COM Brand teams must therefore create multiple asset versions per engine, inflating production timelines. Until Media Rating Council accreditation becomes widespread, buyers will discount screen time, muting CPMs despite rising reach. Intrinsic In-Game's measurement framework, developed in 2024, attempts to address this gap by tracking camera angles and dwell time, but adoption remains fragmented across publishers. The lack of standardized creative specifications also forces brands to produce multiple asset variants for different engines and platforms, increasing production costs and slowing campaign launches.
Expanding Privacy Regulations Curbing Device-ID Targeting
GDPR fines reached EUR 4.89 billion (USD 5.38 billion) in 2024, while California’s agency began enforcing device-ID limits under the CPRA in 2025.[4]California Privacy Protection Agency, “CPRA Enforcement Actions,” CPPA.CA.GOV Thailand’s act took full force by June 2025, and India’s law phases in through 2026, shrinking addressable personalized reach. Publishers must pivot to consented first-party data, a hurdle for smaller studios with lean tech teams. IAB Europe's Transparency and Consent Framework version 2.2, released in November 2023, tightened consent-management requirements, reducing the pool of users who opt into personalized ads IAB Europe.
*Our forecasts treat driver/restraint impacts as directional, not additive. The impact forecasts reflect baseline growth, mix effects, and variable interactions.
Segment Analysis
By Ad Format: Rewarded Units Lead Engagement
Rewarded and playable units are projected to expand at 11.58% from 2026-2031, surpassing the broader in-game advertising market. Static placements still held 44.23% of the in-game advertising market share in 2025 due to low integration cost, yet their growth plateaus as users demand value in return for attention. Publishers using modern engines trigger server-side decisioning that updates creative without patches, a workflow impossible on legacy pipelines. The in-game advertising market, driven by sponsorships and native integrations, remains niche but yields premium CPMs owing to deeper storytelling.
Dynamic ads also mitigate backlash because opt-in rewards align with player incentives. Roblox’s expanded DSP links in 2026 showed that creators prefer turnkey monetization and measurement-verified impressions. Electronic Arts’ 2023 full-screen incident on EA Sports FC 24 illustrated the reputational hit from forced views, reinforcing the pivot toward consent-driven formats. Expect publishers that invest in real-time rendering and verification to capture outsize revenue as advertisers value attention rather than pure reach.


By Device Platform: Cloud Streaming Rises
Cloud and streaming titles are forecast to grow at 11.54% through 2031, benefiting from 5G, which clears latency ceilings for real-time ad calls. PC games accounted for 40.53% of the in-game advertising market in 2025 and maintained premium pricing due to long session durations and esports visibility. Mobile remains the largest absolute pool because rewarded videos are ingrained in freemium loops. Consoles face protest risk after Tekken 8 and Assassin’s Creed experiments drew community ire, prompting platform holders to tread carefully.
VR, AR, and metaverse worlds represent a sliver today but attract outsized attention from automotive and CPG brands looking for experiential showrooms. Microsoft, Nvidia, and Amazon will add ad-supported tiers to widen funnels beyond core subscribers. Ericsson’s studies confirm that edge nodes maintain both gameplay integrity and ad viewability, satisfying quality-of-experience standards essential for the in-game advertising market.
By Transaction Mode: Programmatic Accelerates
Programmatic deals are set to climb at 12.02% CAGR to 2031, eating into direct-sold contracts that still held 56.28% share in 2025. IAB Tech Lab’s schema now lets DSPs bid on 3D objects exactly as they do on banners, slashing manual IO overhead. The Trade Desk’s OpenPath with Overwolf raised publisher revenue by 15% and gave buyers unified frequency caps. Still, bespoke storytelling, such as Panda Express’ July 2025 metaverse quest, requires creative workshops that programmatic pipes cannot yet replicate.
Direct-sold transactions retain advantages for brand storytelling and custom integrations. Panda Express's Fortnite and Roblox campaign in July 2025 required creative collaboration with developers to design branded quests and virtual goods, a level of customization that programmatic exchanges cannot yet support. AirAsia's Roblox world, launched in August 2025 with Malaysia Digital Economy Corporation funding, exemplifies the narrative-led placements that command premium pricing but lack the scale of programmatic remnant Malaysia Digital Economy Corporation.
Geography Analysis
North America generated 33.12% of 2025 revenue, underpinned by mature console and PC ecosystems where AAA publishers test high-impact placements. California’s privacy enforcement is steering networks toward contextual methods, but measurement-verified supply still commands top CPMs. Player pushback remains a constraint; EA’s 2023 removal of intrusive placements proved reputational stakes. Growth slows relative to emerging regions, yet strategic advantages in data-rich environments keep the in-game advertising market anchored to high-value budgets.
Asia-Pacific is the creative vanguard, blending commerce with game loops. AirAsia, Jollibee, and Panda Express campaigns show that narrative placements convert curiosity into engagement. Thailand’s and India’s new privacy laws narrow behavioral targeting but encourage first-party identity solutions native to gaming ecosystems. Rapid 5G deployment and mobile-first populations deliver the largest incremental audience, making the in-game advertising market here the fastest-growing among developed economies.
Europe confronts the strictest oversight. GDPR penalties of EUR 4.89 billion (USD 5.38 billion) in 2024 and IAB Europe’s tighter consent strings reduce addressable personalized inventory. Yet Domino’s 2025 CTV GameBreaks campaign delivered a 31% brand-consideration lift, showing that verification can still unlock premium spend. Console gamers remain vocal against forced units, limiting aggressive rollouts. South America, the Middle East, and Africa trail in absolute dollars but race ahead in growth as telcos bundle data plans with ad-subsidized gaming. Africa’s 11.49% CAGR underlines how low-cost smartphones and rewarded videos democratize revenue opportunities across the in-game advertising market.

Competitive Landscape
The in-game advertising market is moderately fragmented, with mediation platforms, ad networks, and publishers competing across overlapping segments. AppLovin’s MAX mediation platform dominates with 73.1 percent share among top-downloaded mobile titles in 2025, powered by its AXON AI engine. Its USD 430 million acquisition of Wurl in June 2024 highlights ambitions to extend mediation into connected TV and cloud gaming, creating a unified stack across mobile, PC, and streaming. Unity’s merger with ironSource in November 2024 consolidated two major players, though Unity’s 2023 Runtime Fee controversy slowed SDK adoption and weakened developer trust.
Programmatic exchanges are broadening access to premium inventory. Google and Roblox’s April 2025 partnership introduced immersive ad formats and measurement tools, while PubMatic’s integrations with Adverty and Roblox enabled real-time bidding on intrinsic placements. Yet measurement verification and cross-platform attribution remain underdeveloped. Brands increasingly demand Media Rating Council-accredited metrics, and while Intrinsic In-Game’s 2024 framework and IAB Tech Lab’s OpenRTB 2.6 specification mark progress, adoption remains fragmented.
Disruptors like Anzu and Bidstack are gaining traction with intrinsic in-game ads that blend into gameplay, reducing player backlash. Technology is the key competitive lever, with server-side ad decisioning and real-time rendering enabling dynamic creative optimization and higher CPMs. Regulatory compliance is also emerging as a differentiator, as publishers investing in consent-management and first-party data strategies are better positioned in privacy-constrained markets. As standards mature, players that unify cross-platform monetization while maintaining trust with developers and advertisers will capture the most value.
In-game Advertising Industry Leaders
Google LLC
Meta Platforms Inc.
AppLovin Corp.
Unity Software Inc.
Electronic Arts Inc.
- *Disclaimer: Major Players sorted in no particular order

Recent Industry Developments
- January 2026: Roblox added Amazon DSP, Liftoff, Index Exchange, Magnite, and PubMatic to its programmatic roster, unlocking real-time bidding for 70 million daily users.
- August 2025: AirAsia debuted AirAsia World on Roblox, using virtual quests to market ASEAN travel.
- July 2025: Panda Express ran a Fortnite and Roblox crossover that drew 265,000 players and 185,000 engagements.
- June 2025: Thailand’s PDPA reached full enforcement, curbing device-ID targeting.


Research Methodology Framework and Report Scope
Market Definitions and Key Coverage
Our study defines the in-game advertising (IGA) market as all gross revenue earned when brands, agencies, or exchanges serve static display, dynamic server-side placements, video and audio spots, or full advergaming integrations into mobile, PC, console, cloud, and XR game environments while play remains uninterrupted. Value is captured at the first paid impression or sponsorship insertion, expressed in USD.
Scope exclusion: revenue from banner ads surrounding game-related web pages, esports jersey logos, and loot box sales sits outside this definition.
Segmentation Overview
- By Ad Format
- Static In-Game Display Ads
- Dynamic / Server-Side Inserted Ads
- Advergaming / Branded Mini-Games
- In-Game Video and Audio Spots
- Sponsorships and Native Brand Integrations
- By Device Platform
- Mobile Games
- PC Games
- Console Games
- Cloud / Streaming Games
- VR / AR / Metaverse Games
- By Transaction Mode
- Programmatic Marketplace
- Direct-Sold / IO Based
- By Geography
- North America
- United States
- Canada
- South America
- Brazil
- Argentina
- Mexico
- Rest of South America
- Europe
- Germany
- United Kingdom
- France
- Italy
- Spain
- Rest of Europe
- Asia-Pacific
- China
- Japan
- South Korea
- India
- Australia
- New Zealand
- Rest of Asia-Pacific
- Middle East
- United Arab Emirates
- Saudi Arabia
- Turkey
- Rest of Middle East
- Africa
- South Africa
- Nigeria
- Egypt
- Rest of Africa
- North America
Detailed Research Methodology and Data Validation
Primary Research
Structured interviews with ad-tech integrators, AAA and indie studios, programmatic desks, and regional ad agencies across North America, Europe, Asia-Pacific, and the Middle East validate fill rates, average revenue per daily active user, and likely adoption curves of new formats. Follow-up surveys with gamers assess tolerance thresholds for ad frequency, closing critical perception gaps revealed by desk work.
Desk Research
We open every engagement with a sweep of tier-one public sources such as Interactive Advertising Bureau viewability standards, Entertainment Software Association player census tables, U.S. Bureau of Labor Statistics media spend indices, and Ofcom handset penetration surveys, complemented by trade portals like GamesIndustry.biz and StatCounter mobile OS dashboards. These datasets anchor gamer base, playtime, and CPM benchmarks by region.
To deepen company-level signals, Mordor analysts tap Dow Jones Factiva for deal pipelines, D&B Hoovers for publisher revenue splits, and Questel for patent filings that hint at ad-tech rollouts. Select shipment intel from Volza and weekly store charts from Bestsellingcarsblog help us align hardware install bases with ad serving capacity. The sources listed here illustrate our approach and are not exhaustive.
Market-Sizing & Forecasting
A top-down model starts by reconstructing the reachable ad pool: gamer population × average monthly playtime × median impressions per hour × net eCPM. Supplier roll-ups of leading ad SDKs and sampled publisher yields provide a bottom-up sense check, allowing us to adjust for under-monetized indie catalogs. Key inputs include smartphone gamer growth, 5G subscription penetration, console install base refresh cycles, average session length, and programmatic take-rate progression. Five-year forecasts rely on multivariate regression blended with scenario analysis; independent variables are stress tested through expert consensus before finalization.
Data Validation & Update Cycle
Outputs pass multi-layer variance checks, peer review, and consistency scans versus external ad spend series. Material data points that drift past preset tolerances trigger analyst re-contact. Reports refresh annually, with interim revisions for regulatory shifts or platform launches, ensuring clients receive the freshest baseline.
Why Mordor's In-Game Advertising Baseline Commands Reliability
Published figures often diverge because firms vary the ad formats counted, the devices tracked, and the cadence of currency conversion.
Our disciplined scoping, annual refresh, and dual-lens modeling minimize those gaps.
Benchmark comparison
| Market Size | Anonymized source | Primary gap driver |
|---|---|---|
| USD 119.31 B (2025) | Mordor Intelligence | - |
| USD 60.6 B (2024) | Regional Consultancy A | Mobile-only scope; omits sponsorship and native integrations |
| USD 10.34 B (2025) | Global Consultancy B | Counts dynamic ads but excludes programmatic and console inventory; single-source bottom-up build |
The comparison shows that broad device coverage, calibrated eCPMs, and a blended model give Mordor Intelligence a balanced, transparent baseline that decision makers can trust.


Key Questions Answered in the Report
How large will the in-game advertising market be by 2031?
It is projected to reach USD 217.16 billion by 2031, advancing at a 10.63% CAGR from 2026.
Which ad format is expanding fastest inside games?
Rewarded and playable units are set to grow at 11.58% through 2031 as brands favor engagement over passive views.
Why is cloud gaming important for advertisers?
5G and edge computing remove latency, enabling real-time, context-aware ads and opening fresh inventory on services like Xbox Cloud Gaming and GeForce Now.
How are privacy laws affecting game advertising?
GDPR, CPRA, and new Asian regulations limit device-ID targeting, pushing publishers toward first-party data and contextual signals.
Who holds the largest mediation share on mobile titles?
AppLovin’s MAX platform controlled 73.1% share among the most-downloaded mobile games in 2025.
Which region is forecast to grow the fastest?
Africa leads with an 11.49% CAGR to 2031, driven by mobile-first populations and telco-subsidized gaming plans.
Page last updated on:


