Network Automation Market Size and Share
Market Overview
| Study Period | 2020 - 2031 |
|---|---|
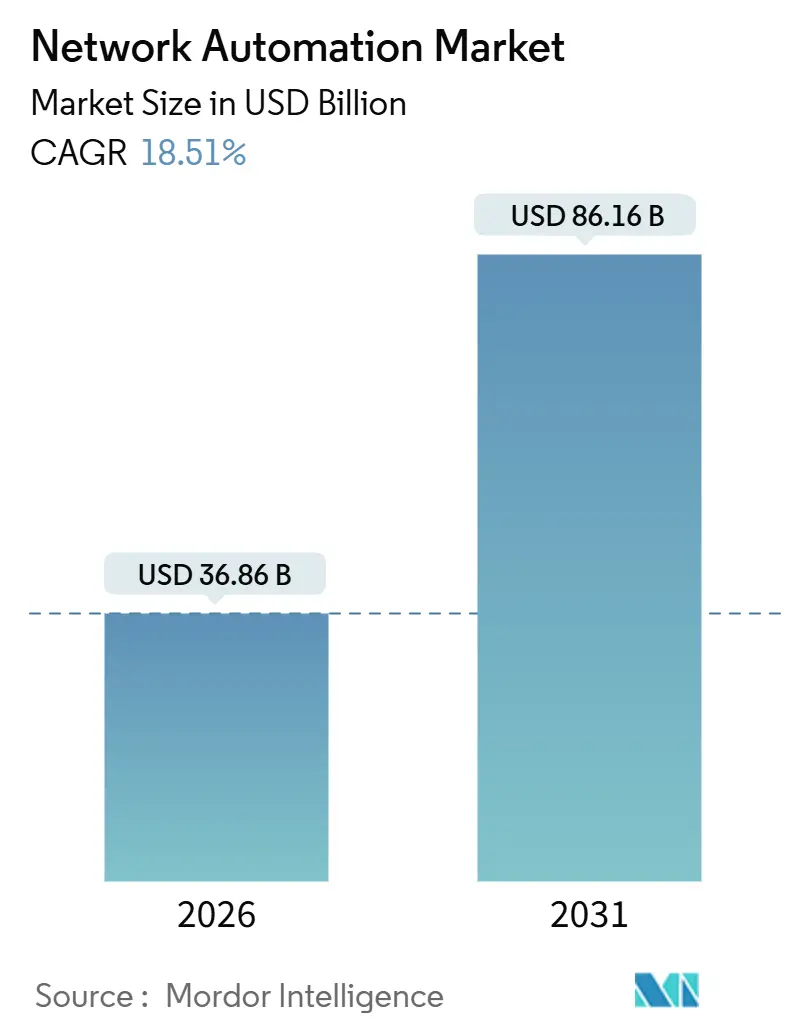
| Market Size (2026) | USD 36.86 Billion |
| Market Size (2031) | USD 86.16 Billion |
| Growth Rate (2026 - 2031) | 18.51% CAGR |
| Fastest Growing Market | Asia Pacific |
| Largest Market | North America |
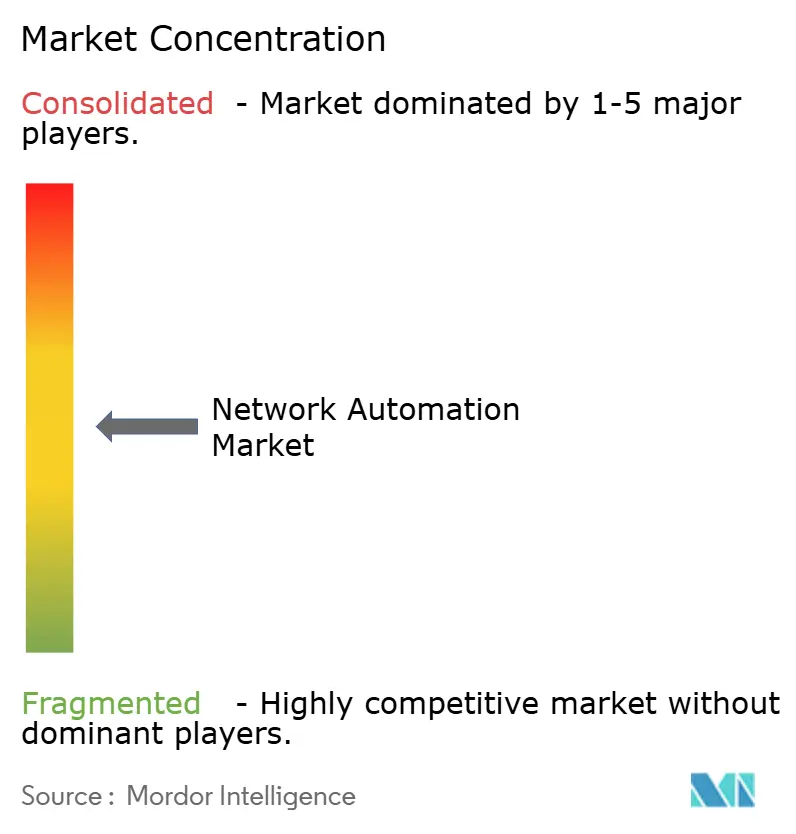
| Market Concentration | Medium |
Major Players *Disclaimer: Major Players sorted in no particular order Image © Mordor Intelligence. Reuse requires attribution under CC BY 4.0. | |
Network Automation Market Analysis by Mordor Intelligence
The global network automation market size stood at USD 36.86 billion in 2026 and is projected to reach USD 86.16 billion by 2031, reflecting an 18.51% CAGR over 2026-2031. Enterprises are accelerating adoption to cope with device proliferation, multi-cloud fabrics, and AI workloads that outpace manual provisioning. Hybrid infrastructure remains favored because it balances predictable performance with software-defined agility, while intent-based orchestration is cutting mean time to repair and freeing engineers for strategic work. Leading vendors are embedding AI to translate business intent into device configurations, and hyperscale cloud expansion is opening fresh opportunities for zero-touch operations, predictive maintenance, and 5G network slicing. The network automation market is also benefiting from regulatory mandates, such as the European Union’s NIS2 Directive and U.S. zero-trust frameworks, that require operators to automate compliance reporting and incident response.
Key Report Takeaways
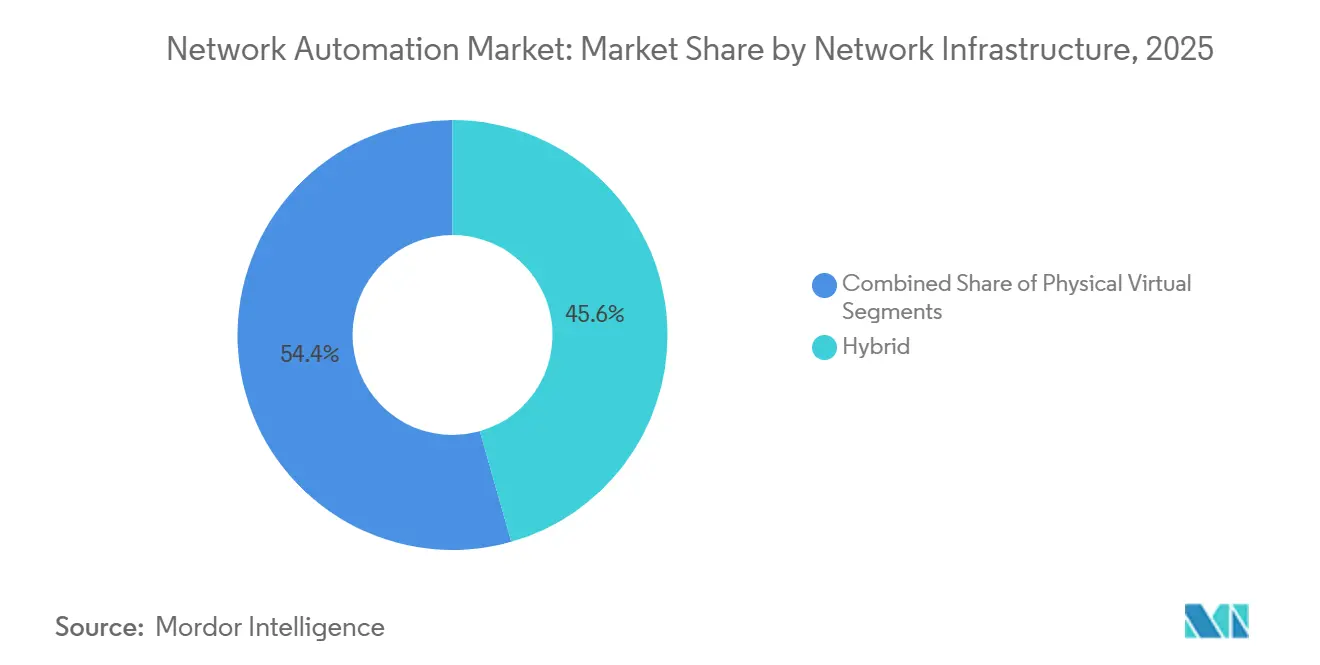
- By network infrastructure, hybrid deployments led with 45.60% of network automation market share in 2025, while virtual architectures are forecast to expand at an 18.80% CAGR through 2031.
- By component, solutions accounted for a 62.31% share of the network automation market size in 2025, whereas services are growing at a 19.40% CAGR to 2031.
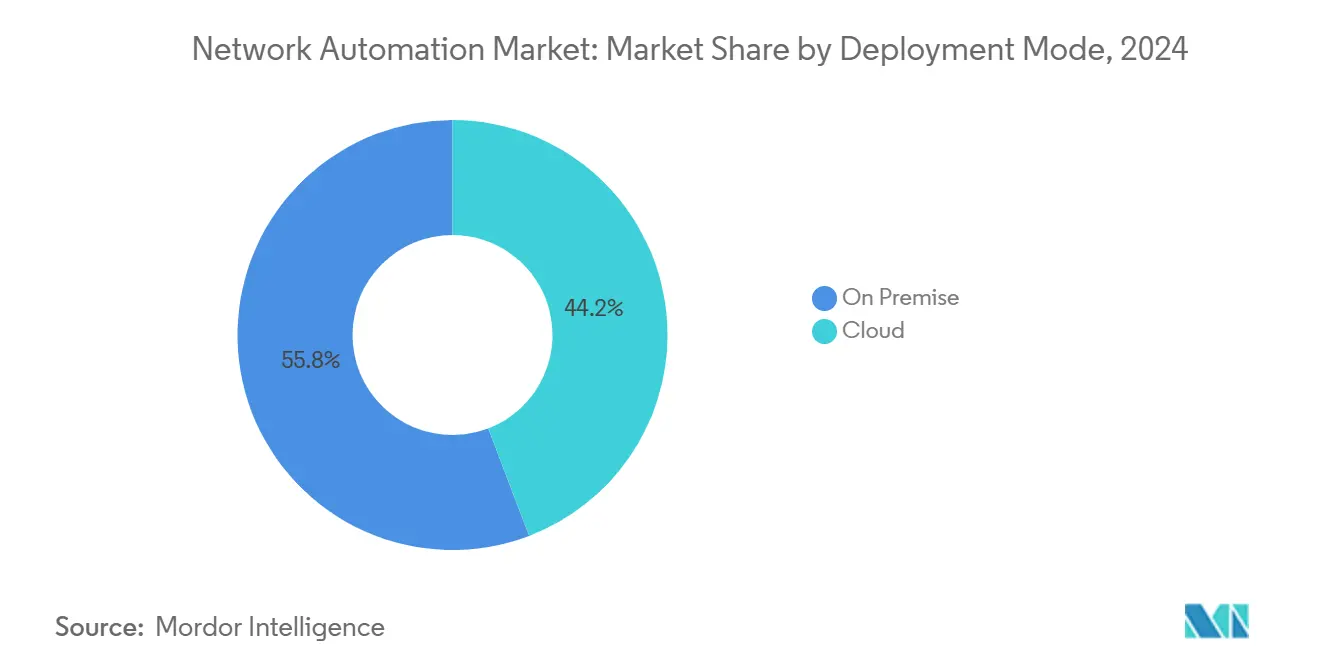
- By deployment mode, on-premise installations held a 55.80% share of the network automation market size in 2025, yet cloud delivery is projected to register a 20.50% CAGR through 2031.
- By organization size, large enterprises dominated with 67.14% of 2025 deployments, while small and medium enterprises are set to post a 22.40% CAGR.
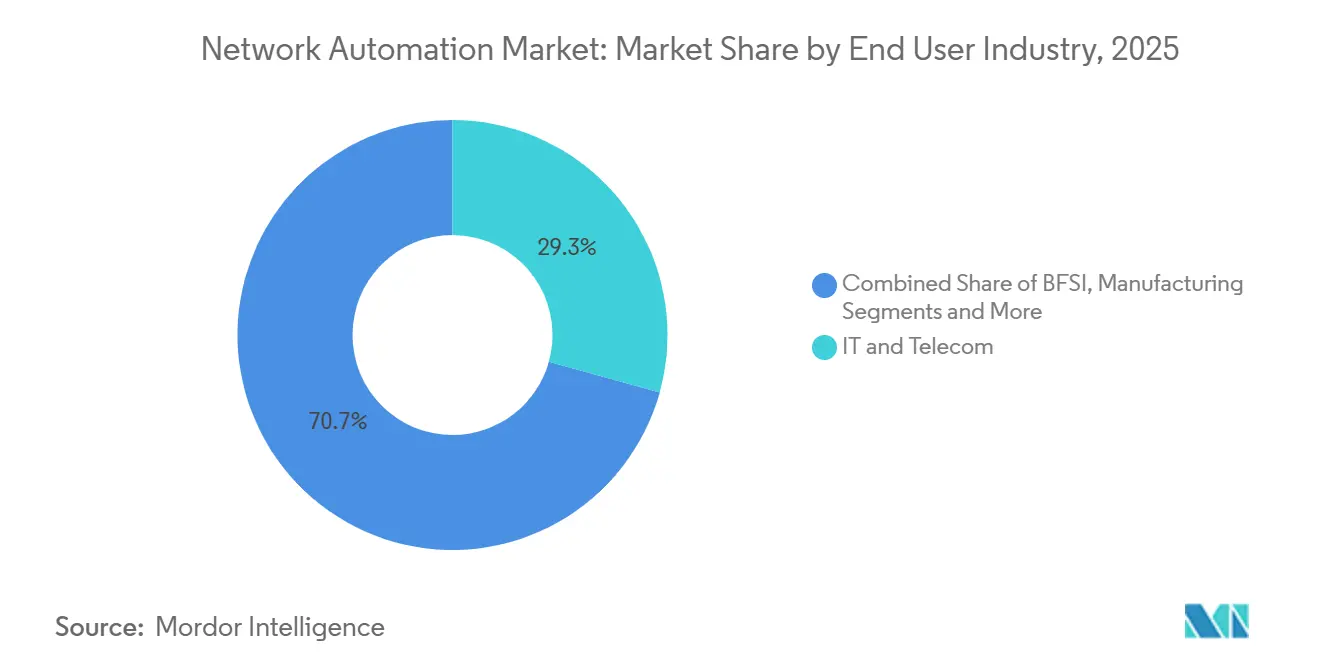
- By end-user industry, IT and telecom captured 29.30% of 2025 revenue; healthcare is on track for an 18.32% CAGR through 2031.
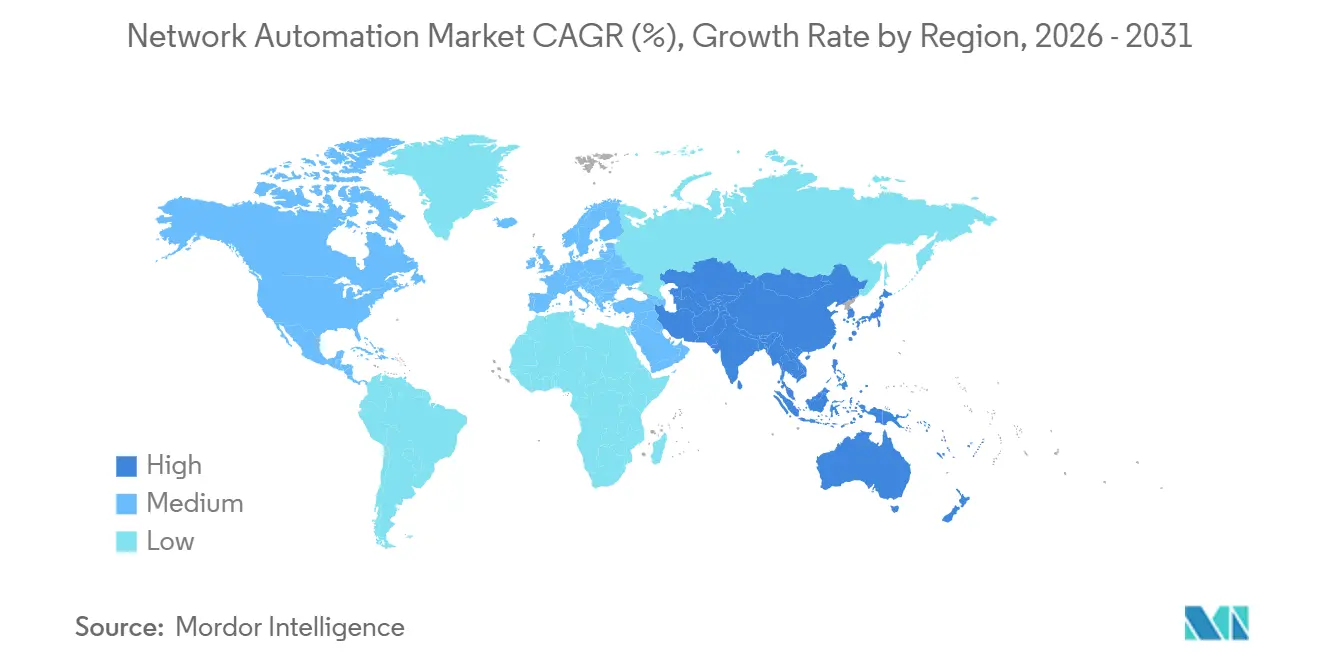
- By geography, North America commanded 38.43% network automation market share in 2025, whereas Asia-Pacific is expected to rise at a 21.43% CAGR to 2031.
Note: Market size and forecast figures in this report are generated using Mordor Intelligence’s proprietary estimation framework, updated with the latest available data and insights as of January 2026.
Global Network Automation Market Trends and Insights
Drivers Impact Analysis*
| Driver | (~) % Impact on CAGR Forecast | Geographic Relevance | Impact Timeline |
|---|---|---|---|
| Surge in Data-Center Network Upgrades | +3.8% | Global, concentrated in North America and Asia-Pacific hyperscale hubs | Medium term (2-4 years) |
| IoT and Connected-Device Proliferation | +3.5% | Global, accelerated in Asia-Pacific manufacturing and smart cities | Long term (≥ 4 years) |
| Rapid SD-WAN and Virtualization Roll-Outs | +3.2% | North America and Europe, spillover to Asia-Pacific | Short term (≤ 2 years) |
| Cloud and Multi-Cloud Migration Wave | +3.0% | Global, led by North America and Europe financial services | Medium term (2-4 years) |
| AI-Driven Self-Healing Intent-Based Networks | +2.6% | North America and Asia-Pacific telecom and IT early adopters | Long term (≥ 4 years) |
| Zero-Touch 5G Network-Slicing Monetization | +2.4% | Asia-Pacific and Middle East 5G greenfields, gradual uptake elsewhere | Long term (≥ 4 years) |
| Source: Mordor Intelligence | |||
Surge in Data-Center Network Upgrades
Hyperscale and colocation providers are rebuilding spine-leaf fabrics around 400 GbE and 800 GbE switching to support GPU clusters that train generative AI models. Manual configuration of tens of thousands of ports risks cascading outages, so organizations are turning to automated intent engines that generate validated configurations and push them at scale. Co-packaged optics and in-network compute highlighted in 2025 roadmaps demand programmable pipelines that legacy CLI workflows cannot orchestrate effectively [1]Intel Corporation, “Data Center Strategy Roadmap 2025,” intel.com. Liquid-cooling retrofits further complicate cabling, prompting vendors to bundle physical-layer discovery with infrastructure-as-code templates for real-time topology accuracy.
IoT and Connected-Device Proliferation
The installed base of connected endpoints topped 75 billion in 2025, stretching network capacity and exposing security gaps. Manufacturers cite network complexity as the top barrier to IT-OT convergence because aging SCADA gear lacks encryption and authentication primitives. Automation platforms that integrate device-lifecycle management now onboard sensors, assign segmentation tags, and apply firewall policies without manual tickets, trimming rollout cycles from weeks to hours [2]Verizon Communications, “IoT Deployment Statistics 2025,” verizon.com.
Rapid SD-WAN and Virtualization Roll-Outs
By late-2025, software-defined wide-area networking displaced MPLS in 62% of branch offices, driving demand for centralized orchestration that spans overlays and underlays. Newly published YANG models improve multi-vendor interoperability, but managing tunnels, service chains, and policy enforcement still overwhelms human operators. Automation translates business intent into device-specific commands, validates reachability in digital twins, and rolls back if drift is detected.
Cloud and Multi-Cloud Migration Wave
Organizations average 3.2 public-cloud providers, increasing touchpoints and policy inconsistency. Unified intent models abstract cloud-specific APIs, letting teams define connectivity once and apply it across AWS, Azure, and Google Cloud. Kubernetes adoption amplifies the need for automated container networking and service-mesh integration. Financial institutions rely on automated validation to prove encrypted paths and region-restricted flows, meeting stringent audit requirements.
Restraints Impact Analysis*
| Restraint | (~) % Impact on CAGR Forecast | Geographic Relevance | Impact Timeline |
|---|---|---|---|
| Shortage of Automation-Skilled Engineers | -2.1% | Global, most acute in North America and Europe | Medium term (2-4 years) |
| Legacy Infrastructure Integration Issues | -1.8% | North America and Europe brownfields, moderate effect in Asia-Pacific greenfields | Short term (≤ 2 years) |
| Proprietary Platform Vendor-Lock-In Risk | -1.3% | Global, pronounced where multi-decade vendor relationships persist | Long term (≥ 4 years) |
| Cross-Border Change-Control Compliance | -1.0% | Europe and multinational operators subject to evolving data-sovereignty and incident mandates | Medium term (2-4 years) |
| Source: Mordor Intelligence | |||
Shortage of Automation-Skilled Engineers
A 4.8-million-person cybersecurity talent gap includes acute shortages in Python, Ansible, and YANG expertise, forcing enterprises to pay premium consulting fees and delaying full-scale deployments. Certification programs and internal academies are ramping up, but productivity gains often trail investment by 12-18 months, eroding early ROI.
Legacy Infrastructure Integration Issues
Brownfield environments combine decades-old CLI-only hardware with API-enabled gear, complicating unified automation. Nearly 58% of enterprises run devices from five or more vendors, each with proprietary syntax and telemetry formats. Forklift upgrades disrupt production and phased migrations prolong dual-stack complexity. Middleware translators help, but they also introduce latency and new failure domains, keeping integration among the costliest elements of transformation.
*Our forecasts treat driver/restraint impacts as directional, not additive. The impact forecasts reflect baseline growth, mix effects, and variable interactions.
Segment Analysis
By Network Infrastructure: Hybrid Deployments Anchor Transition Strategies
Hybrid architectures captured 45.60% of the network automation market share in 2025, underscoring enterprise reliance on physical underlays for deterministic latency while software overlays unlock agility for emerging workloads. The virtual tier is on an 18.80% CAGR through 2031, propelled by container network interfaces that automate micro-segmentation. Hybrid topologies allow gradual migration, enabling organizations to pilot SD-WAN at the edge before extending automation inward. Cisco reported that 63% of its SD-WAN customers ran mixed MPLS and broadband paths, highlighting the staying power of multi-transport strategies.
Operators use hybrid models to hedge against vendor lock-in because virtual functions can be swapped without replacing switching hardware. The TM Forum’s 2025 Open Digital Architecture codified intent APIs, helping carriers integrate best-of-breed components [3]TM Forum, “Open Digital Architecture Update 2025,” tmforum.org. Physical vendors are embedding gRPC exporters and YANG interfaces, turning legacy chassis into programmable nodes that slot into infrastructure-as-code pipelines. Consequently, the hybrid paradigm is likely to remain the backbone of the network automation market well into the forecast horizon.


By Component: Services Surge as Integration Complexity Escalates
Solutions held 62.31% of revenue in 2025, but services are forecast to rise at a 19.40% CAGR as enterprises outsource design, integration, and managed operations. Demand spans architecture consulting, proofs-of-concept, and custom connector development for legacy OSS/BSS systems. Training revenues surged 22% year over year at Red Hat, underscoring the urgent need to reskill operations teams.
AI recommendation engines now ship inside automation suites, yet they require tuning to each customer’s topology, creating high-margin opportunities for integrators. Managed-service providers guarantee uptime and compliance, shifting operational risk off customers’ balance sheets. This dynamic indicates that professional and managed services will continue commanding a premium portion of the network automation market size, even as software matures.
By Deployment Mode: Cloud Gains as SaaS Economics Reshape Procurement
On-premise deployments represented 55.80% of the 2025 base, driven by defense and critical-infrastructure operators that keep telemetry in controlled facilities. Cloud delivery, however, is accelerating at a 20.50% CAGR because it eliminates server provisioning and converts CapEx into OpEx. SolarWinds’ cloud observability service streams telemetry without on-site collectors, simplifying firewalls and reducing attack surfaces.
Hybrid control-plane architectures split policy management to the cloud while retaining local data-plane enforcement for latency-sensitive tasks. VMware NSX, now under Broadcom, exemplifies this model by federating overlays across private and public clouds. Regulatory drivers such as the NIS2 Directive add momentum, as cloud automation accelerates backup, disaster recovery, and compliance dashboards in real time.
By Organization Size: SMEs Embrace Cloud-Native Platforms to Leapfrog Legacy Constraints
Large enterprises accounted for 67.14% of 2025 deployments, leveraging volume discounts and deep benches of network engineers. Yet small and medium enterprises are projected to log a 22.40% CAGR, empowered by turnkey SaaS platforms that strip away on-premise complexity. Cisco Meraki and Arista CloudVision provide template-driven automation via vendor-hosted control planes, making advanced capabilities consumable without specialized staff.
Subscription pricing aligns with SME cash-flow patterns, but contract lock-ins can emerge if later growth requires features beyond entry-level tiers. Conversely, large organizations face integration drag because sprawling global networks span multiple vendor stacks that resist standardization. As cloud-native solutions mature, SMEs’ share of network automation market size will climb steadily through 2031.
By End-User Industry: Healthcare Accelerates as Regulatory Mandates Converge with Telemedicine Growth
IT and telecom generated 29.30% of 2025 revenue, but healthcare is on track for an 18.32% CAGR, fueled by FDA guidance mandating automated patch deployment and by remote patient-monitoring networks that demand zero-touch provisioning. Banking and financial services continue heavy spending on zero-trust architectures to protect payment rails, while manufacturing uses deterministic networking for predictive-maintenance digital twins.
Energy utilities are modernizing SCADA networks to integrate distributed renewables under NERC CIP standards. Government agencies implement intent-based segmentation to satisfy zero-trust mandates, and educational institutions automate campus networks to secure hybrid learning models. These cross-sector mandates guarantee robust demand across the network automation industry through the forecast period.
Geography Analysis
North America held 38.43% of the network automation market in 2025. Federal zero-trust directives, dense hyperscale data-center footprints, and active financial hubs drive continued spending. Regulators encourage rural fiber builds, increasing demand for automated provisioning that minimizes truck rolls.
Asia-Pacific is projected to register a 21.43% CAGR from 2026-2031. Nationwide 5G rollouts in China, India, Japan, and South Korea require zero-touch slicing and radio parameter optimization. China Mobile’s 5G-Advanced trials showcased AI-driven energy savings, while Indian carriers rely on automation to integrate legacy 4G with standalone 5G cores. Open RAN pilots in Japan increase multi-vendor complexity, heightening the need for orchestration.
Europe’s growth is steadier but supported by the NIS2 Directive’s 24-hour incident-reporting mandate. Germany’s Industry 4.0 programs demand microsecond-level synchronization, prompting investments in time-sensitive networking. The Middle East invests under Vision 2030 and national AI strategies, while Latin America and Africa expand 4G and 5G to underserved areas, using automation to compensate for limited onsite talent. Brazil’s spectrum auctions and South Africa’s fiber rollouts attest to rising regional interest.

Regulatory Landscape
Regulatory requirements for network automation are increasingly framed around auditable, software-driven operations and cybersecurity readiness. In the United States, the March 2026 FCC Report and Order FCC 26-19 aims to reduce barriers to network modernization during the transition from legacy TDM to all-IP networks, reinforcing change-control, cutover orchestration, and scalable service assurance. Critical Infrastructure Protection requirements were also strengthened with CIP-003-11 approved in March 2026, raising expectations for repeatable controls, incident readiness, and evidence-driven reporting.
Value Chain Analysis
The network automation value chain starts with foundational network and cloud infrastructure and extends to automation software that translates intent into configuration, validates changes, and closes the loop with monitoring and remediation. Core platform suppliers such as Cisco, Juniper, IBM, and HPE increasingly rely on ecosystem dependencies including AI models and AIOps capabilities, IT service management workflows, and digital twin or simulation layers to reduce change risk in hybrid environments. Downstream, systems integrators, managed service providers, and channel partners operationalize automation through design, connector development, and day-2 operations, anchored in ITSM and ticketing platforms.
Partnerships illustrate how value is distributed across the stack. Juniper and ServiceNow combined Mist AI with ServiceNow Telecom Service Management (May 2025) to streamline full-stack automation for managed services, while Juniper and IBM aligned Mist AI with IBM watsonx (February 2025) to automate IT network support. Hardware and AI-infrastructure buildouts also pull automation upstream, as seen in Cisco and NVIDIA extending a unified architecture for AI-ready data center networking (February 2025), increasing the need for coordinated provisioning across network and compute stacks.
Competitive Landscape
The top five vendors commanded roughly 55% of 2025 revenue, placing the market in a moderately concentrated state. Cisco, Juniper, and IBM leverage broad portfolios and entrenched channels but face pressure from consumption-based pricing models. Broadcom’s 2024 acquisition of VMware tightened integration between network virtualization and compute orchestration, though customers fear higher prices.
Juniper’s Mist AI applies machine learning to predict and remediate client-side issues, reducing help-desk tickets dramatically. Startups such as Forward Networks and NetBrain specialize in digital-twin modeling that allows change-impact simulation before deployment, resonating with compliance-bound sectors. Open-source SONiC, adopted by hyperscalers, demonstrates that software disaggregation can undercut proprietary economics, compelling incumbents to bundle superior support and services.
Patent filings underscore the innovation race: more than 1,200 U.S. patents issued in 2025 cover intent translation, telemetry compression, and zero-touch protocols. As AI capabilities saturate configuration management, differentiation is shifting toward advanced analytics, security convergence, and industrial-protocol support.
Network Automation Industry Leaders
Cisco Systems Inc.
Juniper Networks Inc.
IBM Corporation
Hewlett Packard Enterprise Company
Huawei Technologies Co. Ltd.
- *Disclaimer: Major Players sorted in no particular order

Market Opportunities and Future Outlook
Opportunity is consolidating around automation that can run AI-heavy data center networks and GPU clusters with fewer specialized engineers, particularly where scale and change frequency strain traditional network change and configuration management workflows. Evidence of capital moving into this need includes Netris raising a USD 15 million Series A in June 2026 to advance network automation and multi-tenancy for GPU-heavy AI clusters, and DriveNets raising USD 410 million in June 2026 to scale network cloud infrastructure aligned to AI-driven traffic growth. These transactions support sustained demand for intent-based provisioning, topology-aware validation, and automated capacity management spanning data center fabrics and multi-cloud connectivity.
Recent Industry Developments
- July 2026: Cisco Systems Inc. partnered with World Wide Technology on a USD 230 million U.S. Army GEMSS 2.1 contract to modernize IT infrastructure management, enabling automated configuration, monitoring, and policy enforcement across distributed networks. This deal reinforces vendor momentum for platform-driven operations in highly regulated public-sector deployments.
- May 2025: Juniper Networks and ServiceNow combined Mist AI with ServiceNow Telecom Service Management to streamline full-stack automation for managed services. The collaboration shows a continued push to embed AI-driven automation into ITSM workflows across enterprise and service-provider environments.
- September 2024: HPE expanded HPE Aruba Networking Central with added AI-powered automation capabilities, including monitoring for third-party devices and end-user experience enhancements. By broadening multi-vendor visibility and control, HPE supports automation adoption in brownfield networks where heterogeneous equipment is common.


Research Methodology Framework and Report Scope
Market Definition and Coverage
This market covers software and related services used to automatically configure, operate, monitor, and optimize enterprise and service-provider networks across physical, virtual, and hybrid environments. The value is tied to automation workflows and policy-driven actions, rather than manual operations or one-off script tooling.
Scope exclusions: We exclude pure networking hardware revenue and tools that only provide visibility or orchestration without embedded automation logic.
Segmentation Overview
- By Network Infrastructure
- Physical
- Virtual
- Hybrid
- By Component
- Solutions
- Services
- By Deployment Mode
- Cloud
- On-Premise
- By Organization Size
- Large Enterprises
- Small and Medium Enterprises
- By End-User Industry
- IT and Telecom
- Banking and Financial Services
- Manufacturing
- Energy and Utilities
- Education
- Healthcare
- Government and Defense
- Other Industries
- By Geography
- North America
- United States
- Canada
- Mexico
- Europe
- Germany
- United Kingdom
- France
- Italy
- Spain
- Russia
- Rest of Europe
- Asia-Pacific
- China
- Japan
- India
- South Korea
- Australia
- Rest of Asia-Pacific
- Middle East
- Saudi Arabia
- United Arab Emirates
- Turkey
- Rest of Middle East
- Africa
- South Africa
- Nigeria
- Rest of Africa
- South America
- Brazil
- Argentina
- Rest of South America
- North America
Data Sources, Market Sizing, and Validation
Desk Research
Desk research was used to anchor the market to real network build and usage signals, and then translate those into realistic automation adoption patterns. We referenced public sources such as FCC broadband and network infrastructure publications, NIST cybersecurity guidance, OECD ICT indicators, ITU telecom statistics, and relevant IEEE and ACM papers on network operations automation.
To keep assumptions practical, we also reviewed company filings and earnings call notes, investor presentations, and standards or working group materials. We checked reputable press coverage of large network modernization programs, and where needed we supplemented this with paid subscriptions for company financials and intelligence, patent lookups, and shipment-level import and export checks to validate the supply-side direction. The desk sources listed here are illustrative, and other public and paid sources were used to collect data, validate it, and clear up open questions.
Primary Interviews and Surveys
Primary work focused on confirming what is actually being bought and deployed, and how budgets are split between software, subscriptions, and managed support tied to automation outcomes. We spoke with a mix of automation solution providers, network integrators, telecom and cloud operators, and enterprise network teams across APAC, EMEA, and the Americas. Their input was used to tighten adoption assumptions, pricing expectations, and refresh cycle assumptions.
Distribution of primary research fieldwork respondents
| Company type | Respondent position | Region |
|---|---|---|
| Top tier: 31% | CXOs: 15% | APAC: 41% |
| Mid tier: 53% | Functional/Unit leaders: 38% | EMEA: 32% |
| Smaller Players: 16% | Managers: 47% | Americas: 27% |
Market-Sizing & Forecasting
The market was sized using a top-down approach where network spend and operations intensity are reconstructed by region, then filtered through the share of environments where automation is actively used for configuration, change management, policy rollout, and closed-loop remediation. Once the demand pool is built, we apply realistic attach rates to software subscription and license revenue, plus service revenue linked to implementation and managed support.
To keep totals grounded, the outputs are corroborated with selective bottom-up approximations. These include supplier revenue pattern checks, sampled pricing versus deployment scale (for example, nodes, sites, or devices managed), and channel feedback on typical contract scope. Key inputs used in the model include enterprise and service-provider network modernization intensity, growth in virtual and hybrid network footprints, frequency of configuration changes and compliance reporting needs, adoption of intent-based workflows and zero-touch provisioning, and security-driven automation requirements such as zero-trust rollouts. Forecasting uses scenario analysis supported by expert consensus on how fast automation penetrates existing networks, then multivariate regression to test sensitivity to network traffic growth, cloud migration pace, and telecom capex cycles. Where a data point is thin for a country or vertical, we bridge the gap using regional benchmarks and re-check it through interview feedback before finalizing.
Data Validation & Update Cycle
Model outputs are checked against independent signals, including the pace of large network transformation programs, product and services revenue direction in filings, and observed shifts in adoption across regions and customer types. If a number looks unusual, we trace it back to driver assumptions and then revise or re-confirm the inputs through follow-up outreach before sign-off.
A second analyst reviews the sizing sheet, the assumption notes, and the conversion logic to catch calculation errors and scope creep early. The report is refreshed annually, and interim updates are made when material events change demand or pricing expectations. Before delivery, a final pass is completed so clients receive the latest updated view based on the most recent data available.
Mordor Intelligence's Network Automation Market Estimate Compared With Other Published Estimates
Published market values for network automation can differ a lot because studies do not apply the same boundaries for what gets counted, and the timing of the base year also affects the number. In this market, the biggest swings usually come from whether managed support is included, how far the definition stretches into adjacent domains like general orchestration, and how cloud subscription revenue is annualized.
Revenue direction in automation-linked software subscriptions and managed support, along with checks against network modernization activity across enterprises and service providers, are used to keep Mordor Intelligence's estimate aligned to spend directly tied to automation workflows rather than broad infrastructure budgets. When other estimates use narrower product definitions, older base years, or simplified pricing progressions, the result can look much smaller even if the adoption story sounds similar.
Benchmark comparison
| Source | Market Size | Gaps in Research Methodology |
|---|---|---|
| Mordor Intelligence | USD 36.86 B (2026) | |
| Global Publisher A | USD 10.97 B (2025) | Uses an earlier base year and a smaller revenue scope that can undercount enterprise-wide automation subscriptions and service revenue tied to implementation and ongoing managed support. |
| Industry Publisher B | USD 9.63 B (2026) | Applies a lower growth profile and often treats automation as a narrower tooling layer, which can exclude broader policy automation and closed-loop remediation use cases that drive higher contract values. |
The table shows that the spread is mainly explained by scope boundaries and how subscription and service revenue are treated across the value chain. By tying the model to observable demand signals and then stress-testing pricing and adoption assumptions through interviews, we end up with a market value that is traceable to clear inputs and can be repeated when new data comes in.


Key Questions Answered in the Report
How large is the network automation market in 2026 and what is its growth trajectory?
The network automation market size reached USD 36.86 billion in 2026 and is on course for USD 86.16 billion by 2031 at an 18.51% CAGR.
Which infrastructure segment holds the lead?
Hybrid deployments led with 45.60% network automation market share in 2025 because they blend physical performance with software agility.
What region is forecast to grow the fastest?
Asia-Pacific is projected to log a 21.43% CAGR through 2031, driven by large-scale 5G rollouts that require zero-touch slicing and AI optimization.
Why are services growing faster than solutions?
Integration complexity, skills shortages, and the need for managed operations push enterprises to outsource, lifting services revenue at a 19.40% CAGR.
Page last updated on:


