Live Streaming Market Size and Share
Market Overview
| Study Period | 2020 - 2031 |
|---|---|
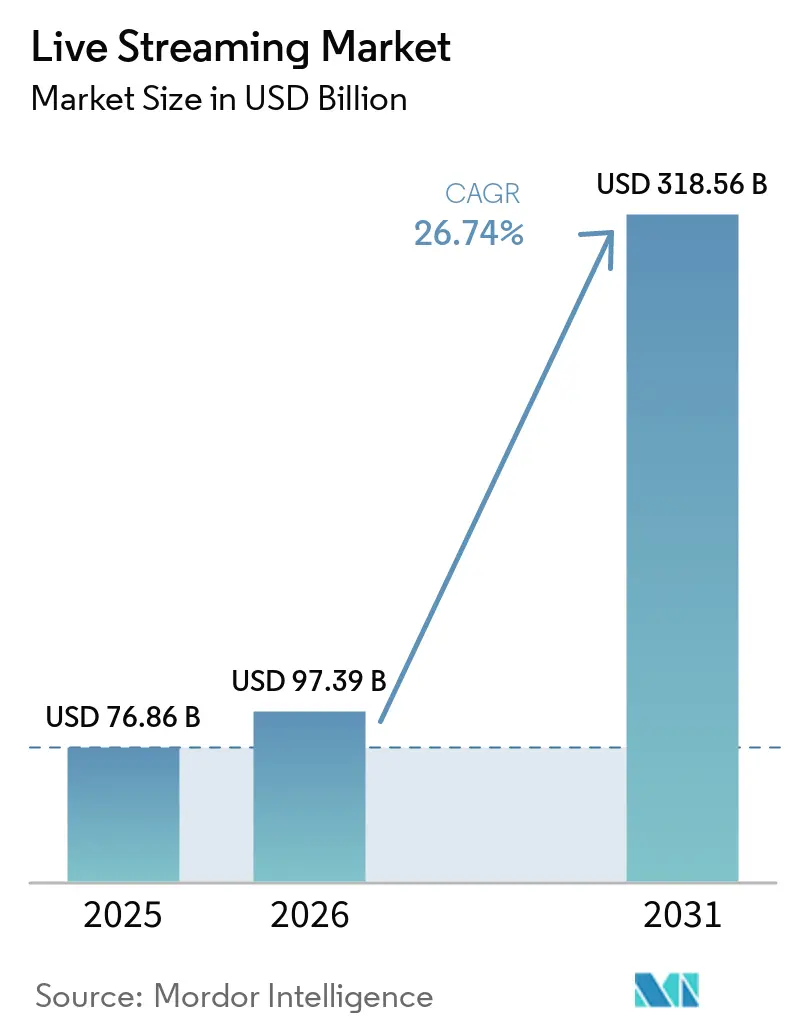
| Market Size (2026) | USD 97.39 Billion |
| Market Size (2031) | USD 318.56 Billion |
| Growth Rate (2026 - 2031) | 26.74% CAGR |
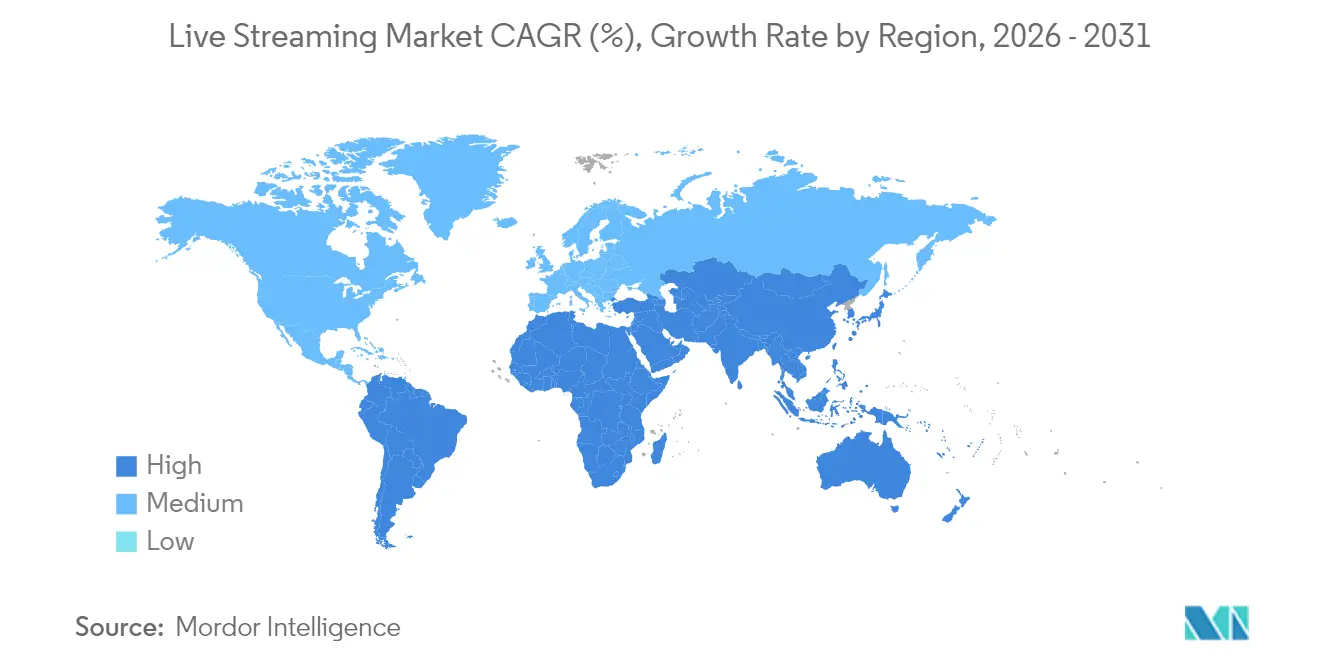
| Fastest Growing Market | Middle East and Africa |
| Largest Market | Asia Pacific |
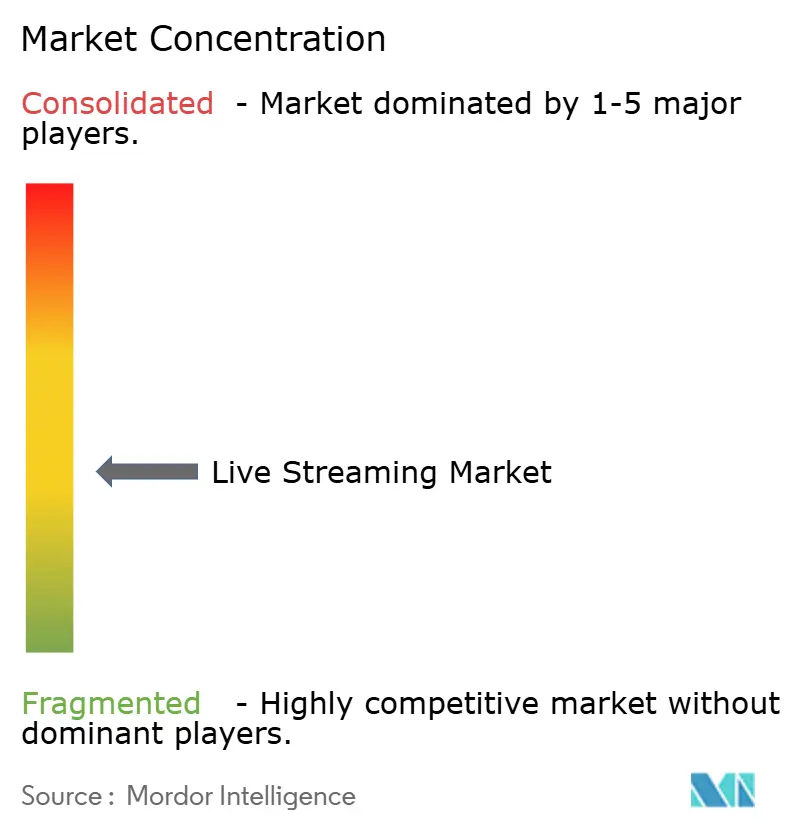
| Market Concentration | Medium |
Major Players *Disclaimer: Major Players sorted in no particular order Image © Mordor Intelligence. Reuse requires attribution under CC BY 4.0. | |
Live Streaming Market Analysis by Mordor Intelligence
The Live Streaming Market size is projected to expand from USD 76.86 billion in 2025 and USD 97.39 billion in 2026 to USD 318.56 billion by 2031, registering a CAGR of 26.74% between 2026 to 2031.
Continuous migration from linear television, the rise of creator-led entertainment, and near-ubiquitous mobile connectivity have pushed streaming into the mainstream of daily media use. Platforms now treat streaming as the organising layer for commerce, community, and data, so every extra minute watched often multiplies gross merchandise value. Ancillary layers such as moderation, compliance, and predictive analytics grow in lock-step, creating a stacked industry structure in which each tier reinforces the next. Looking ahead, network modernisation, direct-to-consumer monetisation, and AI-enabled optimisation together define the market’s strategic trajectory, with early movers in multilanguage metadata already recording faster watch-hour growth than rivals focused solely on bandwidth.
Key Report Takeaways
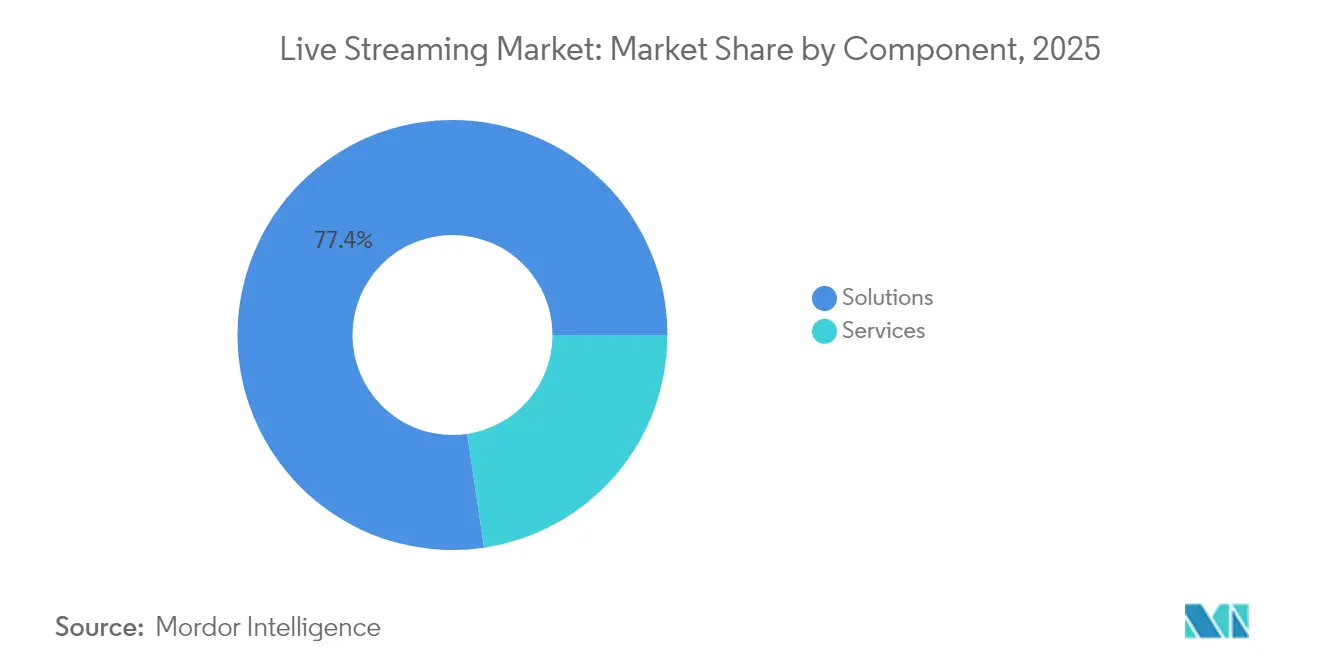
- By component, solutions held 77.35% of the live streaming market share in 2025, while managed and professional services are forecast to climb at a 29.68% CAGR through 2031.
- By type, video captured 91.40% of the market in 2025; live audio streams are expected to expand at more than 28.62% CAGR to 2031.
- By revenue model, advertising-backed channels commanded a 63.10% share in 2025, whereas the subscription segment is on a 30.55% CAGR trajectory to 2031.
- By platform, mobile accounted for 55.20% of the live streaming market size in 2025, with smart-TV usage forecast to rise at a 32.65% CAGR.
- By end-user vertical, media and entertainment led with 36.40% revenue share in 2025, while gaming and e-sports are projected to grow at 29.10% CAGR.
- By geography, Asia-Pacific retained 44.30% of the market share in 2025; the Middle East and Africa region is the fastest-growing at 31.35% CAGR.
Note: Market size and forecast figures in this report are generated using Mordor Intelligence’s proprietary estimation framework, updated with the latest available data and insights as of 2026.
Global Live Streaming Market Trends and Insights
Drivers Impact Analysis*
| Driver | (~) % Impact on CAGR Forecast | Geographic Relevance | Impact Timeline | |
|---|---|---|---|---|
| Proliferation of 5G-Enabled Mobile Streaming in Asia–Pacific | +4.2% | Asia-Pacific, with spillover to North America | Medium term (3-4 yrs) | |
| Esports Tournament Rights Driving Monetisation for Gaming Streams in North America | +2.8% | North America, Europe | Short term (≤2 yrs) | |
| Shift of Live Commerce from China to Western Europe Fashion Retailers | +2.5% | Western Europe, with spillover to North America | Medium term (3-4 yrs) | |
| Integration of Live-Streaming APIs into SaaS MarTech Stacks Among US SMEs | +3.7% | North America, with global spillover | Medium term (3-4 yrs) | |
| Premium Sport Leagues' Direct-to-Consumer (D2C) Models in Middle East | +2.3% | Middle East, with spillover to Africa | Short term (≤2 yrs) | |
| Cloud-based Transcoding Cost Decline Fueling Start-up Entrants in Africa | +1.2% | Africa, with spillover to Middle East | Long term (≥5 yrs) | |
| Source: Mordor Intelligence | ||||
5G-Enabled Mobile Streaming
Mobile operators in metropolitan Seoul sustained median downlink speeds above 160 Mbps throughout 2024 and 2025, supported by dense 3.5 GHz deployments [1]Opensignal Team, “Benchmarking the Mobile Experience in APAC Cities, November 2024,” opensignal.com. These conditions allow 4K handheld live broadcasts from concerts and citywide e-sports fan gatherings without auxiliary Wi-Fi. Evening peak traffic has measurably shifted from fixed to mobile networks whenever game publishers unveil major updates, proving that live video diverts demand toward cellular capacity. When carriers wrap zero-rating for select live apps into premium plans, subscriber churn falls compared with standard data bundles, highlighting video’s retention power. As multi-gigabit 5G coverage spreads, sub-second latency unlocks interactive trivia shows, live voting, and real-time multi-angle sports viewing. Together, these interactions reinforce the live streaming market’s value proposition by merging content and community on the same handheld screen.
Esports Co-Streaming Rights
North American licensors of 2024 championship circuits issued co-streaming kits with real-time statistical overlays, allowing creators to layer personal narratives onto official video feeds. The approach widened reach into demographics overlooked by traditional commentary and lifted average concurrent viewership. Sponsors now buy packages that bundle primary feeds with verified creator mirrors, letting them measure activated audience rather than impressions confined to a single channel. Personality-led distribution often outperforms official streams on engagement per viewer, even when overall reach is similar. Rights holders are converting wholesale licences into creator ecosystems, therefore converting engagement into diversified revenue streams more quickly. The model also accelerates data capture, as every co-stream adds a data node that feeds back into recommendation engines, magnifying network effects across the broader ecosystem.
Live Commerce Adoption
A leading Spanish fast-fashion retailer ran a six-week live shopping series for German audiences in spring 2025. Viewers pinned products on screen and completed checkout via QR-code hand-off to a local ecommerce site; subsequent filings showed lower return rates than for catalogue-driven equivalents. The case illustrates that live demonstrations close the information gap on fit and styling, reducing post-purchase dissatisfaction. European uptake depended on local presenters, euro pricing, and next-day fulfilment, underscoring the role of cultural proximity alongside interactivity. Because real-time product demos convert indecision into purchase during the same session, retailers recognise live streams as revenue engines rather than content costs. As sectors from beauty to home décor replicate the template, the live streaming market gains a durable commerce layer that stacks on existing engagement.
Live-Streaming API Integration in SaaS MarTech
During 2024, mid-market software vendors introduced drag-and-drop modules that slot live video into customer-data platforms. A U.S. cosmetics brand embedded product-launch streams within loyalty emails, triggering personalised offers based on browsing history. Management later reported higher revenue per employee thanks to automation replacing manual campaign assembly. When live content is natively addressed inside marketing workflows, it becomes an efficiency lever that amplifies customer lifetime value. Each streamed moment becomes a structured data event, enabling granular segmentation and retargeting. Consequently, MarTech-aligned innovation sustains service-layer growth, creating additional pull-through for bandwidth and cloud-processing volumes across the ecosystem.
Restraints Impact Analysis*
| Restraint | (~) % Impact on CAGR Forecast | Geographic Relevance | Impact Timeline |
|---|---|---|---|
| Bandwidth Cost Volatility in Emerging Markets | -2.9% | Latin America, Africa, Southeast Asia | Medium term (3-4 yrs) |
| Fragmented Global Licensing for Cross-Border Music Streaming Rights | -1.8% | Global | Long term (≥5 yrs) |
| Digital Ad-Fraud Affecting CPM Rates for Live OTT Streams | -2.6% | Global, with higher impact in North America | Short term (≤2 yrs) |
| Latency Sensitivity Limiting Ultra-Low-Delay Use-Cases | -1.1% | Global | Long term (≥5 yrs) |
| Source: Mordor Intelligence | |||
Bandwidth Price Volatility
Variable wholesale transit rates in parts of Southeast Asia forced several creator platforms to impose adaptive-bitrate caps during public holidays in 2024, undercutting ad inventory in peak windows. Operators that had already installed edge transcoders absorbed swings better because on-premise processing slashed upstream data volumes, preserving picture quality. The contrast shows that technical architecture choices can hedge against macro-level cost shocks. Yet smaller services lack capex headroom to replicate this edge strategy, so volatility passes through as lower video quality, weaker engagement, and reduced revenue. Until regional carriers smooth out pricing schedules, bandwidth instability will temper overall live streaming market growth in emerging economies.
Fragmented Cross-Border Licensing
The resurgence of live DJ sets on social platforms in 2025 highlighted inconsistent global royalty frameworks. One start-up attempting simultaneous U.K. and Canadian distribution faced overlapping collection-society claims that delayed its launch by months. Administrative friction discouraged expansion into additional territories that year, even though user demand existed. Legal patchworks thus dictate rollout sequences as much as audience interest, slowing monetisation timelines and raising compliance overheads. Unless standardised licensing protocols emerge, the market will continue to see staggered geographical rollouts that blunt network-scale benefits.
*Our forecasts treat driver/restraint impacts as directional, not additive. The impact forecasts reflect baseline growth, mix effects, and variable interactions.
Segment Analysis
By Component: Solutions Lead While Services Accelerate
Solutions commanded 77.35% of the live streaming market share in 2025 because encoding, content-delivery networks, and player SDKs remain essential for seamless playback. Providers now embed object-level AI that automatically crops vertical shots from landscape feeds, optimising streams for mobile viewers and reducing production overhead. Clients incorporating these features deepen vendor lock-in, illustrating how functional depth strengthens competitive moats. Multipurpose capture also expands content libraries without extra shoots, enhancing monetisation across archives. The result is resilient demand for solutions even as market growth broadens into ancillary services.
Managed and professional services are tracking a 29.68% CAGR through 2031 as enterprises outsource interactive overlays, election-night visualisations, and real-time analytics. A European public broadcaster that outsourced its entire map workflow during the 2024 election cycle cut delivery time in half compared with the previous in-house model. Faster time-to-market lets newsrooms redirect staff toward editorial tasks that differentiate coverage. Because similar efficiencies resonate across education, government, and sports, the services segment enlarges the market while complementing core solutions revenue.


By Type: Video Dominates While Audio Gains Momentum
Video represented 91.40% of the live streaming market size in 2025, anchored by stadium roll-outs of multi-camera angle selection that lengthened average session times during 2025 rugby tournaments. Sub-second latency on new edge nodes allowed viewers to vote on angles without perceptible delay, proving that interactivity reinforces video’s dominance. Such experiential gains translate into higher average revenue per user across sports, news, and entertainment. Meanwhile, ongoing testing of volumetric encoding by BytePlus claims 50% bandwidth savings on immersive feeds , signaling future quality leaps that fortify the category.
Live audio and podcast streams are set to rise above 28.62% annually. A July 2024 science-fiction author hosted a live reading with audience Q and A and recorded a six-fold e-book sales spike during the event. Low production overhead and ubiquitous earbuds make live audio a repeatable engagement tool for authors, educators, and influencers. As platforms bake in tipping and ticketing widgets, audio converts intimate sessions into direct income streams, accelerating its shift from an ancillary feature to a strategic lane within the broader ecosystem.
By Revenue Model: Advertising Leads While Subscriptions Surge
Advertising-supported channels held 63.10% revenue share in 2025, owing to real-time bidding against deterministic viewer data. During a 2025 music festival, a beverage brand inserted mid-stream polls whose answers triggered dynamic creatives, boosting cost per mille. Poll responses also enriched first-party datasets for later campaigns, illustrating how interactivity raises advertising yield. Brands across consumer goods, automotive, and retail now prize such mid-stream engagements, reinforcing advertising’s central role in funding the live streaming market.
Subscriptions are climbing at a 30.55% CAGR as users seek ad-free convenience and exclusive perks. A Latin American fitness app replaced its flat price with tiered packages in 2024 and still grew net revenue despite stable subscriber counts, thanks to the uptake of premium live-class tiers. Upselling inside existing cohorts, therefore, widens revenue per head without escalating acquisition spend. As content owners bundle loyalty points, merchandise discounts, and community chat into subscriber tiers, the live streaming market size for recurring revenue models expands well beyond legacy pay-TV analogues.
By Platform: Mobile Apps Dominate While Smart TV Accelerates
Mobile endpoints represented 55.20% of the live streaming market size in 2025, fuelled by commute-time consumption peaks tracked across Southeast Asian metro Wi-Fi logs. The launch of foldable devices later that year lengthened dwell times for live sports, merging phone and tablet screen experiences. Multi-window features let viewers watch and chat concurrently, deepening session length and social stickiness. Edge-enhanced adaptive streaming then shaves rebuffering to imperceptible levels, cementing mobile’s frontline status in the market.
Smart-TV usage is forecast to rise at 32.65% CAGR as interface ergonomics mature for ten-foot viewing. A Nordic news outlet’s spring 2025 pilot added a remote-control-friendly chapter-skip overlay that lifted completion rates on election coverage. Voice-assistant integration also lets viewers jump to live segments by uttering presenter names, shortening discovery friction. Because living-room screens drive higher CPMs and subscription-bundle possibilities, smart TVs provide a high-value growth lever that complements mobile’s reach.

By End-User Vertical: Media And Entertainment Leads While Gaming Accelerates
Media and entertainment studios held 36.40% of the live streaming market share in 2025, extending revenue by layering director-commentary streams alongside blockbuster releases. Viewers who purchased extended editions during these events delivered incremental margin that surpassed the cost of hosting. Studios now view live extras as evergreen promotional assets that nurture fandom between major releases. Platform analytics show uplift in back-catalogue rentals whenever interactive extras spotlight earlier titles, amplifying lifetime asset value.
Gaming and e-sports are advancing at a 29.10% CAGR. In June 2025, a battle-royale publisher introduced spectator currency redeemable for in-game cosmetics, awarding tokens for watch-time milestones. Daily active users rose on match days, proving that integrated reward loops raise both viewer and player engagement. The mechanic also anchors inventory for skin sponsorships, adding a fresh ad format. As more game studios harmonise viewership incentives with gameplay economies, the market gains a virtuous loop that converts attention into gameplay and back again.
Geography Analysis
Asia-Pacific retained roughly 44.30% of the live streaming market share in 2025, thanks to large user bases and rapid 5G deployment. South Korea’s state-backed network plan drove nationwide average latency below 20 ms, enabling interactive trivia shows at a national scale. Early adoption of 8K trial streams at sporting venues spurred demand for compatible displays, nudging hardware and broadband upgrades together. Japan, Australia, and Singapore add tailwinds through esports investments that seed cross-border multi-language broadcasts. Platform experiments with volumetric concerts in Tokyo further illustrate Asia-Pacific’s role as a test bed for high-bandwidth formats across the market.
The Middle East and Africa region is on a 31.35% CAGR path through 2031. A pan-Arab music awards ceremony in February 2025 streamed in Arabic and English and rang up USD 4.2 million in merchandise sales on opening night, prompting organisers to convert the event into a monthly series. Federation-wide fibre backbones linking stadiums to metro-edge data centres deliver locally hosted origins, cutting latency and payment-gateway failure rates. Nigerian and Kenyan start-ups, empowered by cloud-transcoder price drops, now cover high-school sports and community events without satellite overhead, unlocking hyper-local niches otherwise uneconomical. These developments collectively expand the live streaming market size across a previously underserved demographic base.
North America maintains a leadership position in tooling. Cloud providers revealed sub-second glass-to-glass workflows during 2024 engineering summits, letting sports leagues test real-time betting overlays. Europe champions live commerce; a March 2025 French luxury house sold out EUR 2500 (USD 2764) handbags within 15 minutes during a live drop, proving that scarcity marketing translates to livestream velocity. Latin America advances under a mobile-first paradigm: a Brazilian carnival organiser used tipping overlays in 2024 to fund street-crew costs, showing community-led monetisation at scale. Each region thus reinforces different value propositions, together accelerating global expansion of the live streaming market.

Competitive Landscape
The live streaming market remains fragmented, yet gravitational pull favours platforms layering commerce, fan engagement, and analytics above baseline delivery. Large players deploy capital into proprietary codecs and recommendation engines that widen technical lead over long-tail rivals using open-source stacks. BytePlus unveiled a mesh-rendering workflow in January 2025 that halves bandwidth on volumetric feeds without visible quality loss, setting new norms for immersive economics. Meanwhile, regional incumbents in Asia-Pacific exploit dense peering to deliver sub-second latency, making it harder for global entrants to catch up purely on scale.
White-space opportunities persist wherever incumbents exit. When a U.S. platform withdrew from South Korea in late 2024, a domestic consortium launched an ultra-low-latency alternative within three months, leveraging national peering agreements for near-instant chat round trips. The episode demonstrates that agile regional alliances can fill market gaps quickly. Enterprise solution providers differentiate through compliance guarantees; a U.K. firm secured financial-sector contracts by offering audit-ready replay archives, proving that certification often outweighs sheer traffic numbers in regulated verticals.
Strategic moves span acquisitions, cloud deals, and talent realignment. FuboTV surpassed 1.47 million North American subscribers in Q1 2025 and earned USD 407.9 million after focusing on targeted sports bundles [3]FuboTV Investor Relations, “Q1 2025 Results: Subscriber and Revenue Growth,” ir.fubo.tv. Amazon’s Twitch cut 500 jobs in January 2025 to streamline operations, channeling resources into low-latency infrastructure. Future Today expanded its free ad-supported television (FAST) footprint in March 2025 by adding original scripted drama. These examples show firms hedging bets between subscription, FAST, and premium bundles as they chase diversified revenue across the live streaming market.
Live Streaming Industry Leaders
Twitch Interactive, Inc.
YouTube Live (Alphabet Inc.)
Huya Inc.
DouYu International Holdings Ltd.
Vimeo Inc. (Livestream)
- *Disclaimer: Major Players sorted in no particular order

Recent Industry Developments
- May 2025: FuboTV Inc. reported 1.47 million paying subscribers in North America and revenue of USD 407.9 million, attributing growth to targeted sports bundles.
- April 2025: The Interactive Advertising Bureau projected that digital video will capture close to 60% of U.S. TV-style ad spend in 2025, with connected-TV outlays rising to USD 26.6 billion.
- February 2025: Stream Hatchet announced that global live-streaming watch time reached 32.5 billion hours, with the top platform holding a 61% share.
- December 2024: The Premier League confirmed plans to bring international content production in-house for the 2026/27 season, paving the way for a proprietary streaming service.


Research Methodology Framework and Report Scope
Market Definitions and Key Coverage
Our study defines the live streaming market as all real-time video or audio sessions that are captured, encoded, and distributed over IP networks to multiple viewers on connected devices, spanning consumer and enterprise uses such as gaming, media and entertainment, education, events, social commerce, and internal corporate communications. Revenues assessed by Mordor Intelligence cover advertising, subscription, tipping, pay-per-view, and transactional models that arise directly from the live session.
Scope exclusion: prerecorded video on demand libraries and physical media distribution are not covered.
Segmentation Overview
- By Component
- Solutions (Encoding, Transcoding, CDN, Ingest, Player)
- Services (Managed, Professional, Integration)
- By Type
- Video Streaming
- Audio / Podcast Streaming
- By Revenue Model
- Advertising-Supported (AVOD/FVOD)
- Subscription-Based (SVOD)
- Pay-Per-View and Tipping
- By Platform
- Web
- Mobile Apps
- Smart TV / CTV Devices
- Gaming Consoles and VR
- By End-User Vertical
- Gaming and Esports
- Media and Entertainment Studios
- Sports Federations and Clubs
- News and Events Organisers
- Education and Ed-tech Providers
- Corporate and Enterprise Communications
- By Geography
- North America
- United States
- Canada
- Mexico
- South America
- Brazil
- Argentina
- Rest of South America
- Europe
- Germany
- United Kingdom
- France
- Italy
- Spain
- Rest of Europe
- Asia Pacific
- China
- Japan
- South Korea
- India
- Rest of Asia Pacific
- Middle East and Africa
- United Arab Emirates
- Saudi Arabia
- South Africa
- Rest of Middle East and Africa
- North America
Detailed Research Methodology and Data Validation
Primary Research
Mordor analysts conduct structured interviews with live platform product managers, CDN architects, brand-side media buyers, and event producers across North America, Asia-Pacific, and Europe. Insights on monetization blends, session duration shifts after 5G rollout, and emerging verticals such as live commerce help us close data gaps and fine-tune assumptions.
Desk Research
We begin by mapping the addressable audience with public indicators from bodies such as the International Telecommunication Union, the US Federal Communications Commission, and Eurostat that quantify broadband reach and speed. Streaming traffic splits reported by content delivery networks, IAB digital video ad spending, Entertainment Software Association gamer counts, and academic journals on low latency codecs provide further boundary conditions. Company 10Ks, investor decks, and regional telecom filings flesh out platform revenues and CDN cost trends, while curated feeds from D&B Hoovers and Dow Jones Factiva surface timely financial moves that influence supply. This list is illustrative; many additional open datasets and industry whitepapers inform the secondary layer.
Market Sizing and Forecasting
A top-down construct anchors the model: global streaming traffic and digital video revenue pools are rebuilt, and then live stream penetration, average ad load minutes, paid subscriber share, and tipping take rates are applied. Supplier roll-ups of disclosed platform revenues and sampled ASP by viewer ratios act as bottom-up sense checks before totals are finalized. Key variables like 5G smartphone penetration, median session length, CPM inflation, creator payout ratios, and regional fiber coverage drive year-by-year changes. Multivariate regression blended with an ARIMA overlay projects the 2025 to 2030 path, while scenario stress tests adjust for regulatory or bandwidth shocks.
Data Validation and Update Cycle
Outputs face variance screens against external traffic trackers and payment flows, followed by a two-tier analyst review. Reports refresh annually, with in-cycle updates when platform policy shifts or major mergers move the needle; a closing validation pass ensures clients receive the freshest view.
Why Mordor's Live Streaming Baseline Earns Decision Maker Trust
Published figures often diverge because firms differ on what counts as "live," which revenues attach, and how refresh cadences handle rapid platform pivots.
Key gap drivers include inclusion of prerecorded streams, counting live commerce separately, currency translation timing, and whether unpaid user-generated sessions are monetized in the base year. Mordor's scope stays disciplined, our refresh happens every twelve months, and our hybrid model reconciles traffic physics with real money flows, giving stakeholders a steady middle ground.
Benchmark comparison
| Market Size | Anonymized source | Primary gap driver |
|---|---|---|
| USD 76.86 B (2025) | Mordor Intelligence | - |
| USD 99.82 B (2024) | Global Consultancy A | Includes prerecorded OTT and cloud DVR revenues |
| USD 87.80 B (2024) | Industry Association B | Applies single digit ad load assumption, no tipping income |
| USD 104.90 B (2024) | Trade Journal C | Counts live commerce streams and influencer retail sales |
The comparison shows that once differing scopes and monetization levers are stripped away, Mordor's balanced approach delivers a transparent, repeatable baseline that executives can rely on for budgeting, partnership, and investment decisions.


Key Questions Answered in the Report
How big is the Live Streaming Market?
The Live Streaming Market size is expected to reach USD 97.39 billion in 2026 and grow at a CAGR of 26.74% to reach USD 318.56 billion by 2031.
What is the current Live Streaming Market size?
In 2026, the Live Streaming Market size is expected to reach USD 97.39 billion.
Who are the key players in Live Streaming Market?
Twitch Interactive, Inc., YouTube Live (Alphabet Inc.), Huya Inc., DouYu International Holdings Ltd., Vimeo Inc. (Livestream) are the major companies operating in the Live Streaming Market.
Which is the fastest growing region in Live Streaming Market?
Middle East and Africa is estimated to grow at the highest CAGR over the forecast period (2026-2031).
Which region has the biggest share in Live Streaming Market?
In 2025, the Asia-Pacific accounts for the largest market share in Live Streaming Market.
What years does this Live Streaming Market cover, and what was the market size in 2025?
In 2025, the Live Streaming Market size was estimated at USD 97.39 billion. The report covers the Live Streaming Market historical market size for years: 2019, 2020, 2021, 2022, 2023 and 2024. The report also forecasts the Live Streaming Market size for years: 2026, 2027, 2028, 2029, 2030 and 2031.
Page last updated on:


