Sound Reinforcement Market Size and Share
Market Overview
| Study Period | 2019 - 2030 |
|---|---|
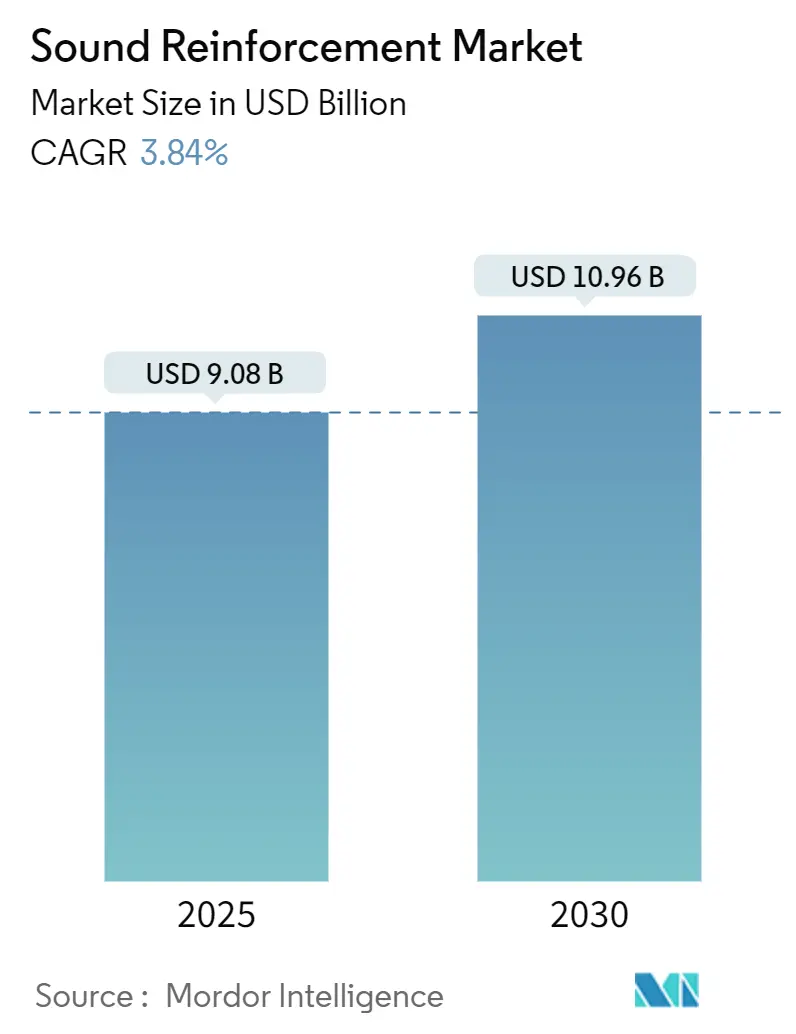
| Market Size (2025) | USD 9.08 Billion |
| Market Size (2030) | USD 10.96 Billion |
| Growth Rate (2025 - 2030) | 3.84% CAGR |
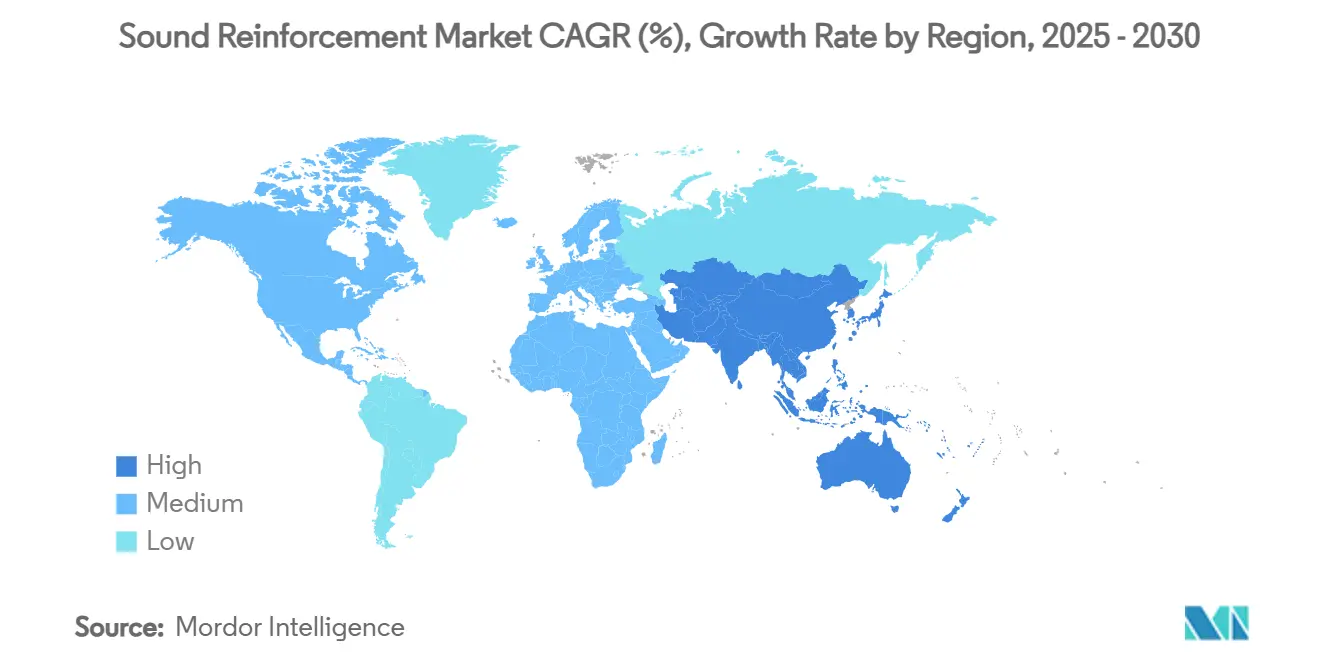
| Fastest Growing Market | Asia Pacific |
| Largest Market | North America |
| Market Concentration | Medium |
Major Players
*Disclaimer: Major Players sorted in no particular order Image © Mordor Intelligence. Reuse requires attribution under CC BY 4.0. |
|
Sound Reinforcement Market Analysis by Mordor Intelligence
The sound reinforcement market size reached USD 9.08 billion in 2025 and is projected to register a 3.84% CAGR, expanding to USD 10.96 billion by 2030. The outlook reflects a clear step-up from the pandemic trough as venue utilisation returns to historical norms, ticketed events exceed pre-2020 attendance, and corporate buyers switch from one-off emergency upgrades to planned refresh cycles. Rising demand for cloud-managed, networked audio platforms is reshaping procurement criteria, pushing suppliers to bundle software licences alongside hardware deliveries. Supply-side innovation in recyclable cabinet materials and rare-earth-free magnets is lowering environmental compliance risk while broadening sourcing options. Meanwhile, strategic buyers are accelerating M&A to secure end-to-end ecosystems that span loudspeakers, DSP, control, and monitoring, reinforcing the commercial logic for vertically integrated portfolios. Growing spectrum congestion for wireless microphones remains a limiting factor, but early adoption of WMAS technologies indicates a technical path to continued growth.
Key Report Takeaways
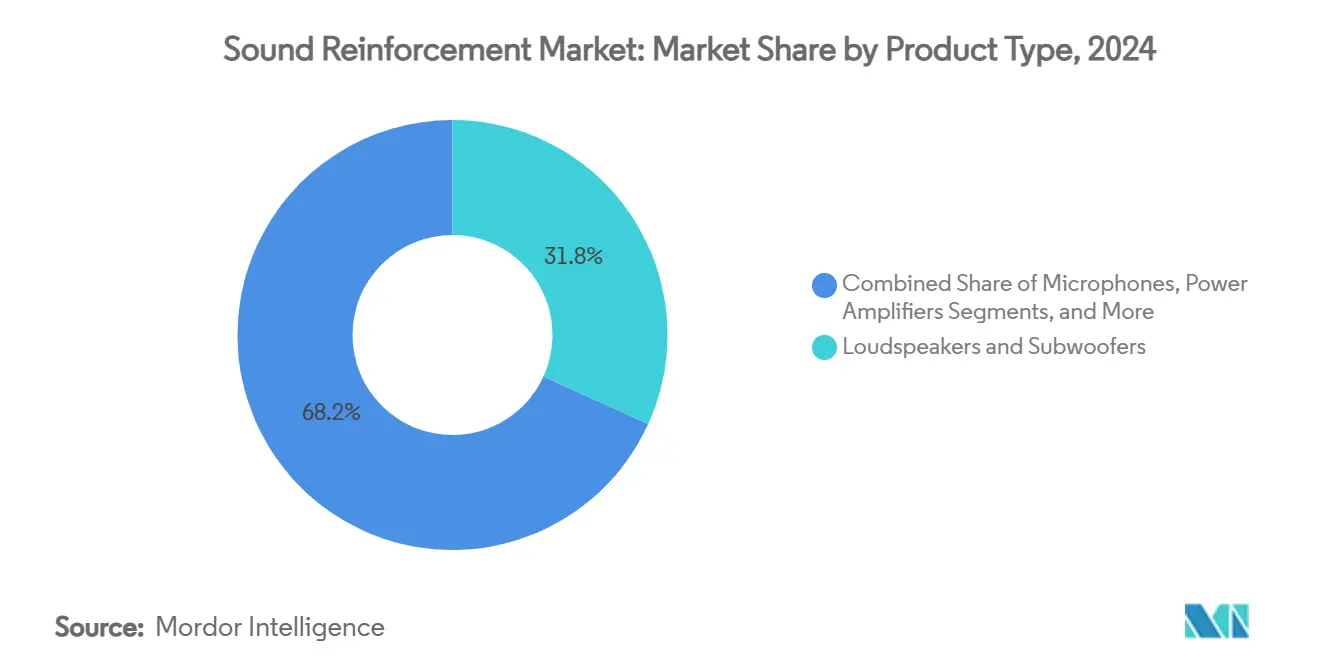
- By product category, loudspeakers and subwoofers led with 31.80% revenue share of the sound reinforcement market in 2024, while networked DSP nodes are forecast to expand at a 4.35% CAGR to 2030.
- By end user, touring and live concerts held 20.30% of the sound reinforcement market size in 2024; corporate and conferencing applications exhibit the highest projected CAGR at 4.78% through 2030.
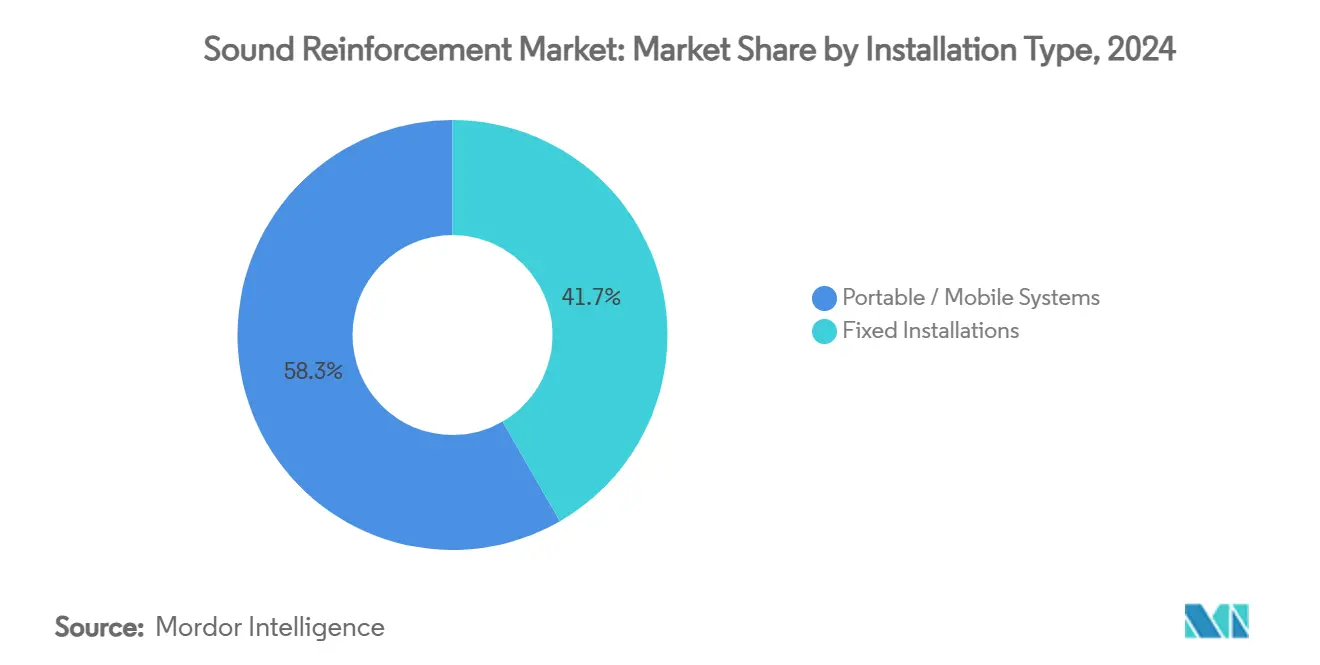
- By installation type, fixed installations commanded 41.67% of the sound reinforcement market size in 2024, whereas portable systems are advancing at a 5.23% CAGR to 2030.
- By technology, wired-analog architectures still account for 61.56% of the sound reinforcement market size in 2024, yet networked solutions are growing at a 4.98% CAGR to 2030.
- By geography, North America captured 34.89% of the sound reinforcement market share in 2024; Asia-Pacific records the fastest regional CAGR at 4.23% over the forecast horizon
Global Sound Reinforcement Market Trends and Insights
Drivers Impact Analysis*
| Driver | (~) % Impact on CAGR Forecast | Geographic Relevance | Impact Timeline |
|---|---|---|---|
| Rapid resurgence of live events and touring | +1.2% | North America, Europe; global spill-over | Short term (≤ 2 years) |
| Deployment of networked audio in corporate AV | +0.8% | North America, EU; expanding Asia-Pacific | Medium term (2–4 years) |
| Growth of hybrid-work conferencing spaces | +0.6% | Global; led by US corporate sector | Medium term (2–4 years) |
| Government smart-campus stimulus | +0.4% | United States; select EU regions | Short term (≤ 2 years) |
| Immersive/3-D audio adoption | +0.3% | Premium venues in US and EU | Long term (≥ 4 years) |
| ESG demand for recyclable enclosures | +0.2% | EU-led; global diffusion | Long term (≥ 4 years) |
| Source: Mordor Intelligence | |||
Rapid resurgence of live events and touring post-pandemic
Live event attendance surpassed pre-2020 records, with the largest promoter reporting 144 million tickets sold in 2024 and a 39% profit jump, confirming a decisive rebound in demand for high-output touring systems. Operators are investing in modular line-array packages that scale from 2,000-seat theatres to 60,000-seat stadiums without re-rigging. Equipment turnovers that were deferred in 2020-2022 have now converged with higher production values, creating a multi-year replacement cycle. Rental companies are refreshing amplifier racks to include native network ports for remote diagnostics during shows. Manufacturers cite double-digit shipment growth in 2024 for flagship touring models, with backlog stretching well into 2026. The upswing is most visible in North America and Western Europe, yet early bookings for Asia-Pacific festivals highlight rising global diffusion.
Increasing deployment of networked (Dante/AVB) audio systems in corporate AV
Dante-enabled product listings climbed to 4,176 models across 460 brands in 2024, reflecting broader uptake beyond broadcast into mainstream corporate estates. Facilities teams prefer single-cable audio, video, and control to reduce rack space and leverage existing IT switches. Rollouts often start in boardrooms before scaling to campus-wide multi-zone paging and emergency alert systems. Configuration via familiar network management consoles cuts commissioning times by up to 35%, lowering labour costs. Vendors bundle perpetual licences for redundant Dante domains, aligning with corporate disaster-recovery policies. As IT departments take budget ownership, demand tilts toward products with secure firmware signing and cyber-audit logs.
Growth of hybrid-work conferencing spaces demanding installed sound solutions
Corporate headcount remains geographically dispersed, driving consistent utilisation of video-enabled spaces even on peak in-office days.[1]AVIXA, “6 AV Trends to Look Out For in 2025,” avixa.org Enterprises are converting former storage areas into acoustically treated huddle zones requiring flush-mount loudspeakers and beamforming microphones. DSP amplifiers with AI noise suppression offset HVAC rumble and adjacent room chatter, improving speech intelligibility for remote participants. Procurement frameworks now specify minimum speech transmission index (STI) scores, pushing integrators to perform in-situ verification. Service contracts that bundle firmware updates and remote monitoring generate predictable annual recurring revenue for manufacturers. The shift to platform-agnostic codecs means audio hardware must interface seamlessly with Teams, Zoom, and Webex.
Government stimulus for smart-campus upgrades (K-12 and higher-ed)
US federal infrastructure grants accelerate audio-visual modernisation in schools, mandating lecture-capture and emergency notification capabilities. District consolidations, triggered by projected enrolment declines to 52.1 million by 2030, channel funds toward fewer yet better-equipped facilities. Procurement rules favour multi-vendor bidding, but value-added points accumulate for suppliers offering unified classroom management dashboards. Standardised speaker arrays simplify maintenance across campuses, while PoE-powered ceiling speakers minimise electrical subcontractor costs. The funded rollout pace requires manufacturers to guarantee stock availability within 10 days, elevating supply-chain resilience as a competitive differentiator.
Restraints Impact Analysis*
| Restraint | (~) % Impact on CAGR Forecast | Geographic Relevance | Impact Timeline |
|---|---|---|---|
| RF spectrum crowding and wireless mic caps | –0.7% | Dense urban markets worldwide | Short term (≤ 2 years) |
| Price sensitivity in emerging-market venues | –0.5% | Southeast Asia, Latin America | Medium term (2–4 years) |
| Supply-chain volatility for magnets and DSP ICs | –0.4% | Global; production centered in East Asia | Short term (≤ 2 years) |
| Rising e-waste compliance costs | –0.2% | EU, followed by broader OECD uptake | Long term (≥ 4 years) |
| Source: Mordor Intelligence | |||
RF spectrum crowding and regulatory caps on wireless microphones
The US FCC WMAS order effective November 2024 reduces legacy 600 MHz availability, forcing venues to retune or retire inventory.[2]Federal Communications Commission, “Wireless Microphones in the TV Bands,” fcc.gov Urban sites already juggle DTV, 5G, and public-safety channels, leaving narrow windows for multi-channel productions. Compliance upgrades require investment in digital transmitters with narrower bandwidth and higher modulation efficiency. Smaller houses lack in-house RF coordination skills, driving consultancy costs upward. Touring productions must carry region-specific frequency tables, increasing prep time. Although WMAS promises higher channel density, transition pain is front-loaded into 2024-2026 budgets.
Price sensitivity among emerging-market venue owners
Operators in Southeast Asia and parts of Latin America favour proven analog stacks priced 25% below networked equivalents. Currency volatility erodes purchasing power, pushing buyers to staged deployments. Local assemblers undercut branded imports by substituting lower-grade drivers and plywood cabinets, challenging premium suppliers to justify value. Some multinationals respond with stripped-down series that maintain core transducer quality while omitting ancillary ports. Financing schemes such as pay-per-show rentals help bridge the affordability gap but drain working capital for rental houses.
*Our forecasts treat driver/restraint impacts as directional, not additive. The impact forecasts reflect baseline growth, mix effects, and variable interactions.
Segment Analysis
By Product Type: Loudspeakers anchor demand while DSP nodes escalate digital control
The loudspeaker category claimed the largest slice at 31.80% of the 2024 sound reinforcement market share, underscoring its non-substitutable role in every deployment. Continuous driver innovations, such as carbon-fibre composite cones and fatigue-resistant surrounds, deliver higher SPL per kilogram, catering to rigging-weight limits. Column arrays penetrate houses of worship, leveraging slim profiles that respect sightlines. Subwoofer modules incorporate cardioid presets to tame low-frequency spill, a feature increasingly demanded by multi-use venues.
Networked DSP nodes register the fastest 4.35% CAGR through 2030, propelled by the shift toward software-centric architectures. In mid-scale conference estates, a single half-rack DSP replaces discrete feedback suppressors, delay lines, and compressors, cutting cabinet count. Licensing models that unlock additional acoustic echo cancellation or FIR filter taps provide upsell paths without hardware swaps. The convergence of processing and control smooths commissioning workflows, thereby lowering total cost of ownership.


By End User: Touring retains prominence but corporate investments accelerate
Touring and live concerts absorbed 20.30% of 2024 spending, reflecting robust arena calendars and rising ticket prices. Riders from A-list acts now specify redundant network backbones and IP-addressable amplifiers for live diagnostics. Rental houses refresh inventory every 48 months to capture residual value before cosmetic wear degrades pricing in secondary markets.
Corporate and conferencing environments show the fastest 4.78% CAGR as hybrid-work policies become permanent. Enterprises mandate uniform user experience across regional offices, encouraging global frame contracts with tier-one suppliers. The shift to subscription-based meeting-room bundles increases predictability in order volumes. Room analytics revealing utilisation patterns inform space planning, feeding a virtuous cycle of AV investments.
By Installation Type: Fixed installs dominate, yet portable systems outpace
Fixed installations generated 41.67% of 2024 revenue, anchored in stadiums, performing-arts centres, and large corporate campuses. Building-management-system integration is now a bid prerequisite, leading suppliers to provide BACnet- or MQTT-compatible gateways. Long amortisation periods favour ruggedised finishes and conformal-coated PCBs.
Portable rigs expand at a 5.23% CAGR as multi-purpose venues value flexibility. Battery-powered columns support outdoor civic events without access to mains. All-in-one mixer-amplifier-speaker units reach SPLs suitable for 500-seat halls, minimising truck rolls. Manufacturers introduce snap-together rigging hardware to cut load-in times, a key metric for unionised stages.
By Technology: Analog sustains large installed base while networked platforms scale
Wired analog systems still represent 61.56% of 2024 revenue because simplicity, determinism, and technician familiarity outweigh advanced monitoring in many settings.[3]Audinate, “Audinate Annual Report 2024,” investor.audinate.com Replacement cycles in legacy theatres favour like-for-like swaps to avoid re-certification of safety infrastructure. Analog proponents cite lower latency and immunity to network outages.
Networked audio grows 4.98% CAGR, extending from flagship arenas into 200-seat classrooms. Auto-discovery protocols and GUI-based patching shorten deployment, letting IT-skilled staff manage audio endpoints. Converged AV/IT networks cut cabling materials by up to 30%, a persuasive factor in new-build projects. Interoperability between Dante, AES67, and MILAN progresses, gradually reducing protocol lock-in fears.
Geography Analysis
North America accounted for 34.89% of 2024 revenue, sustained by a dense inventory of arenas, convention centres, and enterprise headquarters. Live Nation added 8 million incremental fan capacity via renovated or newly built venues, directly lifting hardware demand.[4]Live Nation Entertainment, "Q3 2024 Shareholder Letter," livenationentertainment.com Corporate leases that embed hybrid-meeting-ready rooms fuel mid-cycle refreshes of installed systems. FCC spectrum rules influence global product-roadmap timing, with suppliers often launching US-compliant SKUs first. Workforce-development grants fund AV apprenticeships, mitigating the technician shortage that previously delayed installations.
Europe posted steady performance, balancing mature entertainment markets with stringent environmental directives that stimulate product redesign toward recyclability. Energy-efficiency targets encourage Class-D amplification with idle power below 2 W. Public procurement emphasises "green" criteria, making lifecycle assessments integral to bid responses. Cross-border touring rebounds, aided by streamlined post-Brexit carnet processes.
Asia-Pacific delivered the fastest 4.23% CAGR and is projected to reach parity with Europe before 2029. Chinese OEMs leverage domestic scale to penetrate price-sensitive tiers abroad while investing in premium R&D units targeting high-end export segments. India's tier-II cities pursue convention-centre construction, each requiring integrated PA and evacuation systems. Regional heterogeneity in RF regulations pushes multinational suppliers to pre-load firmware with country templates, reducing compliance risk on arrival.

Competitive Landscape
Industry consolidation accelerated in 2024-2025 as buyers sought cloud-native platforms and vertically integrated portfolios. Acuity Brands’ USD 1.215 billion purchase of QSC folds the Q-SYS control ecosystem into a broader building-automation suite, illustrating convergence of lighting, HVAC, and audio under a single pane of glass. Bose’s acquisition of the McIntosh Group signals intent to stretch from consumer to premium installed-sound segments.
Top incumbents Harman (including JBL Professional), Yamaha, and Shure exploit diversified catalogues and global service networks to defend share. They emphasise software-upgradable DSP, firmware cyber-hardening, and cloud monitoring to remain competitive against newer, software-centric entrants. Boutique firms such as L-Acoustics and d&b audiotechnik maintain technology leadership in high-end touring by pioneering cardioid sub arrays and object-based processing.
Private-equity investors are active: Providence acquired d&b Group in February 2025, promising capital to scale immersive audio R&D. Supply-chain strategies pivot toward dual-region PCB assembly and magnet sourcing to insulate margins from geopolitical shocks. Competitive success now hinges less on raw transducer performance and more on interoperability, remote diagnostics, and lifecycle services.
Sound Reinforcement Industry Leaders
-
Yamaha Corporation
-
Shure Incorporated
-
Sennheiser Electronic
-
Bose Corporation
-
Harman International
- *Disclaimer: Major Players sorted in no particular order

Recent Industry Developments
- February 2025: Providence acquired d&b Group, a leading manufacturer of professional loudspeaker systems, expanding the investment firm’s entertainment-technology holdings.
- January 2025: Acuity Brands completed its USD 1.215 billion acquisition of QSC, integrating the audio manufacturer into its Intelligent Spaces Group.
- January 2025: Marshall Group sold a majority stake to HongShan Capital Group for EUR 1.1 billion, with the Marshall family retaining over 20% ownership.
- December 2024: Gentex Corporation signed a definitive agreement to acquire VOXX International Corporation for USD 7.50 per share, adding brands such as Klipsch and Onkyo.


Global Sound Reinforcement Market Report Scope
| Loudspeakers and Subwoofers |
| Microphones (Wired and Wireless) |
| Mixers and Consoles |
| Power Amplifiers |
| Signal Processing and DSP Nodes |
| Accessories and Others |
| Touring and Live Concerts |
| Fixed Install - Entertainment Venues |
| Corporate and Conferencing |
| Education |
| Houses of Worship |
| Broadcast and Sports |
| Other End Users |
| Portable / Mobile Systems |
| Fixed Installations |
| Wired/Analog |
| Wireless (UHF / 2.4 GHz) |
| Networked (Dante, AVB, AES67) |
| North America | United States | |
| Canada | ||
| South America | Brazil | |
| Argentina | ||
| Rest of South America | ||
| Europe | Germany | |
| United Kingdom | ||
| France | ||
| Russia | ||
| Rest of Europe | ||
| Asia-Pacific | China | |
| Japan | ||
| India | ||
| Australia | ||
| Rest of Asia-Pacific | ||
| Middle East and Africa | Middle East | Saudi Arabia |
| United Arab Emirates | ||
| Rest of Middle East | ||
| Africa | South Africa | |
| Egypt | ||
| Rest of Africa | ||
| By Product Type | Loudspeakers and Subwoofers | ||
| Microphones (Wired and Wireless) | |||
| Mixers and Consoles | |||
| Power Amplifiers | |||
| Signal Processing and DSP Nodes | |||
| Accessories and Others | |||
| By End User | Touring and Live Concerts | ||
| Fixed Install - Entertainment Venues | |||
| Corporate and Conferencing | |||
| Education | |||
| Houses of Worship | |||
| Broadcast and Sports | |||
| Other End Users | |||
| By Installation Type | Portable / Mobile Systems | ||
| Fixed Installations | |||
| By Technology | Wired/Analog | ||
| Wireless (UHF / 2.4 GHz) | |||
| Networked (Dante, AVB, AES67) | |||
| By Geography | North America | United States | |
| Canada | |||
| South America | Brazil | ||
| Argentina | |||
| Rest of South America | |||
| Europe | Germany | ||
| United Kingdom | |||
| France | |||
| Russia | |||
| Rest of Europe | |||
| Asia-Pacific | China | ||
| Japan | |||
| India | |||
| Australia | |||
| Rest of Asia-Pacific | |||
| Middle East and Africa | Middle East | Saudi Arabia | |
| United Arab Emirates | |||
| Rest of Middle East | |||
| Africa | South Africa | ||
| Egypt | |||
| Rest of Africa | |||


Key Questions Answered in the Report
What is the current value of the global sound reinforcement market?
The sound reinforcement market size was USD 9.08 billion in 2025 and is projected to grow to USD 10.96 billion by 2030.
Which product segment leads the sound reinforcement market?
Loudspeakers and subwoofers hold the top position with 31.80% of 2024 revenue.
Which end-user segment is expanding fastest in the sound reinforcement market?
Corporate and conferencing spaces show the highest forecast CAGR at 4.78% through 2030.
How big is North America’s contribution to the sound reinforcement market?
North America accounted for 34.89% of global revenue in 2024, the largest regional share.
What technological trend is reshaping the sound reinforcement market?
Migration to networked audio platforms such as Dante and AVB is accelerating, with a 4.98% CAGR forecast through 2030.
What is the main regulatory challenge facing wireless microphones?
New FCC WMAS rules reduce available spectrum, forcing venues to adopt higher-efficiency digital systems.
Page last updated on:


