Automation-as-a-Service Market Size and Share
Market Overview
| Study Period | 2020 - 2031 |
|---|---|
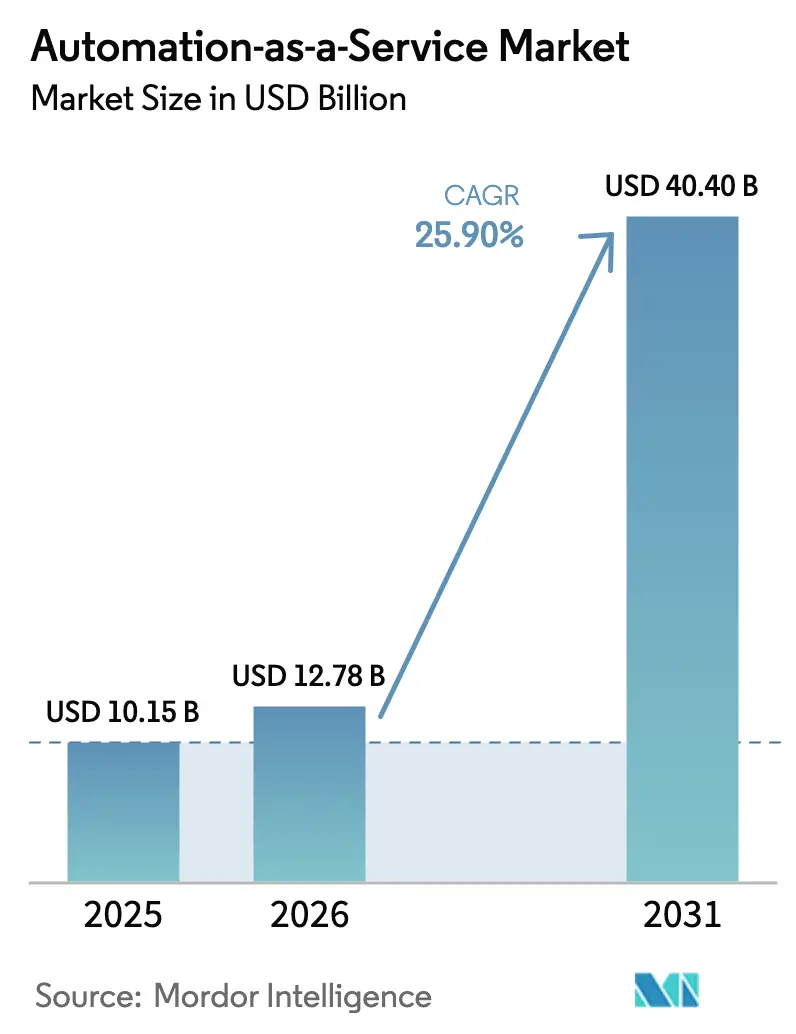
| Market Size (2026) | USD 12.78 Billion |
| Market Size (2031) | USD 40.4 Billion |
| Growth Rate (2026 - 2031) | 25.90% CAGR |
| Fastest Growing Market | Asia Pacific |
| Largest Market | North America |
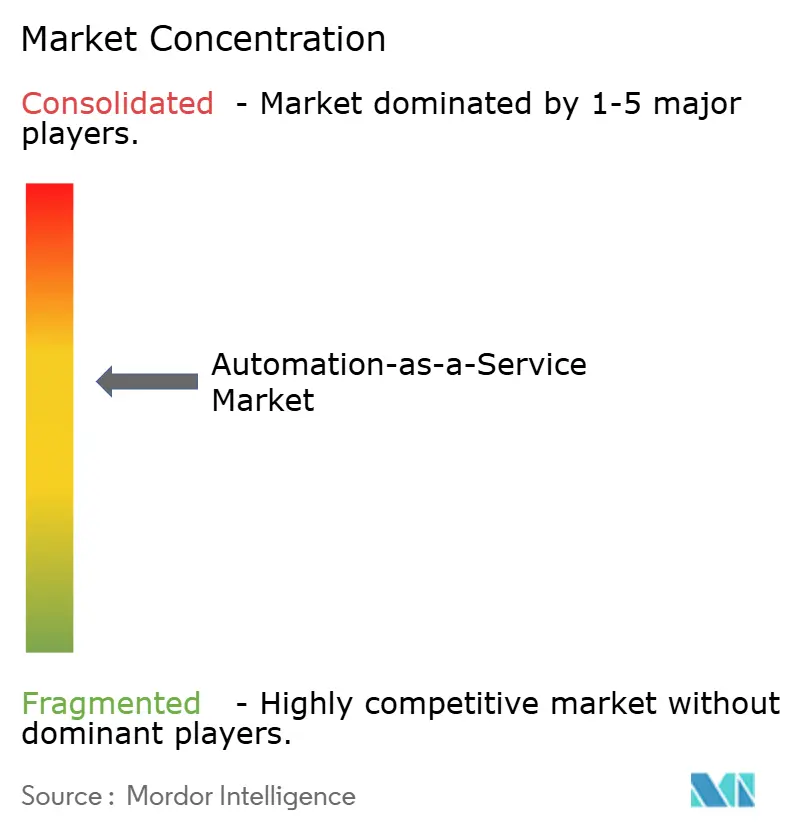
| Market Concentration | Medium |
Major Players *Disclaimer: Major Players sorted in no particular order Image © Mordor Intelligence. Reuse requires attribution under CC BY 4.0. | |
Automation-as-a-Service Market Analysis by Mordor Intelligence
The Automation-as-a-Service market size is expected to grow from USD 10.15 billion in 2025 to USD 12.78 billion in 2026 and is forecast to reach USD 40.4 billion by 2031 at 25.9% CAGR over 2026-2031. Adoption is accelerating as enterprises embed generative-AI features into existing robotic-process-automation investments while containing capital outlays through subscription billing. Robust cloud ecosystems, the rise of low-code design studios, and the emergence of domain marketplaces for ready-made bots are widening the addressable customer base. Integrations that combine process-mining diagnostics with event-driven orchestration allow real-time optimization, pushing automation programs from task level gains to end-to-end workflow redesign. Vendors with vertically integrated stacks that span discovery, build and run phases continue to displace point solutions, especially in regulated industries that demand unified governance[1]ServiceNow, “ServiceNow to Acquire Moveworks,” servicenow.com.
Key Report Takeaways
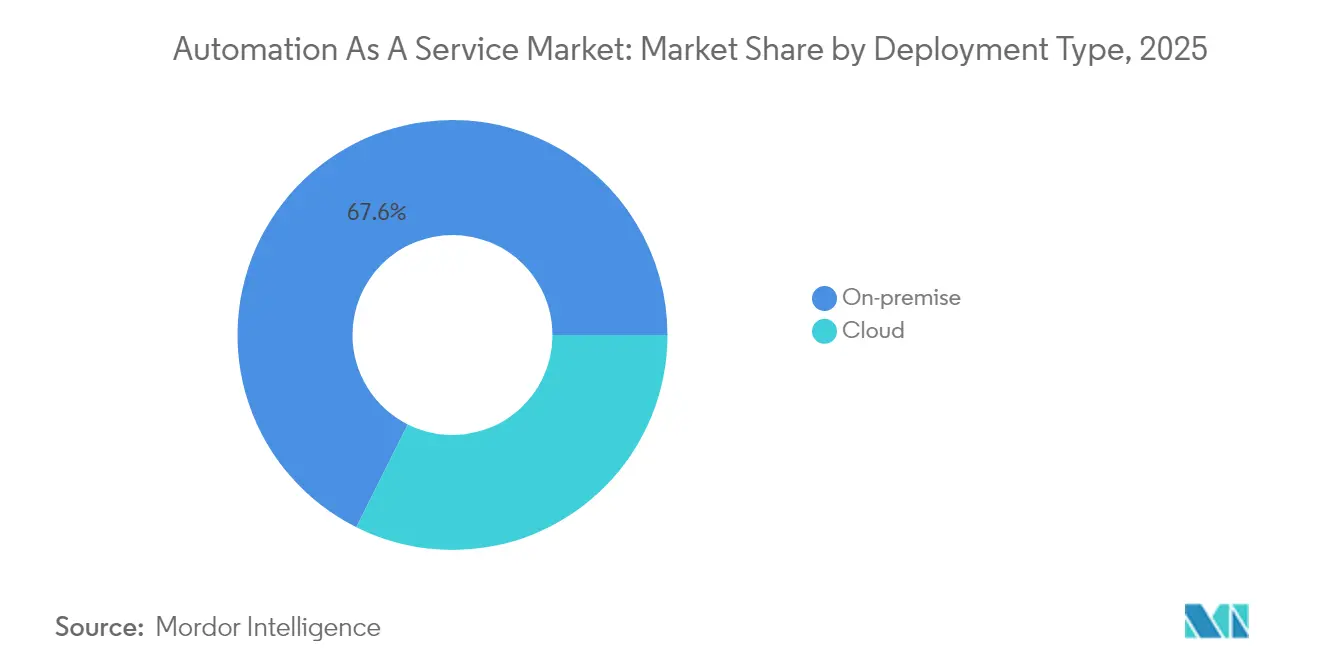
- By deployment type, on-premise solutions led with 67.62% of Automation-as-a-Service market share in 2025; cloud deployments are advancing at a 27.3% CAGR through 2031.
- By component, solution platforms captured 66.05% revenue share in 2025, while services are projected to record a 27.2% CAGR by 2031.
- By business function, IT operations held 44.65% of the Automation-as-a-Service market size in 2025; sales and marketing workflows are growing fastest at 26.6% CAGR.
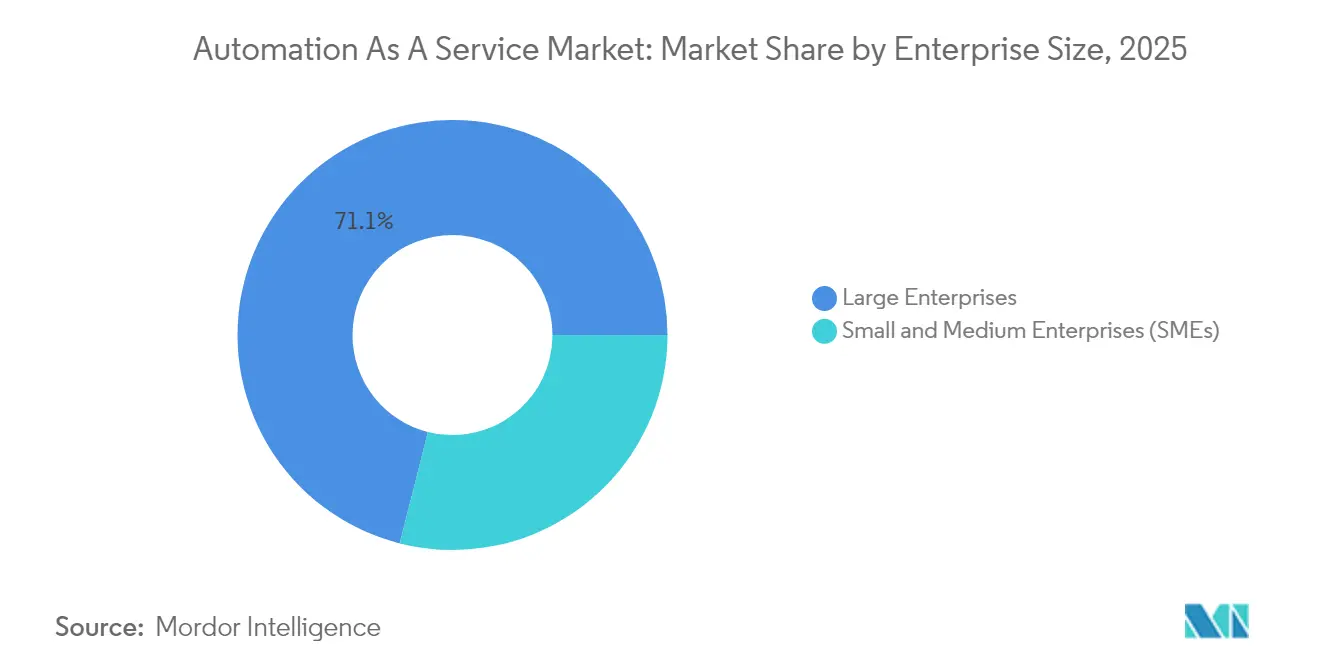
- By enterprise size, large enterprises commanded 71.05% revenue share in 2025; SMEs are set to expand at 26.9% CAGR, helped by usage-based billing.
- By end-user vertical, telecom and IT accounted for 22.55% of 2025 revenues, whereas BFSI is forecast to climb at a 26.3% CAGR to 2031.
- By geography, North America contributed 38.15% revenue in 2025; Asia-Pacific is on track to post a 26.4% CAGR through 2031.
Note: Market size and forecast figures in this report are generated using Mordor Intelligence’s proprietary estimation framework, updated with the latest available data and insights as of 2026.
Global Automation-as-a-Service Market Trends and Insights
Drivers Impact Analysis*
| Driver | (~) % Impact on CAGR Forecast | Geographic Relevance | Impact Timeline |
|---|---|---|---|
| Rising demand for business-process automation | +4.8% | Global, with concentration in North America & Europe | Medium term (2-4 years) |
| Cloud-first IT strategies accelerating AaaS adoption | +5.2% | Global, led by North America, expanding in APAC | Short term (≤ 2 years) |
| Convergence of RPA with Gen-AI for hyper-automation | +6.1% | North America & Europe core, spillover to APAC | Medium term (2-4 years) |
| Subscription and usage-based pricing lowering SME entry barriers | +3.9% | Global, particularly strong in emerging markets | Short term (≤ 2 years) |
| Emergence of domain-specific bot marketplaces | +2.7% | North America & Europe, early adoption in APAC | Long term (≥ 4 years) |
| Integration of process-mining insights to drive end-to-end automation | +4.1% | Global, with enterprise concentration in developed markets | Medium term (2-4 years) |
| Source: Mordor Intelligence | |||
Rising Demand for Business-Process Automation
Business units now originate 44% of all newly automated workflows, signalling that citizen developers are complementing central IT teams. Revenue-operations projects account for nearly half of live automations, underscoring a pivot toward customer-facing use cases. As cross-functional teams re-engineer hand-offs, demand rises for platforms that can manage granular permissions while enabling low-code composition. Complexity is also increasing: 61% of active bots execute multistep logic rather than single-task macros. Customer support processes experienced triple-digit growth, showing that automation is firmly linked to retention strategies during cost-constrained economic cycles.
Cloud-First IT Strategies Accelerating AaaS Adoption
Multi-tenant architectures let providers roll out new capabilities to every client instance without scheduled downtime, shortening innovation cycles[2]IBM, “Accelerating Digital Transformation with Cloud Automation,” ibm.com. Infrastructure-as-Code templates further reduce friction by standardising environment provisioning across testing, staging and production tiers. For SMEs, pay-as-you-go consumption shifts automation spending to operating budgets and removes server maintenance overhead. Enterprises with hybrid footprints place latency-sensitive workloads at the edge while orchestrating policies centrally in the cloud, balancing sovereignty rules with elastic scale. As a result, cloud-centric deployments are outpacing overall Automation-as-a-Service market growth.
Convergence of RPA with Generative AI for Hyper-Automation
Platform vendors now embed large-language-model agents that interpret unstructured text, images, and audio, expanding addressable tasks by 400% in 2024. Joint roadmaps between ServiceNow’s Now Assist and Microsoft Copilot illustrate how conversational AI can trigger cross-application workflows without context switching. Real-time summarisation and autonomous decision suggestions shorten process cycle times, yet also require least-privilege designs to stop over-permissive token scopes. Organisations increasingly adopt zero-trust gateways to monitor every API call, ensuring that AI agents cannot exfiltrate sensitive records. Early pilots show double-digit throughput gains in claims handling and invoice reconciliation when generative-AI steps replace manual validation.
Subscription and Usage-Based Pricing Lowering SME Entry Barriers
Tiered plans that bundle starter bot capacity with community support let smaller firms digitise repeat tasks without dedicated administrators. Because fees scale with execution minutes or API calls, businesses can ratchet consumption up or down in line with volatile demand, an attractive hedge against economic uncertainty. Vendors have also opened template libraries where independent creators monetise niche automations, expanding coverage for local regulatory or language requirements. Combined, these dynamics enable SMEs to adopt sophisticated capabilities that were once reserved for Fortune 500 budgets, fuelling a widening Automation-as-a-Service market footprint across developing economies.
Restraints Impact Analysis*
| Restraint | (~) % Impact on CAGR Forecast | Geographic Relevance | Impact Timeline |
|---|---|---|---|
| Data-security and privacy concerns in multi-tenant clouds | -2.8% | Global, particularly stringent in Europe & regulated industries | Short term (≤ 2 years) |
| Integration complexity with legacy/on-prem systems | -3.1% | North America & Europe, with aging infrastructure | Medium term (2-4 years) |
| Regulatory scrutiny over algorithmic transparency and ethics | -1.9% | Europe leading, expanding to North America & APAC | Long term (≥ 4 years) |
| Scarcity of low-code automation governance talent | -2.4% | Global, acute in emerging markets | Medium term (2-4 years) |
| Source: Mordor Intelligence | |||
Data-Security and Privacy Concerns in Multi-Tenant Clouds
Shared-infrastructure models increase lateral-movement risk if isolation controls fail, a top worry for financial-services and healthcare buyers. The issue is amplified when AI copilots inherit broad OAuth scopes, potentially exposing confidential content through prompt injections. European regulators enforce strict residency and automated-decision disclosure rules, forcing providers to certify encryption standards and segregate logs. Vendors respond with customer-managed keys, regionally pinned data stores and continuous compliance dashboards. Adoption momentum remains solid but buyers in highly regulated sectors proceed with staged rollouts that start with low-risk processes.
Integration Complexity with Legacy/On-Prem Systems
Mainframes and proprietary ERPs often lack modern APIs, compelling teams to build brittle screen-scrape connectors or commission high-cost middleware. Hybrid estates then face challenges around transaction idempotency and synchronised error handling, increasing operational risk. Many early programs underestimated these hurdles, leading to delayed paybacks and scope reductions. A growing partner ecosystem now offers pre-built connectors and process-mining insights to map hidden dependencies, yet full rationalisation remains a multi-year journey for large incumbents. The Automation-as-a-Service market therefore sees higher service-revenue mix as specialist integrators step in to de-risk modernisation projects.
*Our forecasts treat driver/restraint impacts as directional, not additive. The impact forecasts reflect baseline growth, mix effects, and variable interactions.
Segment Analysis
By Deployment Type: Cloud Adoption Gains Ground
On-premise installations retained 67.62% share of the Automation-as-a-Service market in 2025, reflecting strict sovereignty mandates and sunk hardware investments within finance and public-sector domains. Nevertheless, cloud variants are expanding at a 27.3% CAGR as organisations migrate non-critical workflows and development sandboxes to reduce infrastructure upkeep. Vendors now provide single-tenant VPC options that satisfy audit requirements while preserving elastic scale and automated patching. Edge deployments process data locally for latency-sensitive tasks before routing enriched payloads to central analytics, creating a hybrid topology that balances performance with governance. Contracts increasingly bundle both operating modes under unified dashboards, enabling administrators to shift workloads dynamically based on cost or compliance triggers. This flexibility positions cloud models as the long-run growth engine of the Automation-as-a-Service market, particularly for green-field digital businesses that never owned data-centre assets.


By Component: Rising Services Intensity
Solutions accounted for 66.05% revenue in 2025 as platform licences and bot-authoring studios formed the entry point for most buyers. The services segment, however, is forecast to outpace software sales at 27.2% CAGR through 2031 as enterprises seek design thinking, change management and continuous-improvement expertise. Managed-service providers curate runbooks, monitor bot health and apply security patches, letting customers focus on core innovation. Advisory firms within the vendor ecosystem package process-mining diagnostics with hyper-automation blueprints, accelerating time to value without ballooning headcount. As complexity rises, service quality becomes a key differentiator, reinforcing ecosystem lock-in and boosting lifetime contract values across the Automation-as-a-Service market.
By Business Function: Revenue Operations Lead Momentum
IT operations captured 44.65% of Automation-as-a-Service market share in 2025, reflecting their historic stewardship of orchestration tools. Sales and marketing workloads, however, are scaling fastest at 26.6% CAGR as organisations streamline lead qualification, dynamic pricing and content personalisation. Customer-relationship-management data feeds bots that generate targeted offers, while AI classifiers route inquiries to the most qualified agents. Finance, HR and supply-chain teams follow closely, piloting payables matching, onboarding and inventory-replenishment scenarios. Cross-functional playbooks are emerging where a single process spans revenue, fulfillment and support, increasing demand for platforms that can enforce data consistency across silos. This breadth underscores the growing strategic relevance of the Automation-as-a-Service market within enterprise transformation roadmaps.
By Enterprise Size: SME Democratization
Large enterprises commanded 71.05% of 2025 spend, yet SMEs demonstrate stronger momentum at 26.9% CAGR thanks to consumption-based pricing and low-code design surfaces. Starter licences bundle connector packs, community templates and sandbox capacity, allowing small teams to pilot within days rather than quarters. Vendors also offer outcome-based service tiers where fees correlate with realised savings, reducing perceived risk. Although SMEs initially automate narrow tasks such as invoice capture or email triage, successful pilots often expand into multi-department programs. As this cohort matures, it will supply a diversified revenue stream that insulates the Automation-as-a-Service market from cyclicality in large-enterprise capex.
By End-User Vertical: BFSI Sets the Pace
Telecom and IT services held 22.55% of revenue in 2025, reflecting continuous network-management demands and established DevOps cultures. Banking, financial-services and insurance firms are projected to record a 26.3% CAGR as compliance reporting, fraud analytics and digital-onboarding workflows become automation priorities. Regulated audit trails favour platforms with immutable logs and granular role-based controls, nudging procurement decisions towards vendors that internalise governance capabilities. Healthcare providers automate prior-authorisation checks and clinical-coding tasks, while manufacturers target plant-floor inspections and quality dashboards. The breadth of industry use cases reinforces the universality of the Automation-as-a-Service market proposition and gives vendors multiple expansion vectors.
Geography Analysis
North America holds leadership with 38.15% revenue in 2025, supported by mature hyperscale data centres, a dense partner network and early platform adoption that spans finance, healthcare and public services. United States corporations deploy cognitive bots that reconcile data across ERP, CRM and vertical clouds, pushing platform utilisation rates above global averages. Canada accelerates public-sector use, while Mexico leverages automation to enhance near-shoring competitiveness in manufacturing.
Asia-Pacific registers the fastest growth at 26.4% CAGR through 2031. The ASEAN Digital Masterplan 2025 catalyses cross-border digital-service standards, spurring public-sector automation that quickly permeates private enterprises. China scales factory-floor robotics and city-administration bots, India modernises IT-service workflows, and Japan addresses labour shortages with conversational agents for elder-care. South Korea pilots 5G-enabled edge automations, while Australia focuses on mining-sector process efficiency.
Europe adopts a measured stance that balances innovation with rigorous data-protection oversight. GDPR and proposed AI-governance acts prompt demand for explainable workflows and built-in audit logs. Switzerland, Sweden and Germany exhibit the highest penetration rates, with banks and manufacturers integrating AI copilots into critical operations. Southern-European economies rely on EU funding for digitalisation, creating fresh bids for platform-as-a-service contracts. These dynamics keep the Automation-as-a-Service market resilient across varying macro-economic backdrops.


Regulatory Landscape
Automation-as-a-Service (AaaS) increasingly falls under horizontal AI governance regimes as platforms embed generative AI and autonomous-agent features into business process execution. In the European Union, the EU AI Act (Regulation (EU) 2024/1689) sets out a risk-based framework that raises expectations for governance documentation, transparency, and technical controls for higher-risk uses, which makes explainable workflows and audit-ready logs more central in automation stacks.
Outside the EU, governance requirements are still more fragmented, but they are tightening through standards and national frameworks that shape procurement. In the United States, the National Institute of Standards and Technology (NIST) AI Risk Management Framework (AI RMF) is commonly referenced as a governance baseline, and in 2026 NIST expanded work on risk management for critical infrastructure and continued developing standards for autonomous AI agents (identity, authentication, containment). In Asia, South Korea brought its AI Basic Act into effect in January 2026, adding another risk-based reference point for AaaS vendors selling into regulated enterprise and public-sector deployments where model governance, access controls, and incident response evidence are assessed during contract negotiations.
Value Chain Analysis
The Automation-as-a-Service value chain begins with foundational infrastructure and enabling technology, including hyperscale and hybrid cloud environments, identity and access controls, and data integration layers that connect enterprise applications and event streams. AaaS platform vendors then sit on top of this stack, providing process discovery and mining, low-code bot design studios, orchestration runtimes, and governance features such as policy controls and immutable audit logs. Generative-AI and agentic components, including reasoning models, tool calling, and guardrails, are increasingly incorporated as upstream inputs that expand automation coverage from rule-based tasks into unstructured workflows.
Downstream, systems integrators and managed service providers support implementation, connector development, change management, and day-2 operations, including monitoring bot health, patching, and compliance reporting, which is especially relevant for hybrid estates with legacy and on-prem systems. Enterprise buyers activate the chain through function-led use cases (IT operations, finance, HR, sales and marketing) and verticalized programs in regulated sectors. Recent ecosystem moves underscore the integration-heavy nature of the chain: Cognizant aligned with AWS (October 2024) for smart manufacturing delivery, NTT DATA entered a long-term collaboration with UPS (March 2025) to modernize infrastructure and apply AI and cloud services, and ServiceNow partnered with Aptiv (April 2025) to connect workflow automation with industrial and edge virtualization capabilities, reinforcing the role of partnerships in delivering end-to-end outcomes rather than standalone tools.
Competitive Landscape
The Automation-as-a-Service market is moderately fragmented, featuring specialist RPA leaders, cloud hyperscalers and emerging AI-native challengers. UiPath, Automation Anywhere and Blue Prism extend their suites with process-mining dashboards, while Microsoft and Google embed orchestration hooks inside productivity clouds. ServiceNow deepened its portfolio by acquiring Moveworks for USD 2.85 billion, folding conversational AI into workflow design and bringing an installed base of 1,000 AI customers under one umbrella. IBM, Oracle and Salesforce integrate automation layers with sector-specific data models, targeting regulated verticals that value policy-aware templates.
Open-source frameworks, headlined by Robot Framework and LangChain-based agent builders, lower entry barriers for niche vendors that specialise in language, regulation or hardware integration. Meanwhile, bot marketplaces reward third-party creators for publishing pre-certified components, adding long-tail use cases to platform catalogs and raising switching costs. Strategic alliances between platform providers and cybersecurity firms address rising concerns over insider risk and credential sprawl. Overall, competitive intensity is fuelling rapid feature convergence but also driving consolidation as scale efficiencies in model training and global support become decisive.
Automation-as-a-Service Industry Leaders
IBM Corporation
Microsoft Corporation
Automation Anywhere, Inc.
Blue Prism Group PLC
Uipath Inc.
- *Disclaimer: Major Players sorted in no particular order

Market Opportunities and Future Outlook
For AaaS providers, a key whitespace is packaging agentic automation with governance that addresses data residency, identity, and audit requirements, which helps regulated buyers scale beyond pilots. This direction is visible in product moves and adjacent platform launches: Cognizant introduced a Sovereign Physical AI Platform-as-a-Service in June 2026 to connect physical systems (IoT, robots, factory automation) to a central intelligence layer, aligning automation delivery with sovereignty and control needs. Separately, NIST activity in 2026 on autonomous AI agent standards (identity, authentication, containment) reinforces buyer attention on agent-level controls that can be embedded into AaaS operating models.
Another opportunity is the expansion of subscription-based automation beyond back-office into industrial and operational environments through modernization-as-a-service bundles that reduce disruption risk. Schneider Electric launched Industrial Automation Modernization as a Service in June 2026 using HPE SimpliVity infrastructure, highlighting demand for service-led modernization that keeps production running while shifting automation toward software-defined operations. As orchestration moves from IT workflows into plant, logistics, and edge contexts, offerings that combine domain templates, managed operations, and hybrid deployment options can serve as a practical onramp for enterprises seeking unified automation across both digital processes and operational systems.
Recent Industry Developments
- June 2026: IBM introduced IBM Cloud Pak for Business Automation 26.0, adding AI agent and generative-AI capabilities across its automation portfolio. The release strengthens IBM’s position in subscription-led automation by pushing agentic features into a governed, enterprise automation stack that enterprises already run in hybrid environments.
- November 2025: Automation Anywhere acquired Aisera, expanding its footprint in self-service agents for IT service management, HR, and customer service. The deal broadened Automation Anywhere’s catalog of prebuilt, conversational automation entry points that can be operationalized under an Automation-as-a-Service delivery model.
- September 2024: The United Nations E-Government Survey highlighted the role of AI in progressing Sustainable Development Goals and reported improved e-government development metrics across member states. Public-sector digitization priorities support procurement of workflow automation and orchestration platforms, which then spill over into broader enterprise adoption through shared cloud and integration ecosystems.


Research Methodology Framework and Report Scope
Market Definition and Coverage
This market is defined as the revenue earned from delivering business automation capabilities as an ongoing service, where customers pay through subscription or usage models for software-led automation and related enablement.
Scope exclusions: This sizing excludes perpetual automation software licenses, one-time custom integration projects, and hardware-led robotic systems sold as products.
Segmentation Overview
- By Deployment Type
- On-premise
- Cloud
- By Component
- Solution
- Services
- By Business Function
- Information Technology
- Finance and Accounting
- Human Resources
- Sales and Marketing
- Operations / Supply-Chain
- By Enterprise Size
- Large Enterprises
- Small and Medium Enterprises (SMEs)
- By End-user Vertical
- BFSI
- Telecom and IT
- Retail and Consumer Goods
- Healthcare and Life Sciences
- Manufacturing
- Government and Public Sector
- Other End-user Verticals
- Geography
- North America
- United States
- Canada
- Mexico
- Europe
- Germany
- United Kingdom
- France
- Italy
- Spain
- Rest of Europe
- Asia-Pacific
- China
- Japan
- India
- South Korea
- Australia and New Zealand
- Rest of Asia-Pacific
- South America
- Brazil
- Argentina
- Rest of South America
- Middle East and Africa
- Middle East
- Saudi Arabia
- United Arab Emirates
- Turkey
- Rest of Middle East
- Africa
- South Africa
- Egypt
- Nigeria
- Rest of Africa
- Middle East
- North America
Data Sources, Market Sizing, and Validation
Desk Research
Desk work starts by mapping what a buyer actually pays for in an automation-as-a-service contract, and how that differs from license-only automation purchases. Public sources are used to build the demand backdrop and pricing logic, such as the US Bureau of Labor Statistics for wage pressure indicators, the US Census Bureau for business counts by size, and the World Bank for macro and digital readiness context.
We also review sources such as OECD digital economy statistics, the US National Institute of Standards and Technology guidance that shapes security and governance expectations, and peer-reviewed journals that track automation adoption patterns. Company filings, earnings call transcripts, and investor presentations help capture how recurring automation revenues are discussed, including how packaging is evolving. Where needed, a paid subscription covering company financials and news, plus a patent database, is used to verify product direction and commercialization signals. These sources are illustrative only, and many other public documents were also reviewed to collect, cross-check, and clarify data points.
Primary Interviews and Surveys
Primary work is used to pressure-test what is counted as automation-as-a-service revenue, how usage-based pricing is applied in practice, and how deal mix varies by enterprise size and vertical. We speak with supply-side leaders, implementation and managed service practitioners, and enterprise buyers who own automation roadmaps, and then align adoption assumptions across APAC, EMEA, and the Americas.
Distribution of primary research fieldwork respondents
| Company type | Respondent position | Region |
|---|---|---|
| Top tier: 31% | CXOs: 12% | APAC: 43% |
| Mid tier: 48% | Functional/Unit leaders: 29% | EMEA: 35% |
| Smaller Players: 21% | Managers: 59% | Americas: 22% |
Market-Sizing & Forecasting
Sizing is built using a top-down approach where enterprise automation spend pools are reconstructed from the intersection of addressable business processes, automation adoption rates, and recurring pricing models by region and industry. To keep totals realistic, we corroborate outputs with selective bottom-up checks, such as sampled average contract values, channel feedback on usage tiers, and supplier revenue roll-ups for service-led automation lines, and then adjust for overlap.
Key inputs include enterprise counts by size band, automation penetration within target functions (such as IT operations and finance), average bots or workflows per deployed program, typical subscription versus consumption mix, and cloud versus on-prem deployment shares because they influence price realization. Forecasts lean on scenario analysis supported by a light multivariate regression view, where assumptions for labor cost inflation, cloud adoption, and compliance-driven automation demand are validated through expert feedback. When bottom-up signals are missing in smaller geographies, the gaps are handled through proxy ratios tied to enterprise density and observed adoption pacing, followed by a review so the outputs still stay explainable and repeatable.
Data Validation & Update Cycle
Validation is done by triangulating model outputs against independent signals, including recurring software revenue disclosures, hiring trends for automation roles, and regional cloud and IT spend direction. If a number looks off, the drivers are rechecked, outliers are challenged, and interview follow-ups are triggered to confirm whether the variance is real or caused by a scope mismatch.
Before sign-off, the model goes through multi-step analyst reviews, where assumptions, unit economics, and currency conversions are revalidated and calculation logic is re-run. Reports are refreshed annually, and interim updates are made when material events change pricing or adoption patterns. Right before delivery, a final pass is completed so clients receive the most current view consistent with the defined scope.
Mordor Intelligence's Automation As A Service Market Size Compared With Other Published Estimates
Published market sizes for automation as a service can look far apart, even when they sound like they are covering the same topic. In most cases, the gap comes from how each publisher treats licensing versus service revenue, what they assume for usage-based pricing, and how frequently they refresh the starting-year inputs.
Perpetual RPA license revenues sit outside Mordor Intelligence's scope for this market, which is a key reason the 2026 total differs from estimates that blend license-led automation with recurring service delivery. Differences also show up when sources apply aggressive adoption curves for small and mid-sized enterprises, or when they extend the definition to include one-off integration work that is not contracted as an ongoing service. Currency timing and the chosen base year can widen spreads further, especially when pricing is assumed to rise quickly with AI-enabled automation features.
Benchmark comparison
| Source | Market Size | Gaps in Research Methodology |
|---|---|---|
| Mordor Intelligence | USD 12.78 B (2026) | |
| Global Consultancy A | USD 11.40 B (2025) | Uses a different base year and a longer forecast window, and the scope description is broader across functions and verticals, which can shift the starting demand pool versus a 2026 anchored model. |
| Industry Publisher B | USD 2.98 B (2026) | Appears to apply a tighter monetization view for service revenue, which can undercount platform subscriptions and higher-tier consumption pricing commonly seen in large enterprise deployments. |
The comparison shows that base-year choice, what gets counted as recurring service revenue, and how fast adoption and pricing are allowed to move are the practical drivers of the spread. By tying the model to a defined recurring spend pool and then checking it with supplier and buyer inputs, we keep the market value traceable to clear variables that can be re-tested each update cycle.


Key Questions Answered in the Report
What is the current valuation of the Automation-as-a-Service market?
The market is valued at USD 12.78 billion in 2026 and is projected to expand to USD 40.4 billion by 2031.
Which region contributes the most revenue?
North America leads with 38.15% of 2025 revenue thanks to mature cloud infrastructure and early enterprise adoption.
Which deployment model is growing fastest?
Cloud deployments are advancing at a 27.3% CAGR as organisations prioritise scalability and lower infrastructure overhead.
Which business function shows the highest growth?
Sales and marketing workflows represent the fastest-growing segment with a 26.6% CAGR, driven by revenue-operations automation.
How does pricing influence SME adoption?
Subscription and usage-based billing lowers upfront costs, allowing SMEs to adopt enterprise-grade automation and grow at a 26.9% CAGR.
Page last updated on:


