Live Chat Software Market Size and Share
Market Overview
| Study Period | 2019 - 2030 |
|---|---|
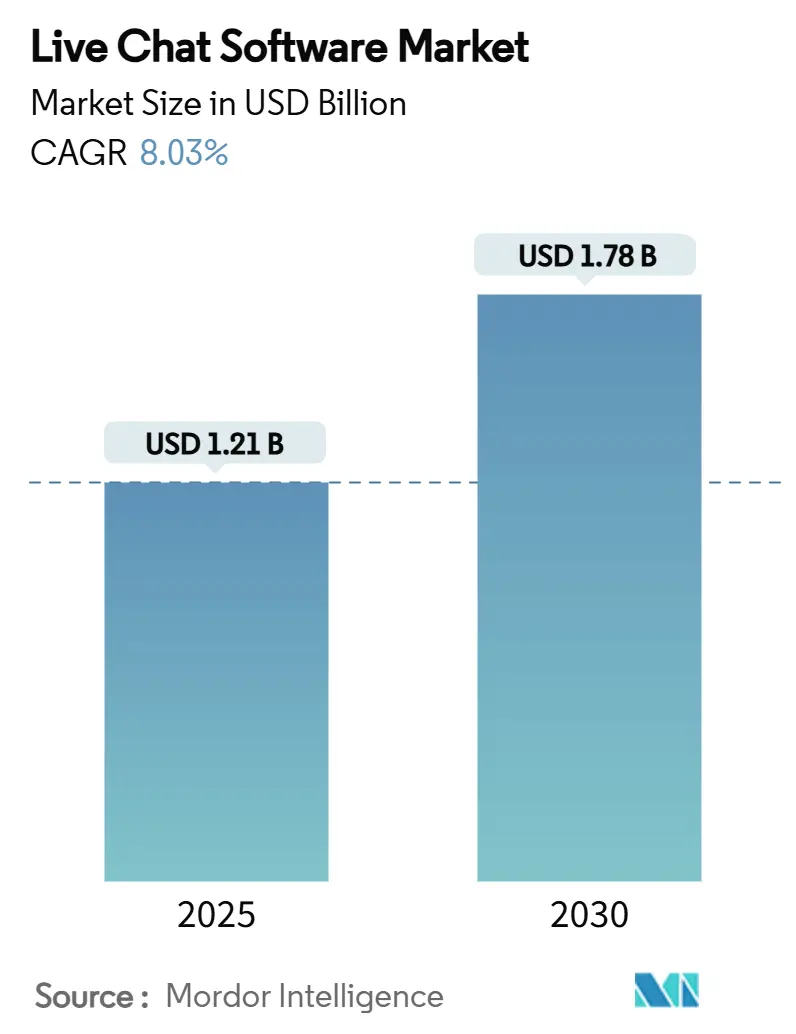
| Market Size (2025) | USD 1.21 Billion |
| Market Size (2030) | USD 1.78 Billion |
| Growth Rate (2025 - 2030) | 8.03% CAGR |
| Fastest Growing Market | Asia Pacific |
| Largest Market | North America |
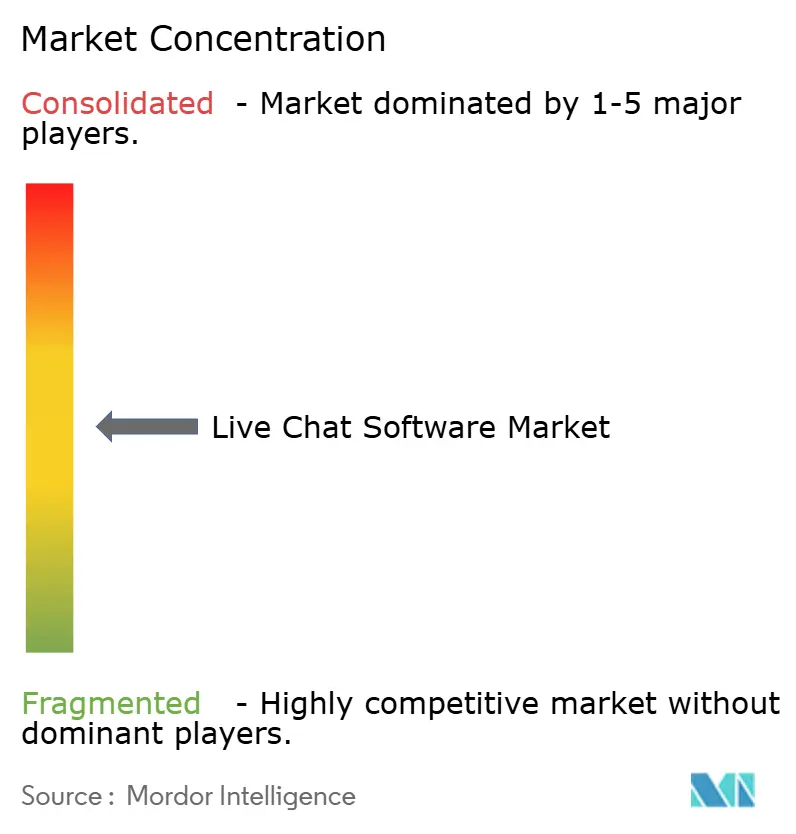
| Market Concentration | Medium |
Major Players *Disclaimer: Major Players sorted in no particular order Image © Mordor Intelligence. Reuse requires attribution under CC BY 4.0. | |
Live Chat Software Market Analysis by Mordor Intelligence
The live chat software market size stands at USD 1.21 billion in 2025 and is forecast to reach USD 1.78 billion by 2030, reflecting an 8.03% CAGR through the period. Rapid conversion of voice-centric contact centers into digital-first engagement hubs, the falling per-interaction cost of AI chatbots, and the rising share of smartphone traffic are the headline forces behind this expansion. Enterprises now treat live chat as a revenue accelerator rather than a cost center, especially in retail, where every real-time interaction shortens the path to purchase. Cloud deployment, mobile accessibility, and generative-AI augmentation together form the structural bedrock of today’s investment decisions. Finally, public-sector digital-service mandates in Japan, the United Kingdom, and several EU states further widen addressable demand as governments adopt chat for citizen support.
Key Report Takeaways
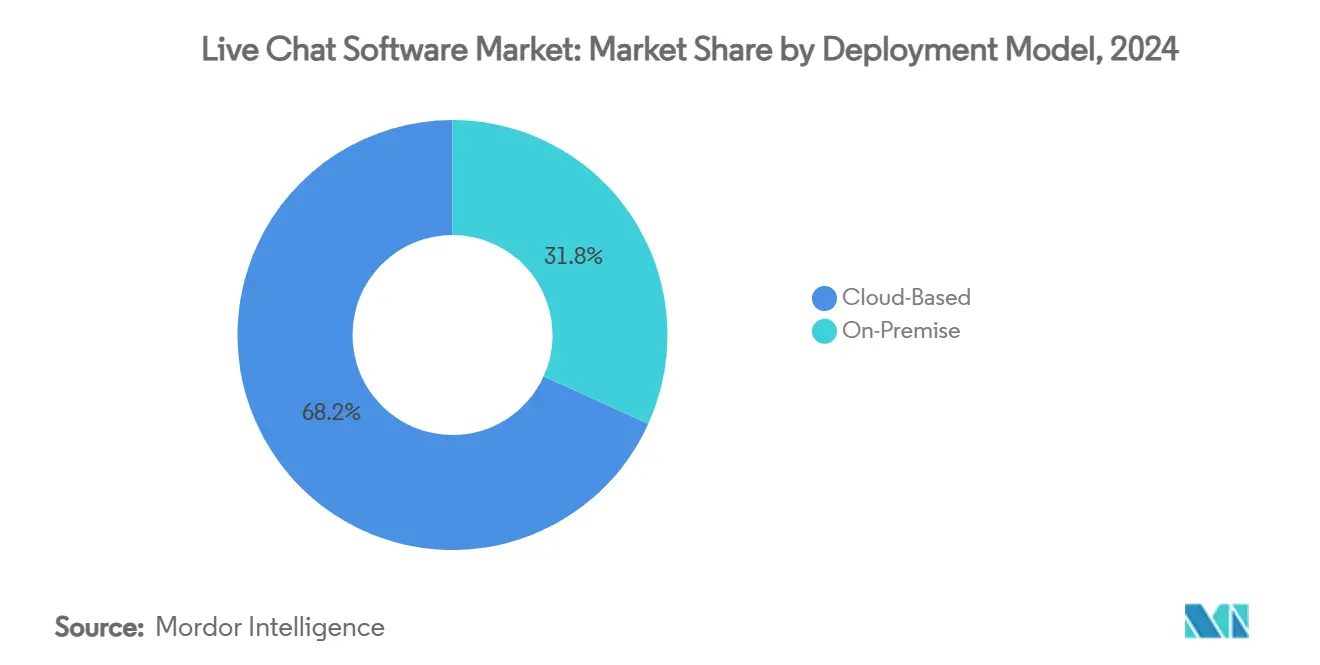
- By deployment model, cloud-based solutions held 68.23% of live chat software market share in 2024; on-premise grows at 3.2% CAGR under strict data-sovereignty niches.
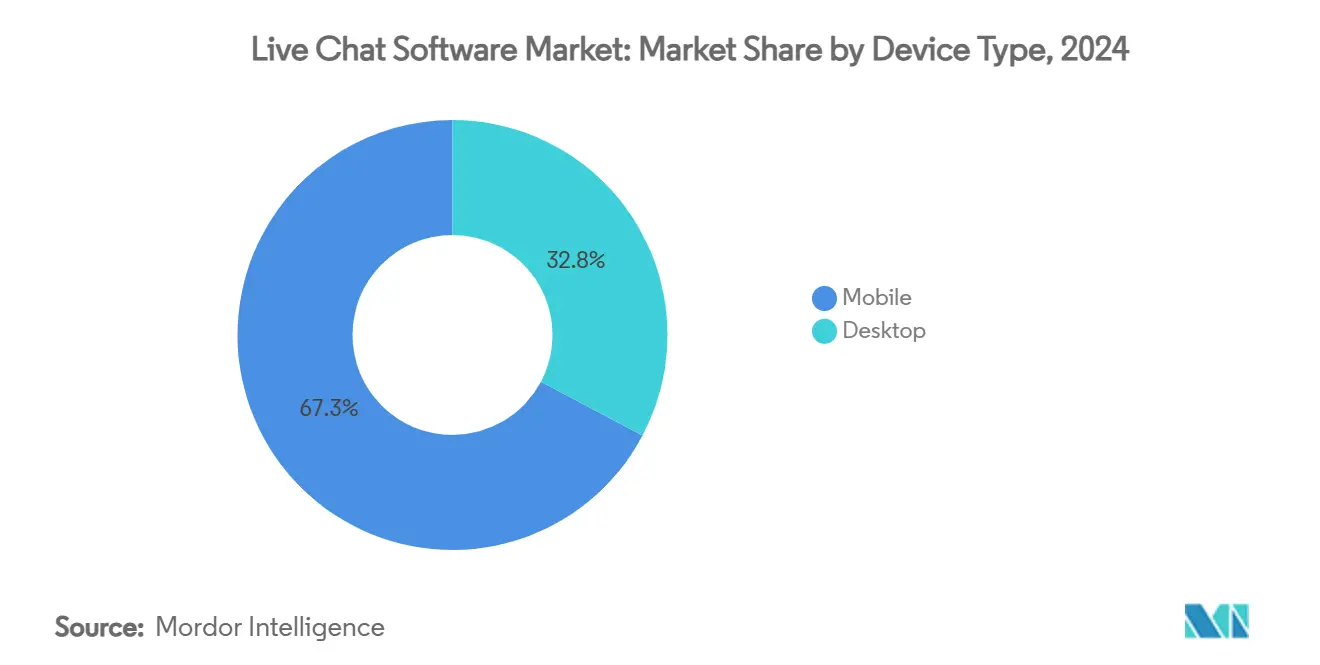
- By device type, mobile commanded 67.25% share of the live chat software market size in 2024 and is projected to expand at a 13.05% CAGR through 2030.
- By product type, customer-service chat systems captured 39.71% revenue share in 2024, while sales chat systems advance at a 12.25% CAGR to 2030.
- By end-user industry, retail and e-commerce held 28.37% share of the live chat software market size in 2024; healthcare records the fastest CAGR at 13.87% on HIPAA-compliant adoption.
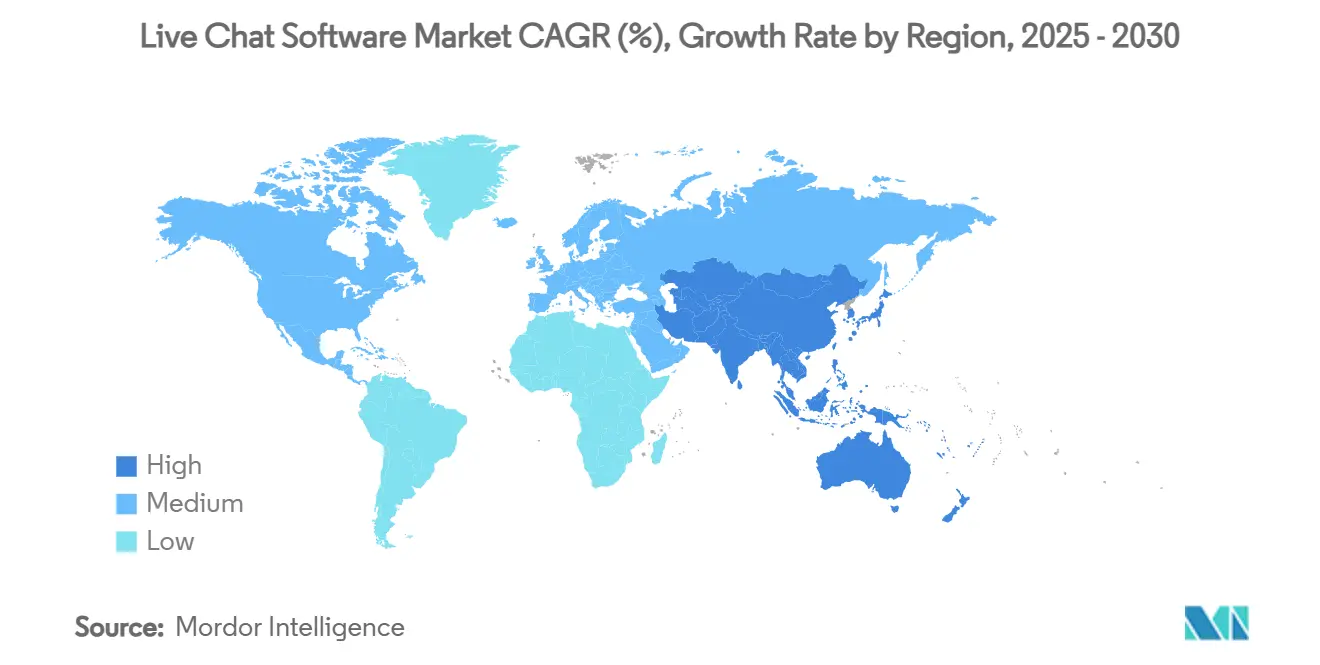
- By geography, North America accounted for 33.81% of live chat software market share in 2024, whereas Asia-Pacific posts a 12.32% CAGR through 2030.
Global Live Chat Software Market Trends and Insights
Drivers Impact Analysis*
| Driver | (~) % Impact on CAGR Forecast | Geographic Relevance | Impact Timeline |
|---|---|---|---|
| Surging e-commerce adoption and 24/7 customer-support expectations | +2.1% | Global, with concentration in North America & APAC | Short term (≤ 2 years) |
| Rapid integration of live chat into omnichannel CX and CRM suites | +1.8% | North America & EU, expanding to APAC | Medium term (2-4 years) |
| Shift toward cloud-native contact centers in SMEs worldwide | +1.5% | Global, led by North America and Europe | Medium term (2-4 years) |
| Generative-AI powered chat boosting agent productivity | +1.4% | North America & EU core, spill-over to APAC | Short term (≤ 2 years) |
| Energy-saving “green CX” mandates favoring chat over voice channels | +0.8% | EU leading, North America following | Long term (≥ 4 years) |
| Public-sector digital-service initiatives mandating real-time citizen chat | +0.7% | APAC core, EU and North America adoption | Medium term (2-4 years) |
| Source: Mordor Intelligence | |||
Surging E-commerce Adoption and 24/7 Support Expectations
Retailers now view live chat as a direct conversion lever. Sephora’s rollout lifted average order value 25% after deploying proactive chat prompts.[1]LiveChat, “Sephora Uses LiveChat to Increase Average Order Value,” livechat.com Footwear brand Nine West registered a 15% jump in conversion while simultaneously cutting email and phone backlog.[2]Retail TouchPoints, “Nine West Sees 15% Lift in Conversions,” retailtouchpoints.com As mobile commerce scales, 67.25% of chat interactions originate on smartphones, pushing vendors to perfect responsive interfaces. With asynchronous shopping journeys spanning time zones, businesses unable to maintain round-the-clock digital support watch dissatisfied visitors slip to rivals. Consequently, 24/7 availability is now a table-stakes requirement embedded into budget cycles across retail, travel, and subscription commerce.
Rapid Integration of Live Chat into Omnichannel CX and CRM Suites
Platform consolidation is accelerating. Salesforce closed more than 200 Agent Force deals within one quarter by embedding AI chat inside core CRM workflows.[3]Retail TouchPoints, “Nine West Sees 15% Lift in Conversions,” retailtouchpoints.com HubSpot’s suite strategy produced 20% revenue growth on the back of cross-channel customer-data unification. When email, voice, social messaging, and chat run on a single data fabric, enterprises unlock holistic lifetime-value algorithms instead of siloed ticket metrics. This momentum drives procurement teams to bundle live chat inside broader CX renewals rather than fund standalone pilots.
Shift Toward Cloud-Native Contact Centers in SMEs Worldwide
Capital-light operating models remain irresistible for resource-constrained businesses. Cloud-based live chat already represents 68.23% revenue share and is climbing at 11.82% CAGR. Avaya’s decision to sunset small-seat public-cloud support by mid-2025 triggered a migration surge to newer cloud specialists. Techaisle’s survey shows 84% of SMEs now ranking customer experience as their top IT objective, with 76% running some contact-center functionality already. Lower total cost of ownership, elastic seat licensing, and automatic feature updates secure cloud’s edge over on-premise in every new business-case review.
Generative-AI Powered Chat Boosting Agent Productivity
Operational math is transforming. An AI chatbot session costs USD 0.50–0.70 versus USD 8–15 for a live agent touch, saving roughly 30–40% per interaction. LiveHelpNow’s Hue agent trims chat durations 80% while preserving CSAT through recommended replies. Zendesk’s annual benchmark links AI adoption with 33% higher acquisition and 49% cross-sell uplift. As generative models learn from millions of historical dialogues, frontline capacity scales without proportional payroll growth, turning AI readiness into a differentiator during RFP evaluations.
Restraints Impact Analysis*
| Restraint | (~) % Impact on CAGR Forecast | Geographic Relevance | Impact Timeline |
|---|---|---|---|
| Escalating data-privacy and cross-border compliance risks (GDPR, DPAs) | -1.2% | EU leading, global expansion | Short term (≤ 2 years) |
| Talent shortage in conversational-design and bot-training skillsets | -0.9% | Global, acute in North America & EU | Medium term (2-4 years) |
| Vendor lock-in concerns with proprietary chat ecosystems | -0.7% | North America & EU, expanding to APAC | Medium term (2-4 years) |
| Accessibility regulations (WCAG 3.0) raising retrofit costs | -0.6% | North America & EU core, selective APAC adoption | Long term (≥ 4 years) |
| Source: Mordor Intelligence | |||
Escalating Data-Privacy and Cross-Border Compliance Risks
GDPR, state-level privacy acts, and sector-specific rules put encryption, consent logging, and auto-deletion at the center of product roadmaps. HIPAA-grade deployments require segregated data stores and auditable activity logs, adding cost layers that small providers struggle to absorb. Compliance diligence influences vendor shortlists ahead of feature comparisons, making legal readiness a decisive sales factor. Non-adherence invites regulatory penalties and brand-damage risk, shaving an estimated 1.2 percentage points from the five-year CAGR outlook.
Talent Shortage in Conversational-Design and Bot-Training Skillsets
Live chat excellence depends on dialogue flows that anticipate intent and context. Yet the market lacks enough linguists, UX writers, and domain specialists to train emerging models. Financial-services and healthcare buyers compete for scarce designers fluent in regulatory vernacular. Implementation schedules stretch, while service providers raise fee structures to cover premium labor. Until formal academic pipelines mature, the skills gap dampens speed-to-value for AI chat projects, subtracting 0.9 percentage point from forecast growth.
*Our forecasts treat driver/restraint impacts as directional, not additive. The impact forecasts reflect baseline growth, mix effects, and variable interactions.
Segment Analysis
By Deployment Model: Cloud Dominance Accelerates SME Migration
Cloud deployments captured 68.23% of live chat software market share in 2024, expanding at 11.82% CAGR through 2030 as SMEs pivot away from capex-heavy infrastructure. The live chat software market size attached to cloud contracts is set to widen from USD 0.83 billion in 2025 to USD 1.44 billion by 2030, according to internal estimates. Avaya’s withdrawal from small-seat public-cloud support sharpened urgency among resource-constrained contact centers to re-platform, driving volume toward next-generation SaaS vendors.
Legacy on-premise installations remain vital in governments and financial institutions requiring sovereignty over citizen or transaction data. However, forward investment tilts toward hybrid setups where sensitive data rests on private nodes while AI augmentation runs in public clouds. Case studies such as Falck’s emergency-services migration to Genesys Cloud illustrate the resilience and disaster-recovery gains realized once telephony, chat, and workforce management converge in a single multitenant platform.


By Product Type: Customer-Service Systems Lead Revenue Generation
Customer-service chat systems own 39.71% sales contribution, reflecting historical deployment patterns that prioritize ticket deflection. These solutions handle high-frequency “where-is-my-order” inquiries with automated workflows and knowledge-base lookup. The live chat software market size for customer-service modules is projected to reach USD 0.70 billion by 2030.
Sales chat software, while smaller, rises at 12.25% CAGR as e-commerce operators adopt AI to personalize upsell prompts during browse sessions. This segment’s live chat software market share climbs steadily in sectors with high cart-abandonment sensitivity such as fashion and consumer electronics. Informational chat—often deployed on public-sector portals—acts as the entry layer for citizen FAQs, funneling complex requests to human agents under strict service-level targets.
By Device Type: Mobile-First Strategy Drives Innovation
Mobile captured 67.25% usage share in 2024 and is on course for a 13.05% CAGR, underscoring the transition to handheld-centric customer engagement. As more sessions begin on social apps and SMS, brands embed SDK-based chat into native apps to preserve context across authentication checkpoints. The live chat software market size tied to mobile is forecast to surpass USD 1.1 billion by 2030.
Desktop chat still caters to enterprise purchases and B2B support where documents and screen-sharing matter. Yet its share will erode as enterprises refine responsive layouts and progressive-web-app strategies to replicate form-fill depth on mobile. Agents adjust tone and cadence to suit shorter, emoji-friendly exchanges typical on phones, reinforcing specialized training tracks within contact-center curricula.
By End-User Industry: Healthcare Emerges as High-Growth Opportunity
Retail and e-commerce held 28.37% contribution in 2024, having already hard-wired chat into conversion funnels. Future upgrades revolve around predictive assistance that nudges customers toward higher-margin bundles. Healthcare, however, jumps ahead with a 13.87% CAGR between 2025 and 2030. HIPAA-ready vendors such as TeamSupport gain favor as telehealth providers mandate encrypted chat within virtual-care pathways.
Banking deploys AI powers for balance inquiries and real-time fraud alerts, balancing customer delight with compliance. Travel operators leverage chat for flight rebooking and itinerary updates during disruptions. Information-technology and telecom firms rely on conversational diagnostics to speed trouble-ticket triage. Each vertical’s roadmap speaks to its unique regulation, margin, and customer-lifecycle profile, informing specialized intent libraries and connectors.
Geography Analysis
North America maintained 33.81% live chat software market share in 2024 on the back of early CRM adoption and mature e-commerce ecosystems. Salesforce’s Agent Force penetration and LivePerson’s revenue scale highlight a clustered vendor landscape where platform breadth often trumps point-solution depth. Regional growth moderates as penetration matures, yet budget reallocation toward AI enrichment keeps revenue on a stable upward curve.
Asia-Pacific represents the highest growth trajectory at a 12.32% CAGR, fueled by state-backed digital-government programs and fast-growing online retail bases. Japan’s Digital Agency proved public-sector viability, scoring > 90% user-satisfaction across generative-AI pilots. Chinese banks deploying DeepSeek language models report meaningful productivity gains in contract vetting and valuation. Smartphone penetration, coupled with social-commerce practices, accelerates chat adoption among SMEs with limited legacy infrastructure.
Europe grows steadily under strict GDPR and emergent WCAG 3.0 accessibility rules. Providers differentiate on compliance toolkits that automate consent capture and data-retention policies. Energy-conscious firms find chat’s lower carbon footprint attractive as corporate-sustainability reporting drives board-level KPIs. South America, the Middle East, and Africa, though currently modest in size, gain momentum as mobile-wallet adoption and cross-border e-commerce expand the serviceable universe.

Competitive Landscape
The market remains moderately fragmented. LivePerson generated moderate revenue in 2024 yet endured a 24% year-on-year decline as large buyers consolidated suppliers. HubSpot’s CX suite recorded 20% growth on AI-first bundling, signaling platform economics that reward integrated data clouds.
AI-native entrants such as LiveX claim 88% self-resolution and 35% churn reduction, illustrating disruptive automation potential that appeals to lean digital brands. Five9 surpassed USD 1 billion revenue for the first time, propelled by 46% enterprise AI growth and a deep partnership ecosystem. Strategy bifurcates into consolidation plays—where established suites lock clients into end-to-end CX clouds—and vertical-specialist plays, where newcomers optimize domain language models for regulated industries. Barriers hinge on training-data ownership, compliance certifications, and API openness rather than core messaging functionality.
White-space remains in public-sector extensions, accessible-design accelerators, and low-code bot-builder interfaces that democratize AI training. M&A talk centers on analytics vendors capable of turning chat transcripts into purchase-propensity scores, highlighting the growing premium placed on value-added insights over basic routing.
Live Chat Software Industry Leaders
LivePerson, Inc.
Zendesk, Inc.
GoTo Technologies USA, Inc.
Intercom, Inc.
Freshworks Inc.
- *Disclaimer: Major Players sorted in no particular order

Recent Industry Developments
- July 2025: SDT Corporation began full production of a generative-AI chatbot for child-rearing inquiries in Beppu City, Japan, enabling 24/7 citizen self-service through the Panorama AI platform. The move strengthens SDT’s municipal footprint and showcases use-case depth beyond classic FAQs.
- June 2025: Dai Nippon Printing (DNP) unveiled “DNP AI職員提供サービス,” which structures public documents with proprietary AI to deliver multilingual, always-on support for local governments and trim manual workload by up to 50%.
- May 2025: Freshworks posted USD 196.3 million Q1 revenue, climbing 19% year on year as over 1,000 new customers adopted its AI-augmented CX offerings; management credits expanding enterprise cohorts and operational leverage for a 24% non-GAAP margin.
- March 2025: LivePerson issued USD 50 million in first-lien convertible senior notes to Lynrock Lake, earmarking proceeds for AI research and balance-sheet fortification during revenue transition to platform subscriptions.


Global Live Chat Software Market Report Scope
| Cloud-Based |
| On-Premise |
| Customer Service Live Chat Systems |
| Informational Live Chat Systems |
| Sales Live Chat Systems |
| Desktop |
| Mobile |
| Retail and E-commerce |
| Travel and Hospitality |
| BFSI |
| Healthcare |
| IT and Telecom |
| Other End-user Industries |
| North America | United States | |
| Canada | ||
| Mexico | ||
| Europe | Germany | |
| United Kingdom | ||
| France | ||
| Italy | ||
| Spain | ||
| Russia | ||
| Rest of Europe | ||
| Asia-Pacific | China | |
| Japan | ||
| South Korea | ||
| India | ||
| Australia | ||
| Rest of Asia-Pacific | ||
| South America | Brazil | |
| Argentina | ||
| Chile | ||
| Colombia | ||
| Rest of South America | ||
| Middle East and Africa | Middle East | Saudi Arabia |
| United Arab Emirates | ||
| Turkey | ||
| Rest of Middle East | ||
| Africa | South Africa | |
| Nigeria | ||
| Kenya | ||
| Rest of Africa | ||
| By Deployment Model | Cloud-Based | ||
| On-Premise | |||
| By Product Type | Customer Service Live Chat Systems | ||
| Informational Live Chat Systems | |||
| Sales Live Chat Systems | |||
| By Device Type | Desktop | ||
| Mobile | |||
| By End-User Industry | Retail and E-commerce | ||
| Travel and Hospitality | |||
| BFSI | |||
| Healthcare | |||
| IT and Telecom | |||
| Other End-user Industries | |||
| By Geography | North America | United States | |
| Canada | |||
| Mexico | |||
| Europe | Germany | ||
| United Kingdom | |||
| France | |||
| Italy | |||
| Spain | |||
| Russia | |||
| Rest of Europe | |||
| Asia-Pacific | China | ||
| Japan | |||
| South Korea | |||
| India | |||
| Australia | |||
| Rest of Asia-Pacific | |||
| South America | Brazil | ||
| Argentina | |||
| Chile | |||
| Colombia | |||
| Rest of South America | |||
| Middle East and Africa | Middle East | Saudi Arabia | |
| United Arab Emirates | |||
| Turkey | |||
| Rest of Middle East | |||
| Africa | South Africa | ||
| Nigeria | |||
| Kenya | |||
| Rest of Africa | |||


Key Questions Answered in the Report
How fast is the live chat software market growing through 2030?
The global market advances at an 8.03% CAGR, expanding from USD 1.21 billion in 2025 to USD 1.78 billion by 2030.
Which deployment model attracts the most spending?
Cloud-based solutions command 68.23% revenue share in 2024 and continue to outpace on-premise with an 11.82% CAGR through 2030.
What vertical shows the strongest future momentum for chat adoption?
Healthcare leads with a 13.87% CAGR as telemedicine and HIPAA compliance accelerate the need for secure real-time patient engagement.
Why are generative-AI capabilities considered critical in new chat projects?
AI chat lowers per-interaction costs by roughly 30–40% while driving higher conversion and cross-sell metrics, delivering measurable ROI and scalability.
Which region represents the fastest market expansion?
Asia-Pacific records a 12.32% CAGR through 2030, propelled by government digital-service mandates and surging mobile e-commerce activity.
How do AI chatbots compare with live agents on cost per interaction?
AI sessions cost about USD 0.50–0.70 versus USD 8–15 for a human touch, saving 30–40% on operating expense.
Page last updated on:


