
Technology, Media and Telecom
5th MayPricing Strategy for Semiconductor Components
3 Min Read
The Service Delivery Automation Market Report Segments the Industry Into by Type (IT Process Automation, Business Process Automation, and More), Component (Software Platforms, and Services), Deployment Mode (On-Premise, and Cloud), Organization Size (Large Enterprises, and Small and Medium Enterprises), End-User Industry (BFSI, Information Technology Services, Telecommunications and Media, and More), and Geography.
Market Overview
| Study Period | 2020 - 2031 |
|---|---|
| Market Size (2026) | USD 49.31 Billion |
| Market Size (2031) | USD 159.27 Billion |
| Growth Rate (2026 - 2031) | 26.43 % CAGR |
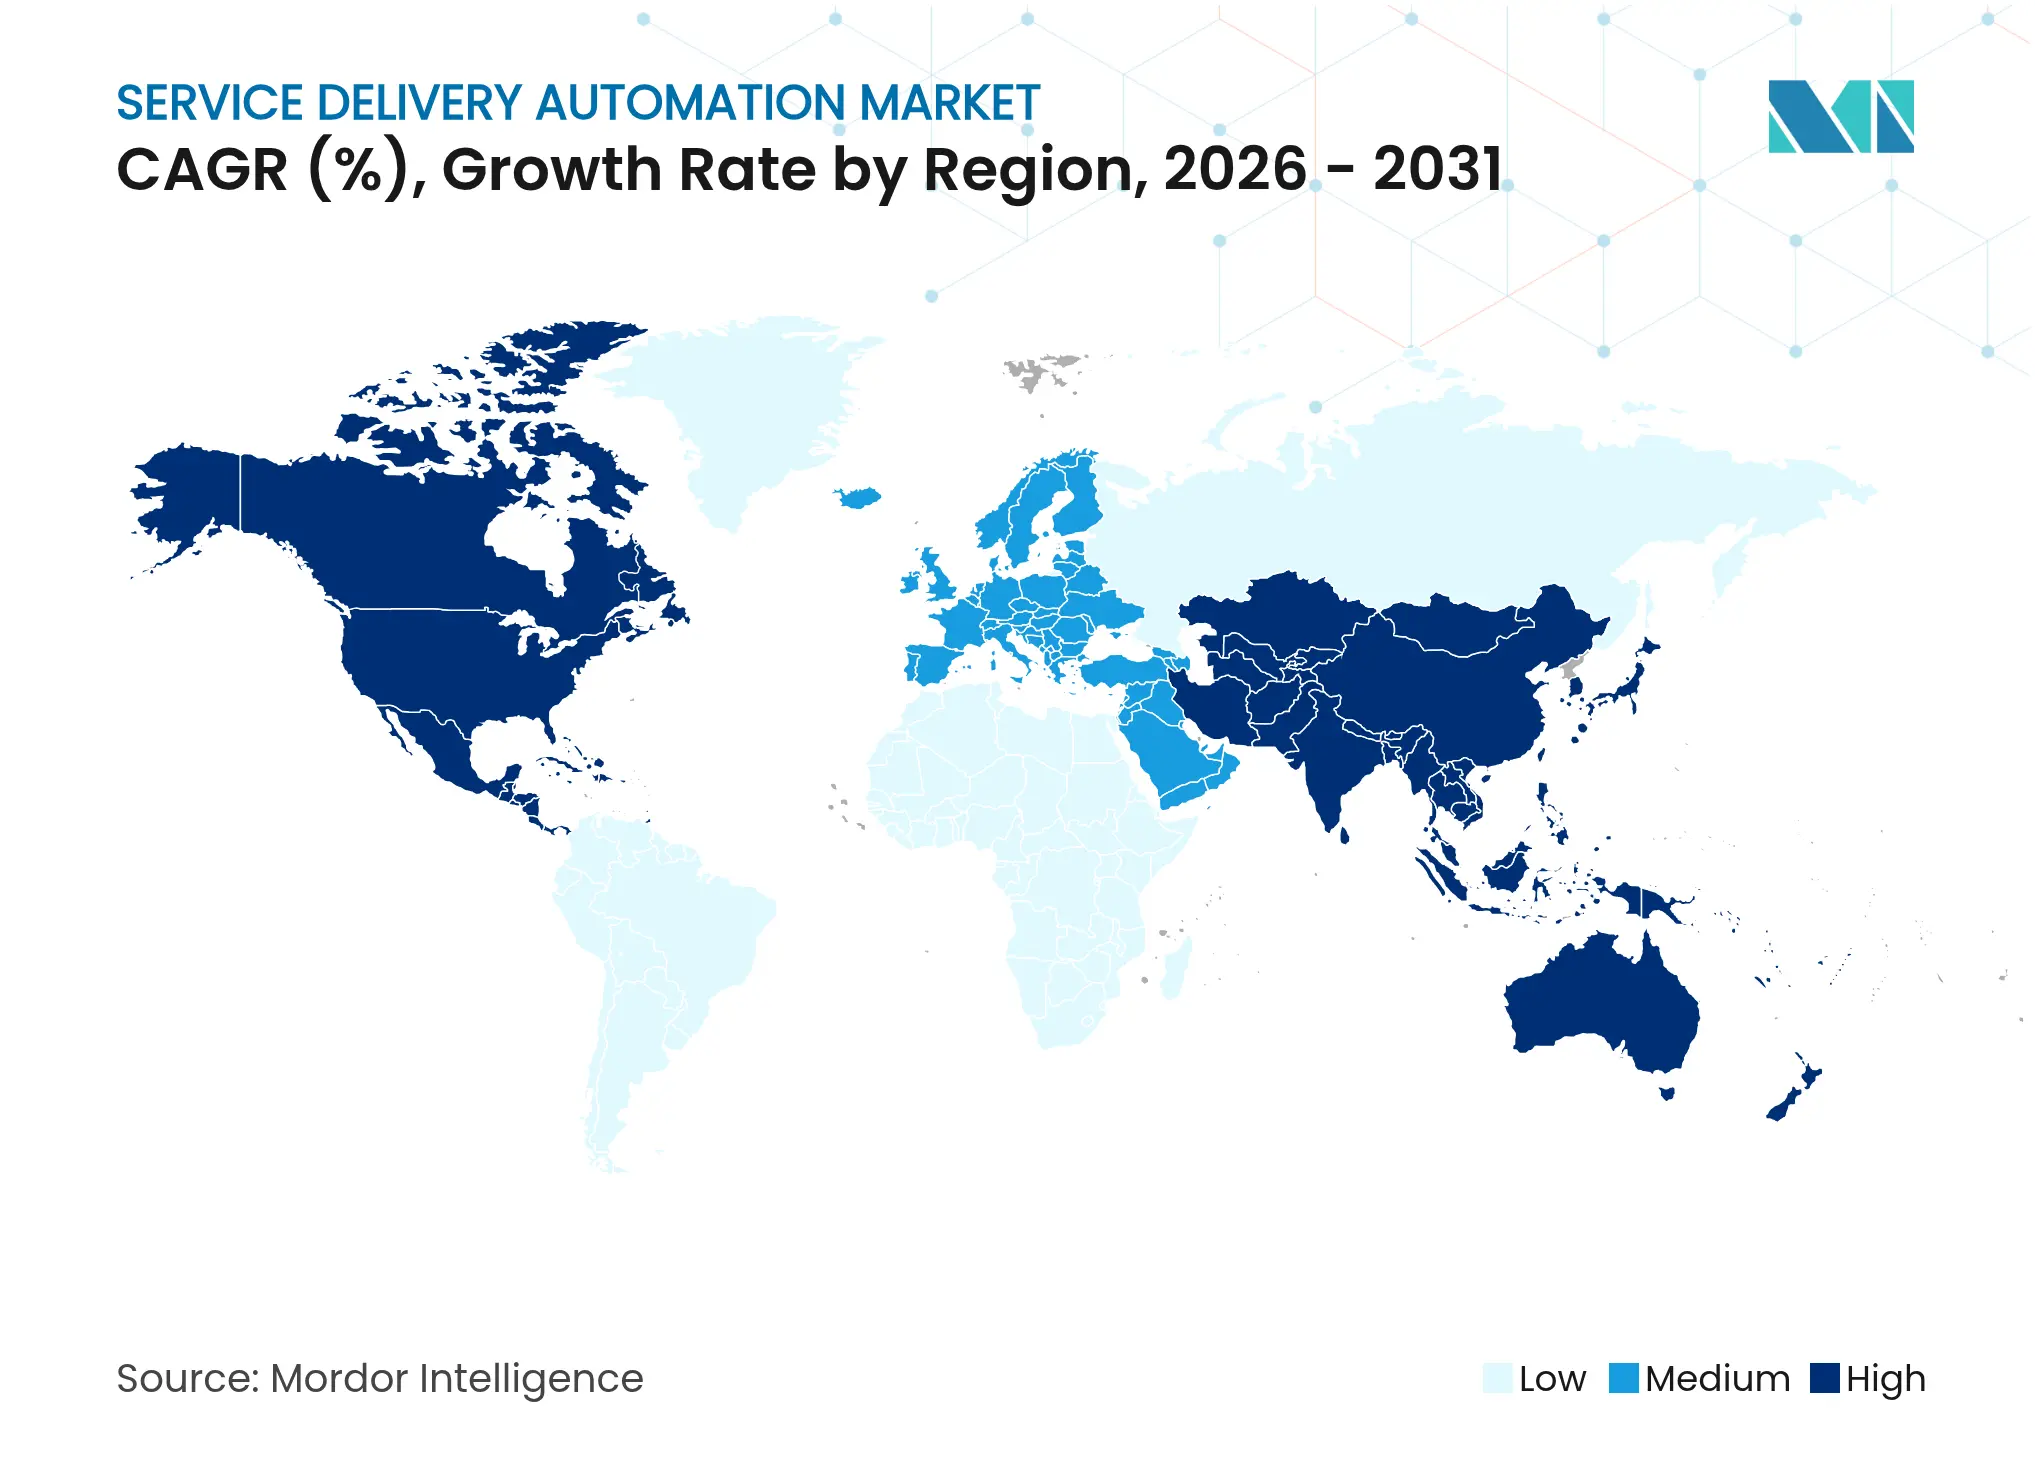
| Fastest Growing Market | Asia Pacific |
| Largest Market | North America |
| Market Concentration | High |
Major Players *Disclaimer: Major Players sorted in no particular order. Image © Mordor Intelligence. Reuse requires attribution under CC BY 4.0. |
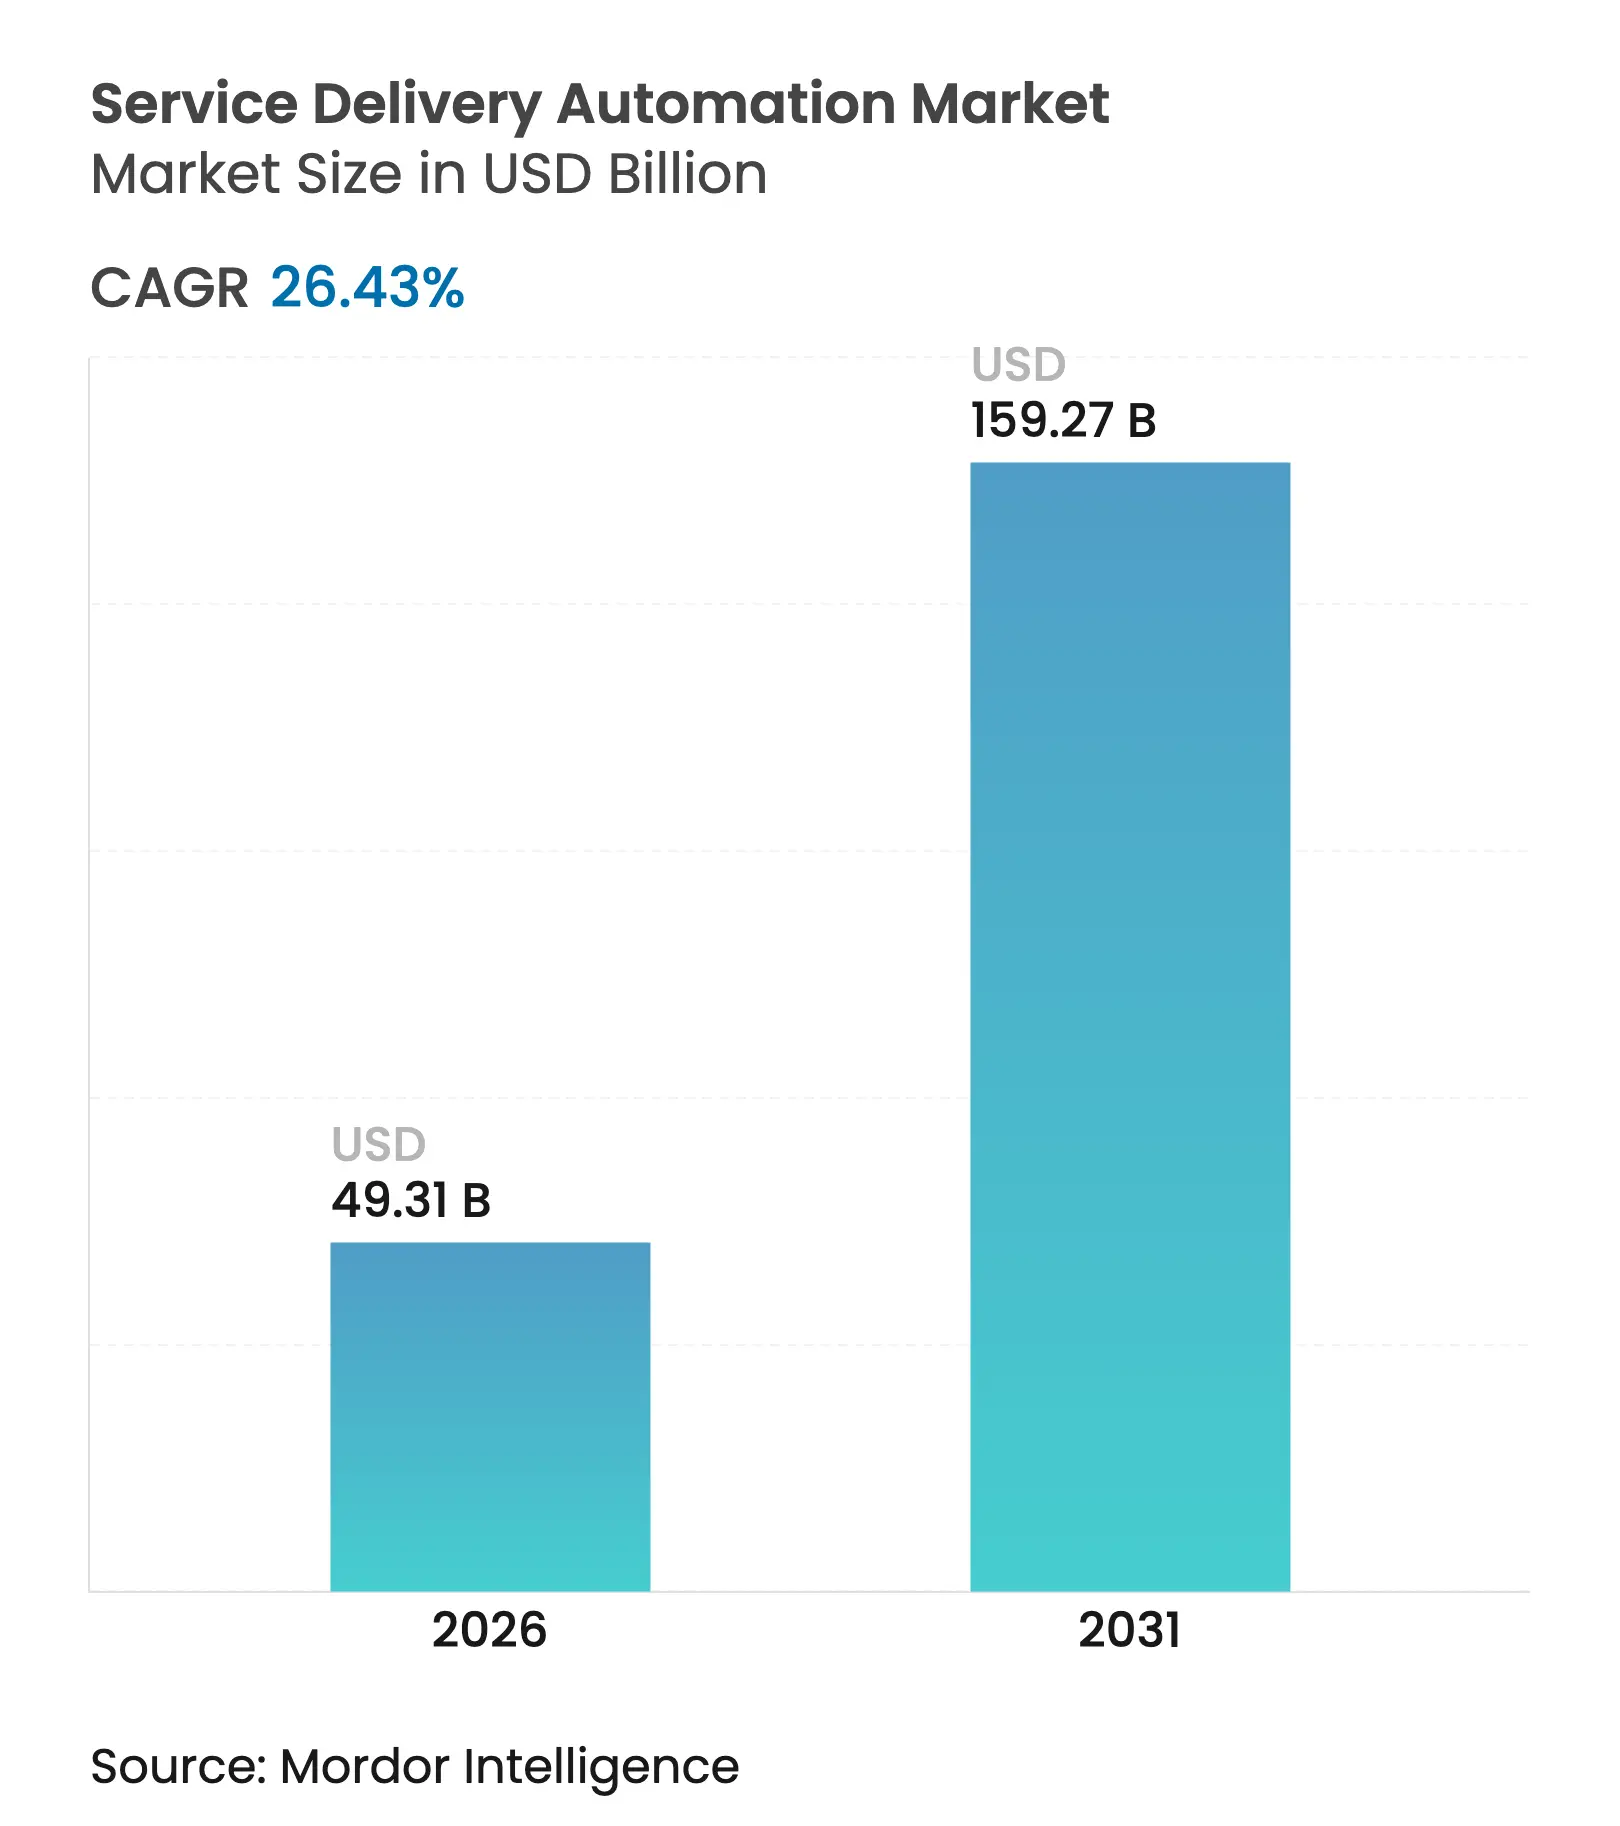
The service delivery automation market size is expected to grow from USD 39 billion in 2025 to USD 49.31 billion in 2026 and is forecast to reach USD 159.27 billion by 2031 at 26.43% CAGR over 2026-2031. Demand stems from enterprises seeking lower operating costs, faster cycle times, and higher accuracy across customer-facing and back-office processes. Hyperautomation— the combination of RPA, AI, and low-code tools— is expanding use cases from simple task execution to cognitive decision making, pushing adoption beyond early pilots into enterprise-wide rollouts. Vendor competition is intensifying as leading platforms embed generative AI, reducing total cost of ownership,, and shifting to usage-based cloud delivery. North America accounts for the largest regional spend, yet Asia-Pacific shows the steepest growth curve as local service centers and digital-first SMEs embrace cloud automation at scale.
Key Report Takeaways
Note: Market size and forecast figures in this report are generated using Mordor Intelligence's proprietary estimation framework, updated with the latest available data and insights as of 2026.
Drivers Impact Analysis
| Driver | (~) % Impact on CAGR Forecast | Geographic Relevance | Impact Timeline | |||
|---|---|---|---|---|---|---|
Cost-reduction Imperative
Cost-reduction Imperative
| 7.2% | Global, with heightened impact in North America and Europe | Medium term (2-4 years) |
(~) % Impact on CAGR Forecast
:
7.2%
|
Geographic Relevance
:
Global, with heightened impact in North America and
Europe
|
Impact Timeline
:
Medium term (2-4 years)
|
Demand for Operational Efficiency and SLAs
Demand for Operational Efficiency and SLAs
| 6.5% | Global, with early adoption in the BFSI and IT sectors | Short term (≤ 2 years) | |||
Digital-First and Cloud-first Transformation
Digital-First and Cloud-first Transformation
| 5.8% | Global, with accelerated adoption in Asia-Pacific | Medium term (2-4 years) | |||
RPA Platform Maturity and Lower TCO
RPA Platform Maturity and Lower TCO
| 4.3% | North America, Europe, with growing relevance in Asia-Pacific | Short term (≤ 2 years) | |||
Hyperautomation Convergence (iPaaS + RPA + LCAP)
Hyperautomation Convergence (iPaaS + RPA + LCAP)
| 3.9% | North America, Europe | Medium term (2-4 years) | |||
Generative-AI Copilots Enabling Citizen Developers
Generative-AI Copilots Enabling Citizen Developers
| 3.1% | North America, with gradual expansion globally | Long term (≥ 4 years) | |||
| Source: Mordor Intelligence | ||||||
Cost-reduction imperative
Enterprises continue to automate labor-intensive, high-volume workflows and record average savings of 30-40% per process. Banks that deploy RPA often earn 3-10 times ROI in year one and cut exception-handling errors markedly. Internal surveys by platform vendors reveal that 88% of employees experience higher job satisfaction after repetitive tasks are automated, signaling that cost savings align with workforce experience gains. This sentiment is strongest in BFSI, telecommunications and shared service centers where wage differentials are high.
Operational efficiency and SLA demand
Tighter service-level targets have forced organizations to accelerate process cycle times while reducing rework. Financial control teams that add service delivery automation report 90% fewer reporting errors and close books up to 85 times faster than previously manual workflows. Customer response metrics also benefit: automated triage bots resolve service tickets within minutes, boosting retention in subscription-based businesses where renewal hinges on rapid issue resolution.
Digital-first and cloud-first transformation
An overwhelming 96% of enterprises now use at least one public cloud environment, and the typical firm manages more than 1,200 software-as-a-service applications. As workflows migrate to distributed architectures, cloud-native automation offers elastic scale, enabling companies to roll out bots globally without new on-premise hardware. The model aligns with agile delivery teams that iterate quickly and integrate automation through API endpoints across customer journey touchpoints.
RPA maturity and lower TCO
Modern platforms ship with drag-and-drop design studios, built-in process discovery and ready-made connectors, compressing implementation schedules from months to weeks. Low-code tooling removes dependency on scarce full-stack engineers, while usage-based pricing reduces time to value for mid-market firms. These advances broaden the addressable base of the service delivery automation market and propel multi-department expansion inside existing accounts.
Restraint Impact Analysis
| Restraint | (~) % Impact on CAGR Forecast | Geographic Relevance | Impact Timeline | |||
|---|---|---|---|---|---|---|
Scarcity of Skilled Automation Architects
Scarcity of Skilled Automation Architects
| -2.8% | Global, with a severe impact in emerging markets | Medium term (2-4 years) |
(~) % Impact on CAGR Forecast
:
-2.8%
|
Geographic Relevance
:
Global, with a severe impact in emerging markets
|
Impact Timeline
:
Medium term (2-4 years)
|
High Up-front Integration and Change-management Cost
High Up-front Integration and Change-management Cost
| -2.3% | Global, with higher impact in sectors with legacy systems | Short term (≤ 2 years) | |||
Multitenant Workflow Security and Compliance Gaps
Multitenant Workflow Security and Compliance Gaps
| -1.9% | Global, with heightened concerns in highly regulated industries | Medium term (2-4 years) | |||
ESG Scrutiny on Automation Energy Footprint
ESG Scrutiny on Automation Energy Footprint
| -1.1% | Europe, North America, with expanding impact globally | Long term (≥ 4 years) | |||
| Source: Mordor Intelligence | ||||||
Skilled automation architect scarcity
Cognitive automation projects require multi-disciplinary talent covering process engineering, data science and risk controls. Yet senior architects remain in short supply as demand outpaces training pipelines, delaying high-value deployments and forcing companies to contract premium-priced consultants. Low-code citizen-developer tooling helps, but complex cross-system orchestration still relies on experienced designers.
High up-front integration and change-management cost
Legacy mainframes, bespoke ERP customizations and undocumented workflows drive significant pre-automation remediation expense. Firms often need to standardize data dictionaries and redesign processes before any bot can be switched on, extending payback periods and reducing board-level enthusiasm. Incremental, function-by-function pilots mitigate risk but dilute the transformational impact that holistic service delivery automation can create.
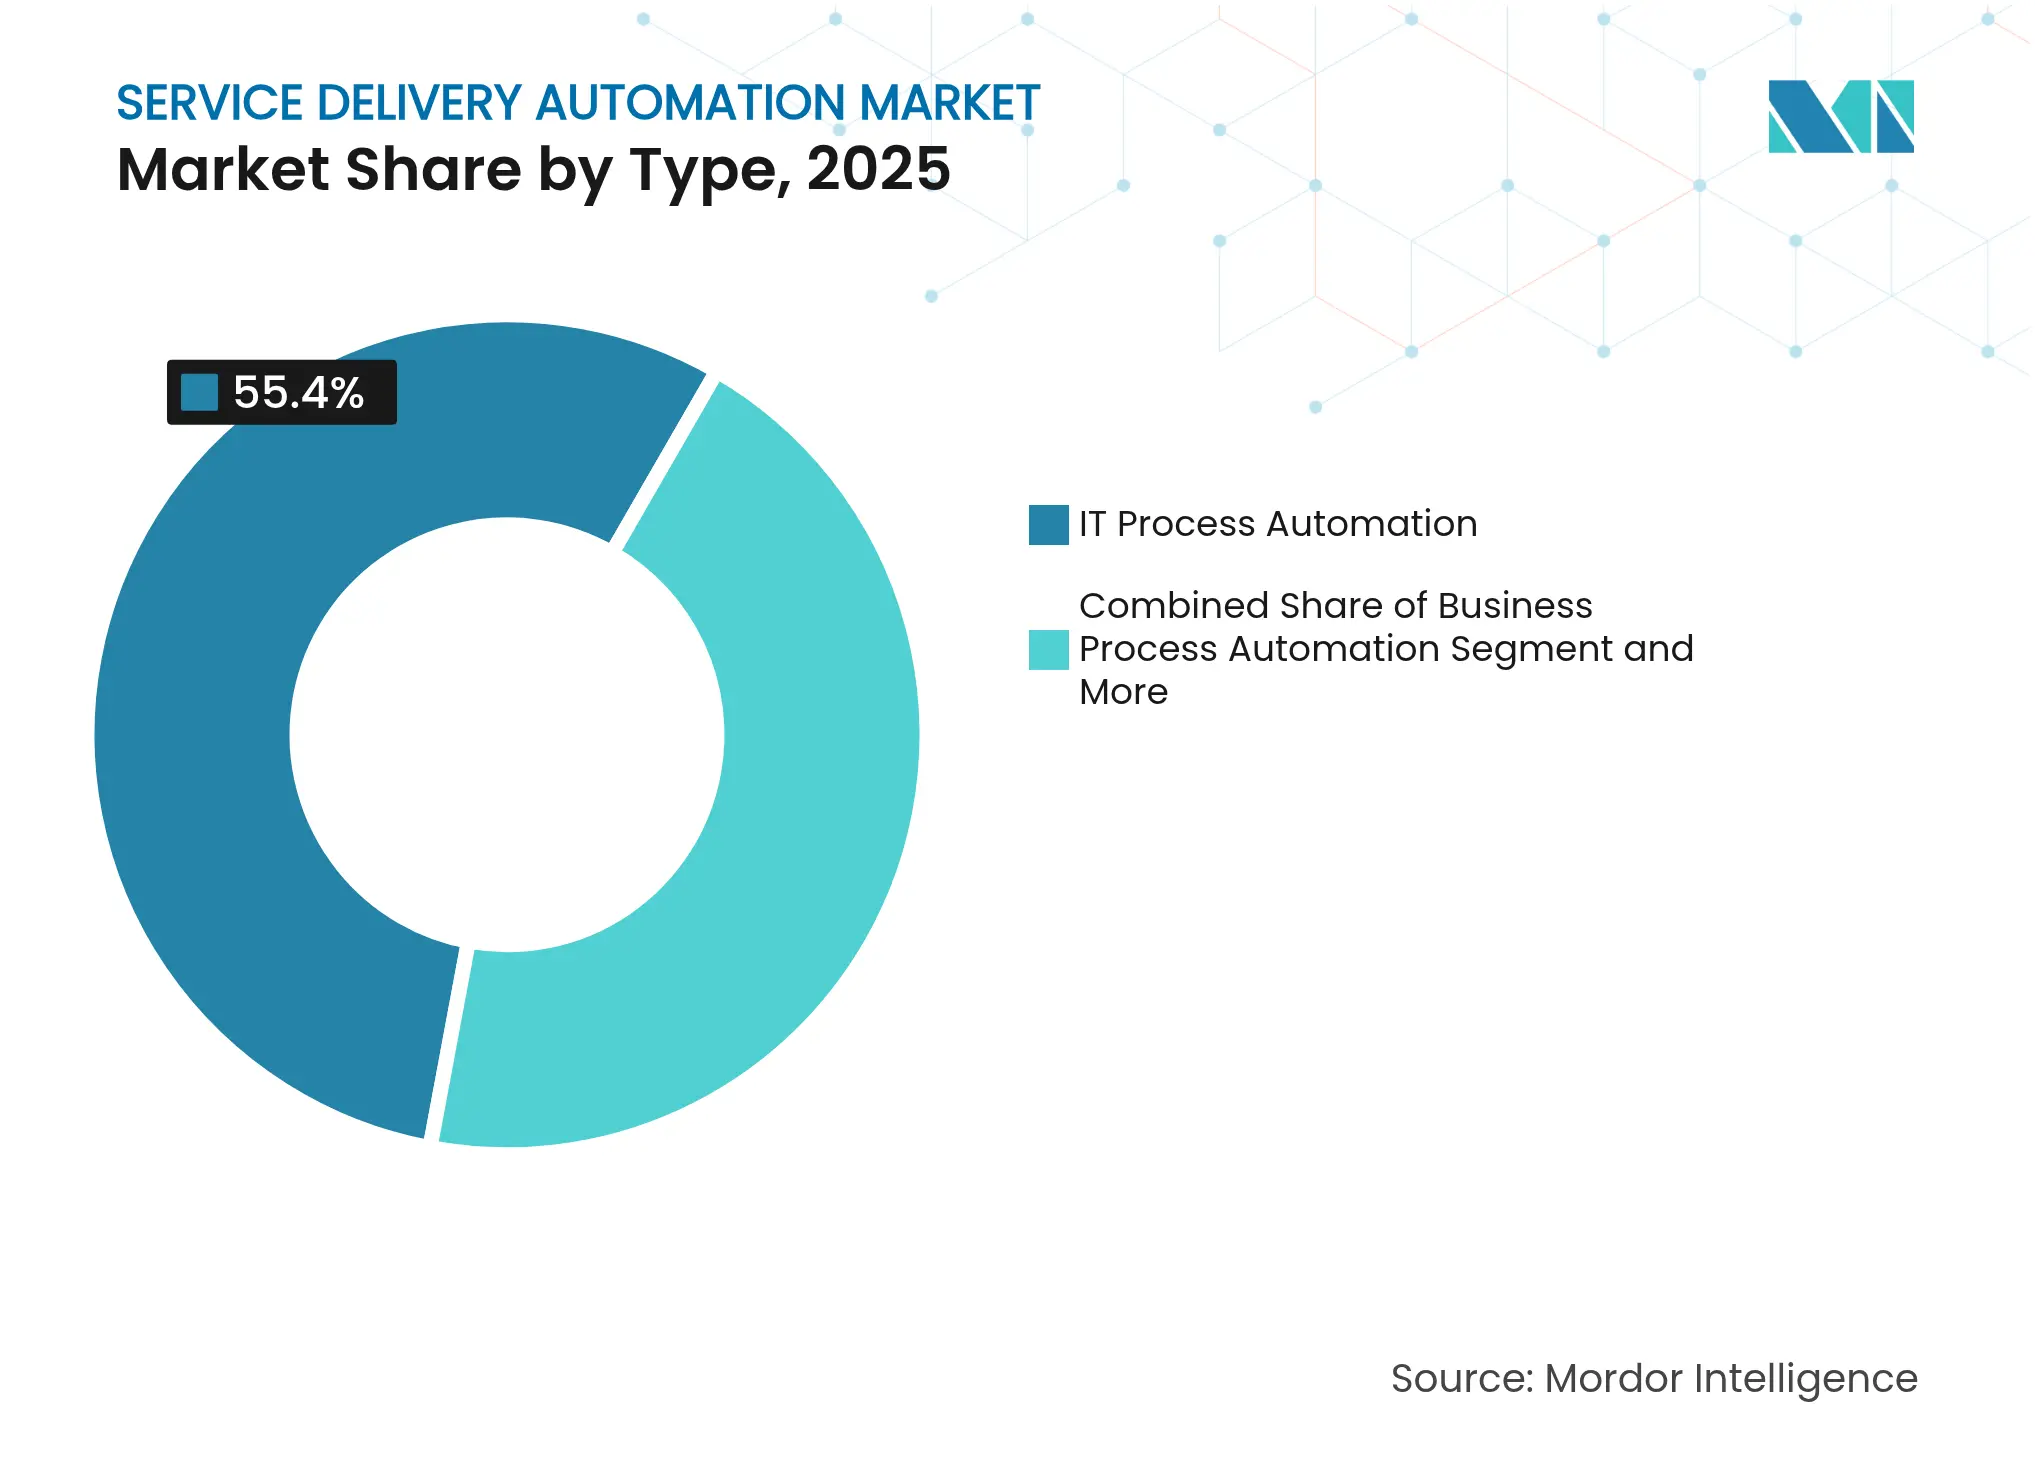
By Type: Cognitive automation disrupting traditional RPA
IT Process Automation held 55.40% of service delivery automation market share in 2025 owing to well-defined run-book scripts and clear ROI benchmarks. Service desk teams that automate password resets, backup checks and incident routing cut mean-time-to-resolve by up to 40%. In parallel, the Cognitive/AI-based Automation segment is expanding at a 38.59% CAGR, fueled by advances in large language models and image analytics that let bots interpret unstructured inputs. Underwriters now deploy cognitive bots to assess claim documents and flag anomalies in real time, unlocking new revenue streams alongside efficiency wins. As firms layer AI onto foundational RPA estates, the service delivery automation market anticipates a platform refresh cycle centred on intelligent orchestration.
This evolution changes purchasing criteria. Buyers increasingly seek solutions that combine task automation, decision support and continuous learning inside one license. Vendors respond by embedding native AI or partnering with hyperscale AI services, creating a convergence that shifts spend away from niche script-only tools toward unified suites. The service delivery automation market is therefore tilting toward fewer but broader deployments that serve both IT and business operations under a single governance framework.
Note: Segment shares of all individual segments available upon report purchase
By Component: Services surge as complexity rises
Software Platforms represented 61.05% of 2025 revenue because every automation journey begins with a licence. These platforms now ship with built-in computer vision, process mining and governance consoles that accelerate proof-of-value builds. However, Services are projected to outpace software at a 14.20% CAGR. As automation scales to hundreds of processes, enterprises need roadmap design, change management, bot health monitoring, and continuous improvement programs that internal teams struggle to absorb. Consulting firms and system integrators thus bundle frameworks for value assessment, citizen-developer enablement and center-of-excellence operation. The result is a steady shift in budget mix from pure licences toward ongoing managed services inside the service delivery automation market.
The service delivery automation market size for managed services is expanding particularly fast in regulated industries where continuous compliance testing and audit logs are mandatory. Vendors now offer “automation-as-a-service” models with shared responsibility matrices covering SLA adherence, version upgrades and security patching. This subscription-oriented delivery appeals to SMEs that lack an internal IT operations bench yet want enterprise-grade reliability.
By Deployment Mode: Cloud dominance accelerates
Cloud deployments captured 60.75% of 2025 spend and remain the fastest-growing mode at a 13.10% CAGR. Serverless runtimes and container orchestration let enterprises burst bot capacity on demand during quarter-end peaks, avoiding idle hardware the rest of the year. SaaS updates also provide instant access to new AI skills, shortening innovation cycles. The service delivery automation market size tied to multitenant SaaS is therefore scaling faster than private-cloud or on-premise models.
Even conservative sectors such as insurance increasingly blend on-premises legacy systems with cloud-hosted orchestration layers, creating hybrid control planes that respect data residency without sacrificing agility. Platform vendors now certify connectors for popular cloud ERPs, CRM suites and collaboration tools, ensuring that new automations align with modern digital workspaces while extending coverage back to mainframe transactions.

Recognized by Experts. Trusted by Leaders.
A trusted intelligence partner to global decision-makers across 90+ countries.


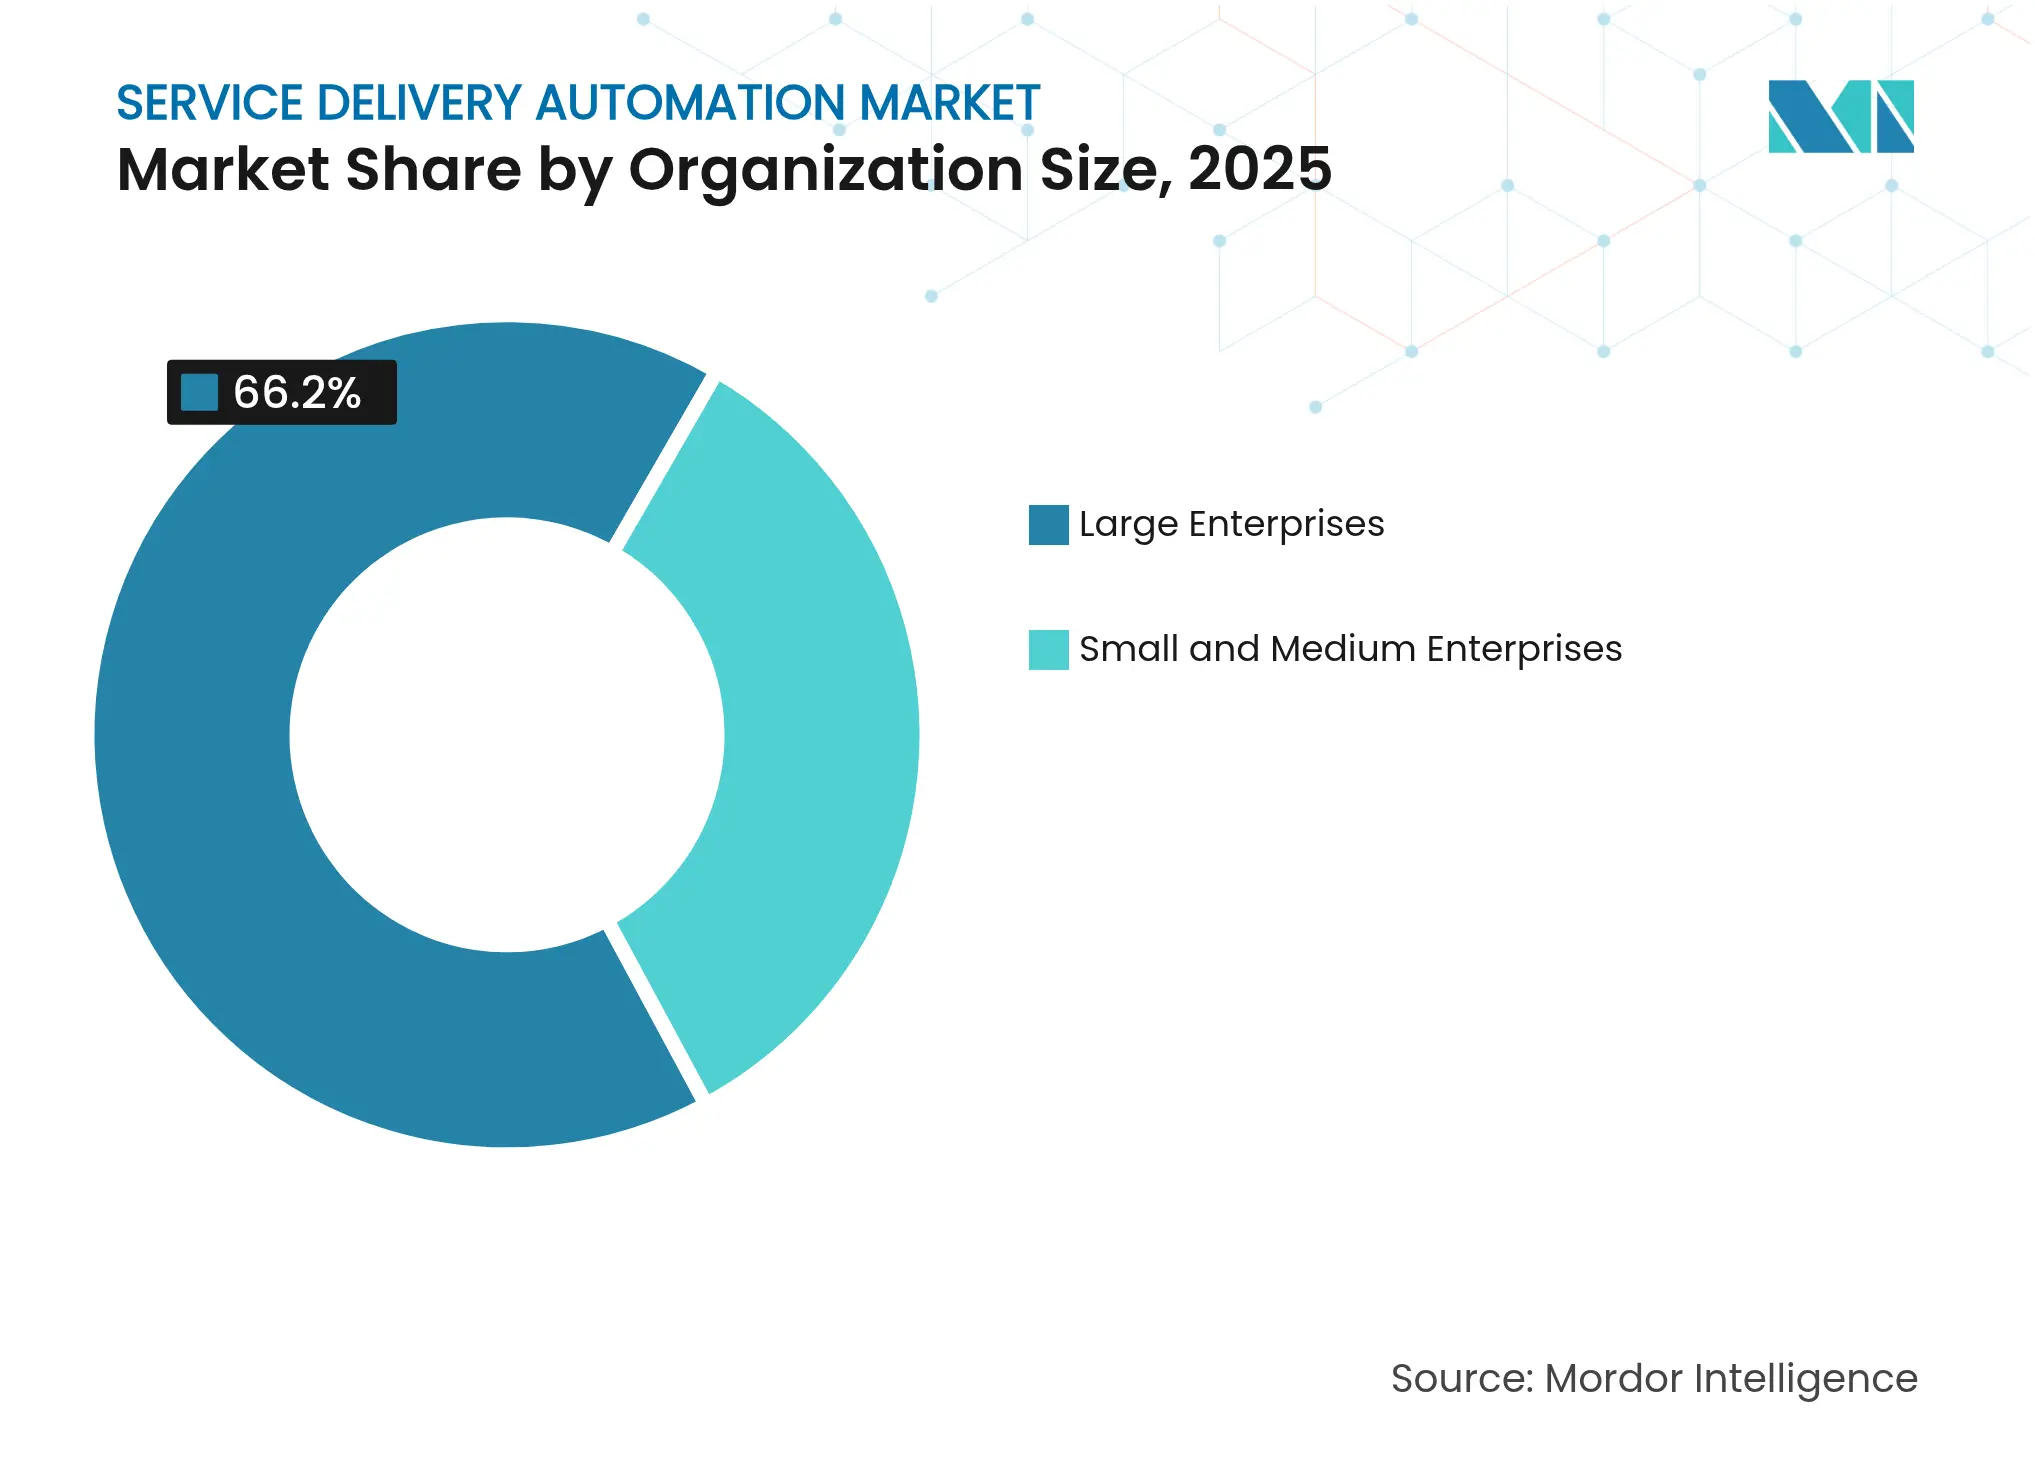
By Organization Size: SMEs close the gap
Large Enterprises accounted for 66.20% of the service delivery automation market size in 2025, leveraging global footprints to centralize support functions and standardize processes. They typically launch 200-plus bots across finance, HR, and supply chain, achieving portfolio-level ROI within two fiscal years. Yet SMEs are narrowing the divide with a 31.20% CAGR as pay-as-you-go platforms remove entry barriers. Subscription pricing, pre-built industry templates, and no-code studios allow a mid-size logistics firm, for example, to automate invoice reconciliation in weeks without hiring RPA engineers.
The result is democratization. Cloud marketplaces now bundle starter kits that combine workflow, AI document processing, and analytics at tiered volumes. Community forums, academy portals, and partner programs disseminate best practices, giving SMEs the confidence to expand beyond initial departmental pilots. This bottom-up momentum enlarges the service delivery automation industry user base and feeds platform revenue flywheels.
Note: Segment shares of all individual segments available upon report purchase
By End-user Industry: Healthcare disruption outpaces BFSI leadership
BFSI retained 22.20% share of the service delivery automation market in 2025, driven by stringent compliance, data-intensity and 24x7 customer demands. Banks apply automation to know-your-customer checks, trade surveillance and mortgage approvals, cutting cycle times from days to minute. However, Healthcare and Pharmaceuticals is growing fastest at a 33.10% CAGR. Hospitals deploy conversational AI to triage patient inquiries, while revenue-cycle bots extract data from insurance forms and update EMR systems, reducing denied claims and easing clinician workload.
Regulatory agencies encourage digital records, amplifying demand for secure, auditable automation in lab reporting and drug safety monitoring. Vendors therefore roll out HIPAA-ready packages that bundle OCR, natural language understanding and decision rules tuned to medical coding. As value-based care reimbursement expands, providers seek cost-to-collect efficiencies, further boosting healthcare’s contribution to the service delivery automation market.
North America remains the largest hub for the service delivery automation market, supported by high labor costs, mature cloud infrastructure and headquarters of leading platform vendors. Financial institutions and healthcare systems spearhead adoption, often integrating cognitive bots with analytics to predict exceptions and pre-empt SLA breaches. Generative AI experimentation is widespread, with firms piloting large language models to draft legal summaries and compliance narratives.
Asia-Pacific records the steepest growth trajectory. India and the Philippines host global service centers keen to reduce attrition costs through digital workers, while Chinese insurers automate claims to manage surging policy volumes. Government stimulus for smart manufacturing and logistics digitization fuels warehouse automation that relies on orchestration bots to schedule AGVs. Local vendors offer price-sensitive bundles, accelerating penetration into medium-sized enterprises across ASEAN markets.
Europe exhibits steady uptake across Northern and Western economies. The EU’s General Data Protection Regulation prompts businesses to embed controls that log every bot action, aligning automation with audit trails. Manufacturing conglomerates in Germany and Benelux automate shop-floor reporting, while public agencies in the Nordics deploy chatbots to handle citizen queries in multiple languages. Decision making is cautious: IT spending favors projects with transparent payback, driving phased roll-outs that still contribute significant volume to the overall service delivery automation market.
Market Concentration
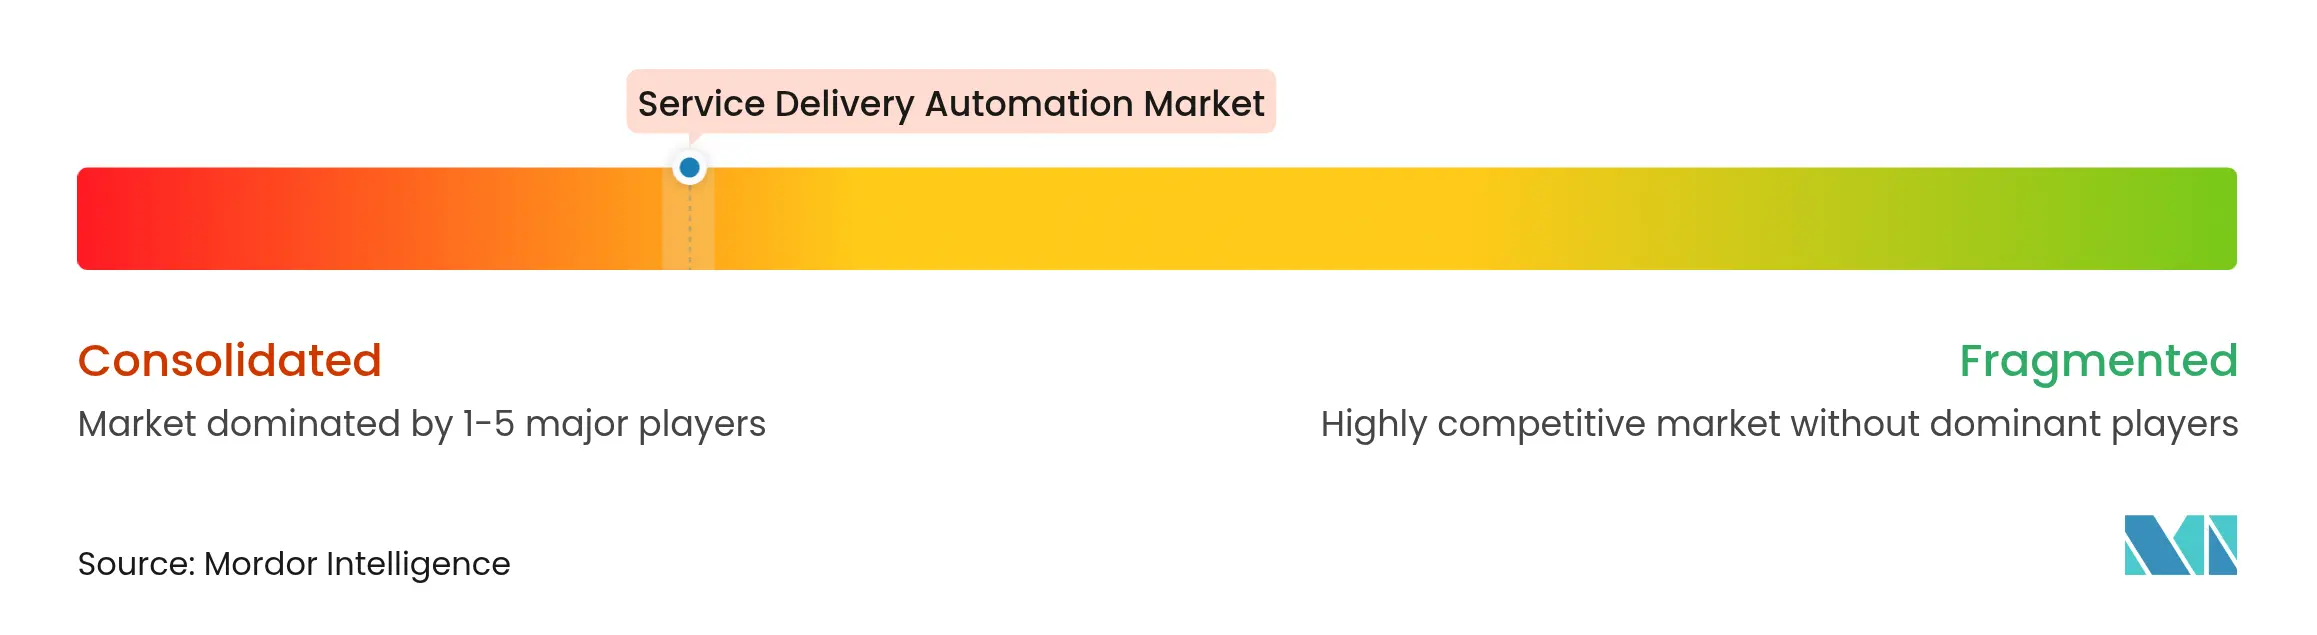
The top five vendors hold roughly 65% of global revenue, giving the market moderate concentration. UiPath leads with an estimated 27% share, anchored by a broad platform and vibrant community marketplace. It recently partnered with HCLTech to incubate vertical templates and AI labs, extending reach into telecom and manufacturing clients. Automation Anywhere, IBM, Microsoft and Blue Prism round out the front pack, each layering generative AI and process mining on their core RPA engines.
Competitive differentiation is shifting toward ecosystem breadth. Vendors curate libraries of pre-built connectors, AI skills and partner solutions that speed time to value. Alliances with hyperscalers such as Google Cloud leverage advanced document AI to enhance extraction accuracy[2]Automation Anywhere, “Google Partnership Extends Document AI Integration,” VentureBeat, venturebeat.com. Meanwhile, niche specialists focus on domains like intelligent document processing or contact-center analytics, often integrating with major RPA platforms rather than competing head-to-head.
White-space opportunities remain in regulated verticals. Start-ups deliver FDA-ready validation packs or cross-border payment reconciliation bots that embed sanctions screening. Mid-market clients value managed-service bundles that wrap hosting, bot administration and continuous improvement, reducing the need for internal COEs. As a result, the service delivery automation market continues to balance consolidation at the top with vibrant innovation among focused challengers.

*Disclaimer: Major Players sorted in no particular order
1. INTRODUCTION
2. RESEARCH METHODOLOGY
3. EXECUTIVE SUMMARY
4. MARKET LANDSCAPE
5. MARKET SEGMENTATION
6. COMPETITIVE LANDSCAPE
7. MARKET OPPORTUNITIES AND FUTURE OUTLOOK
Service delivery automation (SDA) is defined as an umbrella concept for the new technologies that automate a series of human actions in an IT or business process. SDA has the ability to match legacy technologies with automated technologies that can simplify different business cases and minimize disruption. The industries like retail, hospitality, healthcare, and logistics are embracing automation.
The service delivery automation market is segmented by type (IT process automation and business process automation), organization size (large enterprises and small and medium enterprises (SMEs)), end-user vertical (BFSI, IT, telecommunication, and media, hospitality, and transportation, retail and consumer goods, healthcare and pharmaceuticals, manufacturing, and logistics), and geography (North America, Europe, Asia Pacific, Latin America, Middle East & Africa).The market sizes and forecasts are provided in terms of value (USD) for all the above segments.
Pricing Strategy for Semiconductor Components
3 Min Read
Accelerating Additive Manufacturing Adoption in India
3 Min Read
When decisions matter, industry leaders turn to our analysts. Let’s talk.