OKR and Goal Management Software Market Size and Share
Market Overview
| Study Period | 2020 - 2031 |
|---|---|
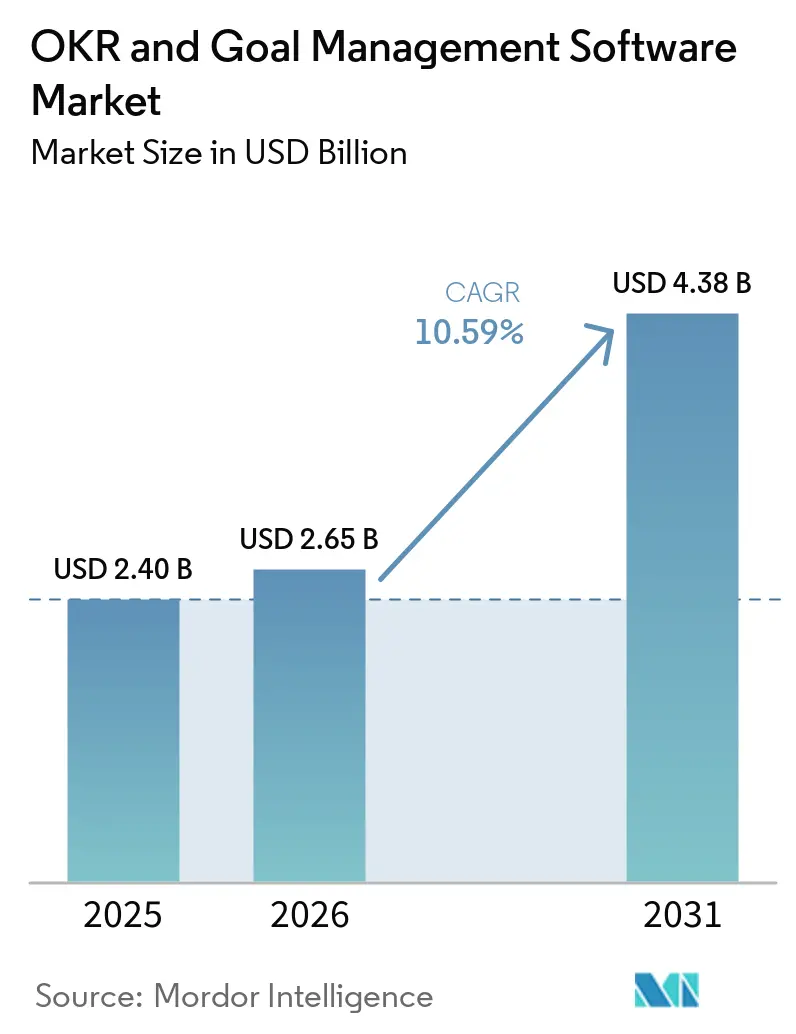
| Market Size (2026) | USD 2.65 Billion |
| Market Size (2031) | USD 4.38 Billion |
| Growth Rate (2026 - 2031) | 10.59% CAGR |
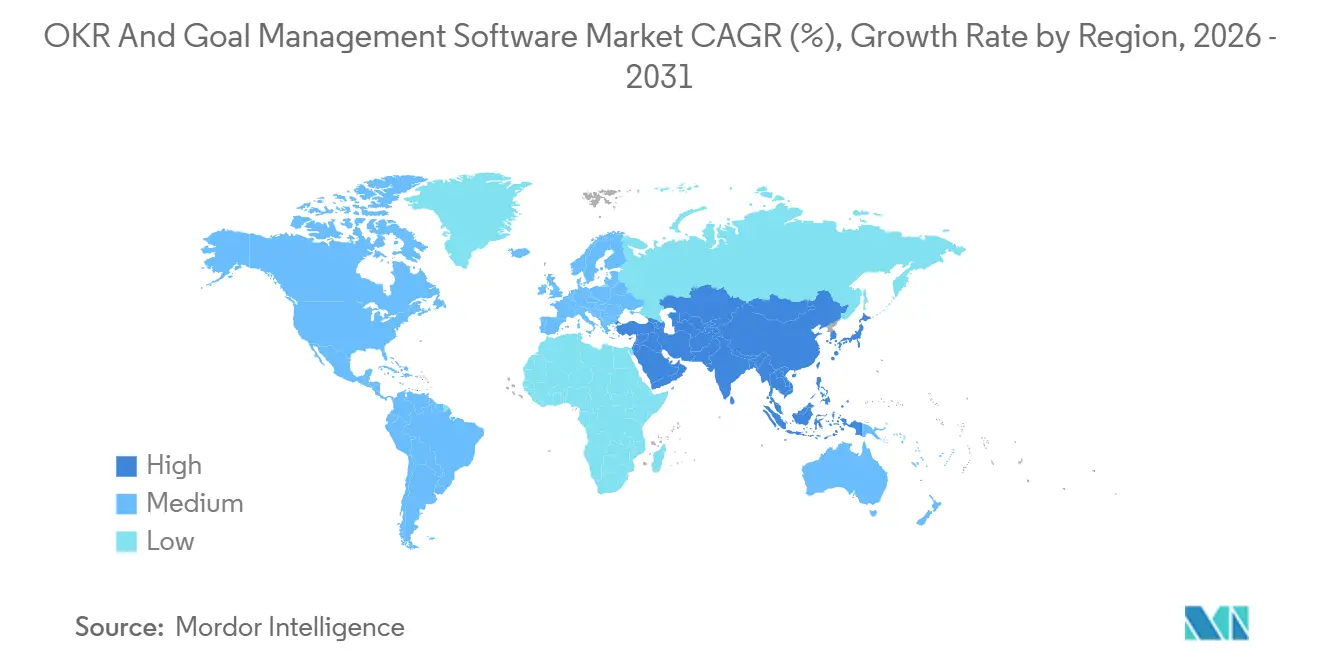
| Fastest Growing Market | Asia-Pacific |
| Largest Market | North America |
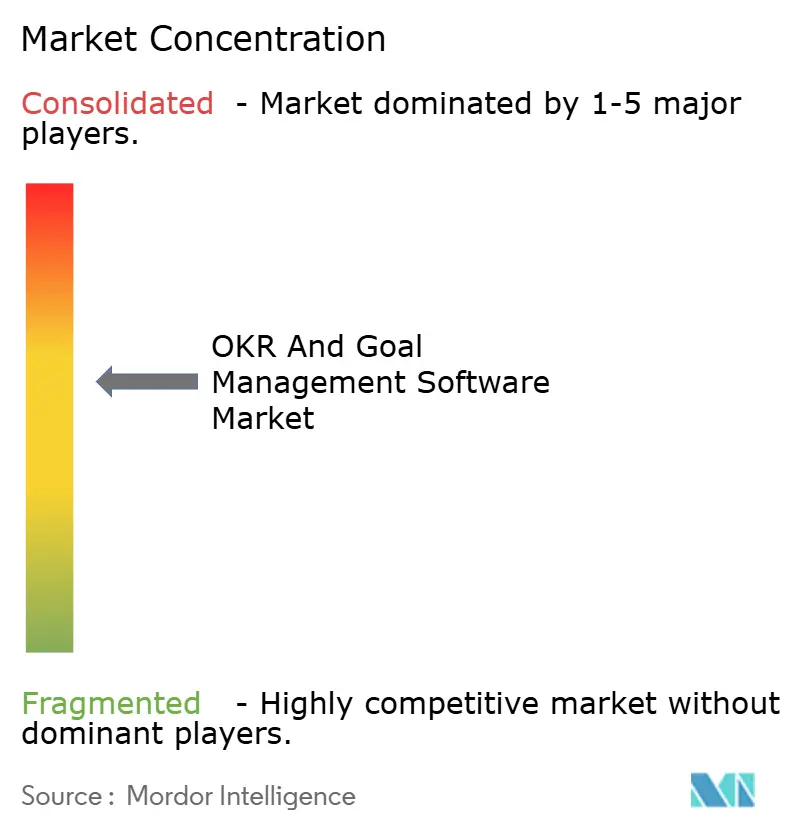
| Market Concentration | Medium |
Major Players *Disclaimer: Major Players sorted in no particular order Image © Mordor Intelligence. Reuse requires attribution under CC BY 4.0. | |
OKR and Goal Management Software Market Analysis by Mordor Intelligence
The OKR and goal management software market size is expected to increase from USD 2.40 billion in 2025 to USD 2.65 billion in 2026 and reach USD 4.38 billion by 2031, growing at a CAGR of 10.59% over 2026-2031. A decisive shift from annual appraisals to continuous, outcome-focused alignment is unfolding as companies manage distributed workforces and faster strategy cycles. Vendors that once competed on polished dashboards now win on friction-free data flows, while AI features that surface execution risks in real time are fast becoming table stakes. Consolidation around platform players is squeezing standalone rivals, yet white-space still exists in outcome-based contracting and autonomous execution layers. Persistent concerns around data sovereignty, cultural change and tool fatigue will, however, temper the speed of cloud migration and favor providers with robust integration libraries.
Key Report Takeaways
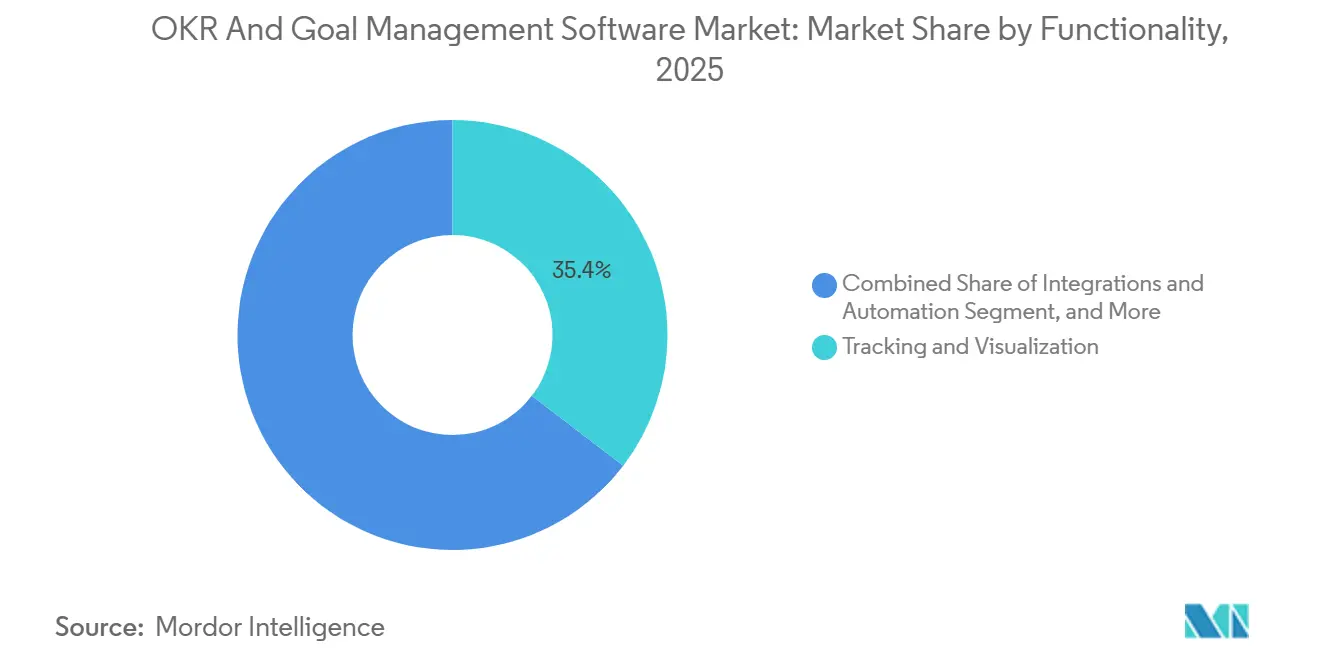
- By functionality, Tracking and Visualization led with 35.41% of OKR and goal management software market share in 2025, whereas Integrations and Automation is projected to expand at a 12.01% CAGR through 2031.
- By deployment, On-Premises installations accounted for 67.41% of the OKR and goal management software market size in 2025, yet Cloud-Based solutions are advancing at a 12.89% CAGR over 2026-2031.
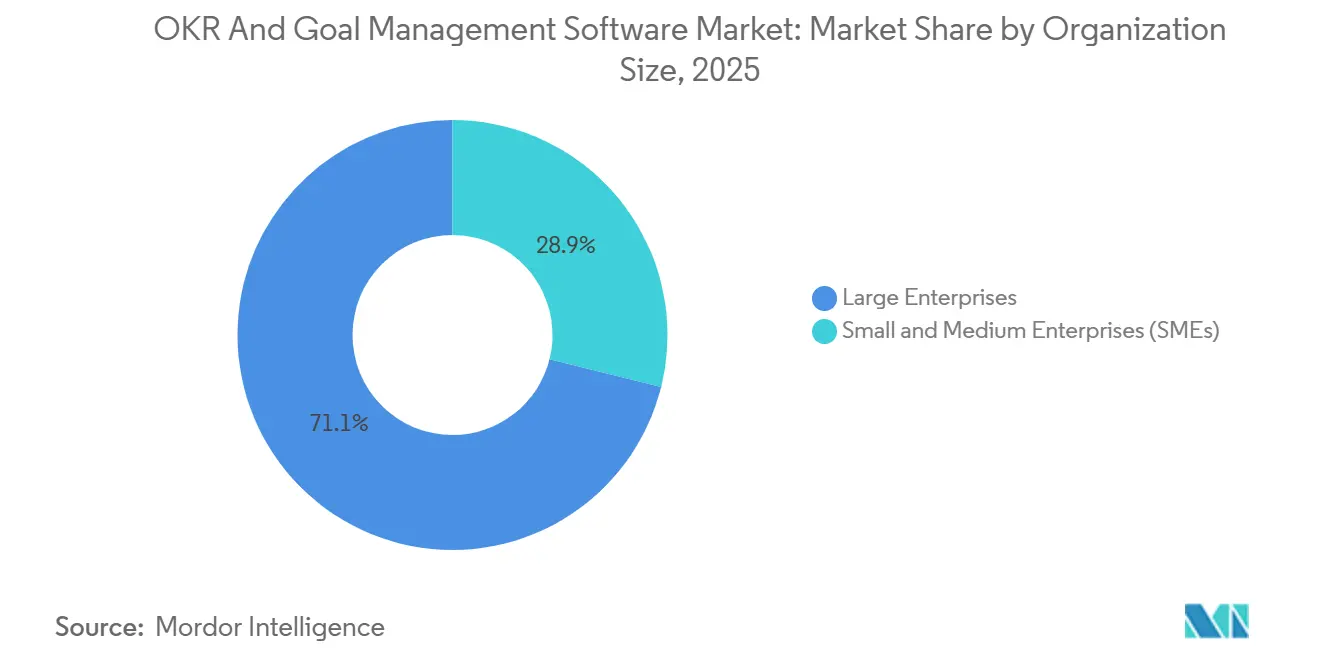
- By organization size, Large Enterprises controlled 71.12% share of the OKR and goal management software market in 2025, while Small and Medium Enterprises are forecast to post a 13.22% CAGR to 2031.
- By industry vertical, IT and Telecommunications captured 36.88% of 2025 revenue, but Healthcare and Life Sciences is on track to grow at an 11.65% CAGR through 2031.
- By geography, North America captured 37.34% share in 2025, and Asia-Pacific is the fastest-growing region with a 12.45% CAGR through 2031.
Note: Market size and forecast figures in this report are generated using Mordor Intelligence’s proprietary estimation framework, updated with the latest available data and insights as of January 2026.
Global OKR and Goal Management Software Market Trends and Insights
Drivers Impact Analysis*
| Driver | (~) % Impact on CAGR Forecast | Geographic Relevance | Impact Timeline |
|---|---|---|---|
| Rising Adoption of Agile and Remote Work Cultures | +2.5% | Global, early concentration in North America and Europe | Medium term (2-4 years) |
| Increasing Need for Real-Time Performance Visibility | +2.0% | Global, acute in IT, Telecommunications and BFSI | Short term (≤ 2 years) |
| Growing Investments in Digital Transformation Initiatives | +2.3% | Global, led by North America and Asia-Pacific | Medium term (2-4 years) |
| Integration of OKR Tools with Existing Enterprise Software Ecosystems | +1.8% | Global, strongest in North America and Europe | Short term (≤ 2 years) |
| Expansion of Outcome-Based Contracting in Professional Services | +1.0% | North America and Europe, emerging in Middle East | Long term (≥ 4 years) |
| Surge in Venture-Funded Startups Standardizing OKRs Pre-Series B | +0.9% | North America and Asia-Pacific | Medium term (2-4 years) |
| Source: Mordor Intelligence | |||
Rising Adoption of Agile and Remote Work Cultures
Hybrid work now exceeds 60% penetration in North America and Europe, exposing the limits of annual goal cycles. Microsoft embedded Ally.io’s Objectives and Key Results (OKR) tracker into Teams in 2025, allowing staff to review objectives inside their everyday collaboration hub and accelerating usage at scale. WorkBoard followed by wiring its platform to Microsoft Copilot, letting users query progress in natural language, which removes a major friction point. Betterworks responded in 2026 with a NextGen release that adds more than 400 AI workflows to automate check-ins. Collectively, these moves prove that distributed teams demand asynchronous visibility and continuous alignment, fuelling medium-term growth for the OKR and goal management software market.
Increasing Need for Real-Time Performance Visibility
Boardrooms no longer accept quarter-lag dashboards. Betterworks’ AI-Powered Talent Intelligence, launched in May 2026, correlates key-result health with skill gaps, alerting leaders before misses occur.[1]Betterworks Communications, “Betterworks Introduces AI-Powered Talent Intelligence,” betterworks.com API-first architectures further shorten latency by streaming data directly from CRM, project-management and finance systems. Start-up Brev, fresh from a USD 3.3 million raise in April 2026, auto-updates key results from Slack threads, Jira tickets and meeting transcripts, eliminating the manual entry that derails 90% of enterprises. Real-time insight is therefore a short-term catalyst, especially in tech-driven verticals where competitive cycles compress quickly.
Growing Investments in Digital Transformation Initiatives
National digital programs are turning OKRs into governance staples. Saudi Arabia’s Vision 2030, which added SAR 495 billion (USD 132 billion) to GDP in 2024, requires ministries to track milestone delivery against digital-economy targets, pushing platform adoption across the public sector. China shows 78.3% penetration in mid-to-large enterprises in 2026, supported by vendors such as DingDang. Profit.co gained FedRAMP Ready status in June 2025, opening U.S. federal opportunities where transformation mandates hinge on secure cloud tools. These programs underpin medium-term tailwinds for the OKR and goal management software market.
Integration of OKR Tools With Existing Enterprise Software Ecosystems
Tool sprawl now harms efficiency for 82% of operations leaders, making tight integration a buying criterion. Perdoo linked its OKRs to Monday.com in February 2026, so users update progress where work already happens. WorkBoard’s acquisition of Quantive in 2025 created a library of hundreds of connectors that reduce engineering overhead. Brev’s SOC 2 agents can scan calls, tasks and emails, then update objectives without storing raw audio. These capabilities produce immediate value and will keep influencing short-term purchasing decisions in markets with mature SaaS stacks.
Restraints Impact Analysis*
| Restraint | (~) % Impact on CAGR Forecast | Geographic Relevance | Impact Timeline |
|---|---|---|---|
| Data Security and Privacy Concerns in Cloud Deployments | -1.5% | Global, acute in Europe, China, healthcare and financial services | Short term (≤ 2 years) |
| Resistance to Cultural Change in Traditional Enterprises | -1.8% | Global, most pronounced in Europe and manufacturing | Long term (≥ 4 years) |
| Overlapping Functionality With Existing Performance Suites Leading to Tool Fatigue | -1.2% | North America and Europe | Medium term (2-4 years) |
| Limited Local Language Support Hindering Adoption in Non-English-Speaking Markets | -0.8% | Asia-Pacific (ex-India, Singapore), South America, Middle East and Africa | Medium term (2-4 years) |
| Source: Mordor Intelligence | |||
Data Security and Privacy Concerns in Cloud Deployments
Strict regimes such as GDPR, PIPL and sector-specific rules keep many buyers on-premises. Perdoo places infrastructure in Ireland, Weekdone hosts in Estonia and Profit.co offers regional clouds plus on-premises editions for finance and healthcare clients. Yet each extra platform expands the audit surface, deepening IT resistance. High-profile breaches during 2024-2025 crystallized these fears, so security remains a short-term drag on cloud conversion inside the OKR and goal management software market.
Resistance to Cultural Change in Traditional Enterprises
OKRs favor transparency and peer accountability, but legacy hierarchies prize directive planning. PeopleStrong observes that only 35% of Middle East entities have moved to quarterly reviews, despite a 20% lift in headline adoption. Leadership commitment wavers, and incentive systems tied to activity metrics push staff back to comfortable habits. Vendors such as Rhythms raise capital on promises of AI coaches that guide culture change, yet multi-year timeframes mean this restraint will persist well beyond 2028.
*Our forecasts treat driver/restraint impacts as directional, not additive. The impact forecasts reflect baseline growth, mix effects, and variable interactions.
Segment Analysis
By Functionality: Integrations Eclipse Dashboards as Execution Bottleneck Shifts
Tracking and Visualization led the OKR and goal management software market size in 2025, but Integrations and Automation is expected to record a 12.01% CAGR through 2031. The pivot reflects customer demand to cut manual updates that waste hours and skew data integrity. Brev’s AI agents refresh key results from Slack, Jira and Salesforce, an advance that could save a 500-person firm up to USD 2 million annually. Executives still want clear progress visuals, so dashboards persist, yet they are now embedded within integration layers rather than sold as standalone modules.
Performance Analytics has emerged as the bridge between goals and operational triggers; Betterworks uses predictive flags to prompt managers before slippage turns into failure. Alignment and Collaboration tools grow steadily as hybrid teams need asynchronous coordination, while Reporting and Insights remain vital in regulated industries for audit trails. Niche features such as gamification attract engagement-oriented buyers but hold modest revenue. The net result is a feature stack converging around end-to-end execution, with integrations as the primary purchase driver for the OKR and goal management software market.


By Deployment: Cloud Gains Despite Data Sovereignty Headwinds
On-Premises installations owned 67.41% of OKR and goal management software market share in 2025, yet Cloud-Based solutions are expanding at a 12.89% CAGR. Compliance dictates many on-premises decisions; German banks, for example, cite BaFin guidance that prefers local hosting. Vendors are reacting with hybrid controls. Profit.co achieved FedRAMP Ready status to unlock U.S. federal demand, and Quantive lets enterprises choose AWS regions to isolate data.[2]Profit.co Press Center, “Profit.co Achieves FedRAMP Ready Status,” profit.co Nonetheless, SMEs gravitate to SaaS because it cuts capex, speeds deployment and ensures automatic upgrades.
Over time, broader infrastructure modernisation will tilt the balance. Microsoft’s embedding of Ally.io into Viva Goals exposes millions of Teams users to native cloud OKRs, normalising remote hosting. Still, cloud growth will play out gradually as regulators refine guidelines and incumbents complete migration roadmaps. The coexistence of both models is therefore assured through at least 2031 inside the OKR and goal management software market.
By Organization Size: SMEs Outpace Enterprises as Usage-Based Pricing Lowers Barriers
Large Enterprises captured 71.12% of 2025 revenue, yet Small and Medium Enterprises are forecast to post a 13.22% CAGR to 2031. The change coincides with vendors shifting to product-led growth and usage-based charging. Klaar’s Series A finances a self-serve motion aimed at mid-market firms, while Perdoo’s AI coach helps small teams write measurable key results without consultancy fees. Venture-backed startups now institutionalize OKRs pre-Series B to reassure investors about execution discipline, widening the funnel for SME-centric tools.
Enterprises keep the biggest budgets and need advanced analytics, custom integrations and multilingual support. WorkBoard’s roll-up of Quantive fortified an enterprise-first portfolio serving Adobe, Experian and others. As younger companies scale headcount, they tend to retain their early-chosen platform, giving SME-focused vendors a pathway to larger contracts. Churn is, however, higher in this cohort, obliging providers to maintain rapid feature updates to protect share in the OKR and goal management software market.
By Industry Vertical: Healthcare Surges as Value-Based Care Links Payment to Outcomes
IT and Telecommunications led with 36.88% of 2025 revenue, a legacy of tech firms’ early adoption of agile. Growth now shifts toward Healthcare and Life Sciences, forecast at an 11.65% CAGR through 2031. U.S. payers increasingly reimburse on measurable quality scores, so hospitals use OKRs to cascade population-health targets to frontline staff. Europe’s device manufacturers adopt similar metrics to comply with post-market surveillance under MDR.
BFSI maintains solid demand thanks to risk management reporting needs, while Manufacturing uses OKRs to synchronize throughput with resilience and sustainability targets. Retail and eCommerce uptake rises with omnichannel complexity. Professional services add outcome-based clauses into client contracts, effectively externalising OKR dashboards. Government-led digital-economy programs in the Middle East also pull demand, making vertical templates and compliance modules critical differentiators in the OKR and goal management software market.
Geography Analysis
North America retained 37.34% share in 2025, buoyed by the United States’ software spending growth forecast of 15.2% for 2026. Consolidation is evident: Microsoft absorbed Ally.io, and WorkBoard bought Quantive, signalling a maturity phase that prioritises cross-suite synergies over rapid user acquisition. Canada and Mexico add niche demand as regional divisions align with U.S. platforms to standardise reporting.
Asia-Pacific enjoys the fastest expansion at a 12.45% CAGR over 2026-2031. China’s 78.3% penetration in mid-to-large enterprises exemplifies state-supported digitalisation, though data-localisation rules favour domestic vendors. India’s outsourcing hubs rely on OKRs to keep deliverables aligned with global clients, while Japan’s governance reforms promote transparency that resonates with outcome frameworks. Southeast Asian economies are catching up as regional unicorns adopt OKR suites early.
Europe contributes mid-tier share, with Germany, the United Kingdom and France leading. GDPR drives demand for EU-hosted clouds, prompting Weekdone to operate from Estonia and Perdoo from Ireland. Divergent national rules raise compliance costs, slowing multi-country rollouts. South America is modest; Brazil and Argentina dominate but face currency volatility and limited localisation. Adoption in the Middle East and Africa grows from a small base, fueled by digital-economy roadmaps and multilingual platform expansions, yet language gaps and bandwidth constraints still hinder broader penetration of the OKR and goal management software market.

Competitive Landscape
The top five suppliers held roughly 40% share in 2025, indicating moderate fragmentation. Microsoft’s Ally.io acquisition embedded OKRs into Viva, instantly reaching millions of Microsoft 365 users and raising expectations for native integration. WorkBoard’s Quantive deal merged complementary client lists and added hundreds of pre-built connectors that matter to enterprise buyers.
Betterworks countered with more than 400 AI-based features in its 2026 NextGen rebuild, wagering that depth can trump breadth.[3]Betterworks Communications, “NextGen Platform Launch,” betterworks.com Emerging entrants pursue white-space. Brev focuses on autonomous execution layers that update objectives from unstructured data feeds, charging by usage rather than seats.
Profit.co leverages FedRAMP Ready compliance to defend government opportunities. Vendors now compete on AI risk alerts, vertical templates and ease of integration, as 82% of leaders want to cut redundant tools. Those unable to offer consolidated experiences face margin pressure in the OKR and goal management software market.
OKR and Goal Management Software Industry Leaders
WorkBoard Inc.
Betterworks Systems Inc.
15Five Inc.
Profit.co Inc.
Perdoo GmbH
- *Disclaimer: Major Players sorted in no particular order

Recent Industry Developments
- May 2026: Betterworks introduced AI-Powered Talent Intelligence that links goal attainment to skill gaps and succession risks, advancing proactive talent interventions.
- April 2026: Brev secured USD 3.3 million in pre-seed funding to build an AI-native execution layer that updates OKRs from Slack, Jira, Linear, HubSpot, Salesforce and meeting transcripts.
- February 2026: Perdoo partnered with Monday.com so users can sync OKRs with project workflows inside the Monday.com workspace.
- January 2026: Betterworks released its NextGen platform featuring more than 400 AI workflows to automate goal setting, tracking and risk detection.


Global OKR and Goal Management Software Market Report Scope
Platforms in the OKR and Goal Management Software market assist organizations in setting, aligning, tracking, and measuring Objectives and Key Results (OKRs) alongside other strategic goals. These tools ensure alignment from overarching strategies down to team and individual outcomes. They offer real-time visibility into progress, analytics, and collaborative workflows. The market features both standalone OKR systems and OKR modules embedded within performance or project management suites.
The OKR and Goal Management Software Market Report is Segmented by Functionality (Tracking and Visualization, Alignment and Collaboration, Performance Analytics, Integrations and Automation, Reporting and Insights, and Other Functionalities), Deployment Type (Cloud-Based, and On-Premises), Organization Size (Small and Medium Enterprises [SMEs], and Large Enterprises), Industry Vertical (IT and Telecommunications, BFSI, Healthcare and Life Sciences, Manufacturing, Retail and eCommerce, and Other Industry Verticals), and Geography (North America, South America, Europe, Asia-Pacific, Middle East, and Africa). The Market Forecasts are Provided in Terms of Value (USD).
| Tracking and Visualization |
| Alignment and Collaboration |
| Performance Analytics |
| Integrations and Automation |
| Reporting and Insights |
| Other Functionalities |
| Cloud-Based |
| On-Premises |
| Small and Medium Enterprises (SMEs) |
| Large Enterprises |
| IT and Telecommunications |
| BFSI |
| Healthcare and Life Sciences |
| Manufacturing |
| Retail and eCommerce |
| Other Industry Verticals |
| North America | United States |
| Canada | |
| Mexico | |
| South America | Brazil |
| Argentina | |
| Rest of South America | |
| Europe | Germany |
| United Kingdom | |
| France | |
| Italy | |
| Spain | |
| Russia | |
| Rest of Europe | |
| Asia-Pacific | China |
| India | |
| Japan | |
| South Korea | |
| Australia and New Zealand | |
| Rest of Asia-Pacific | |
| Middle East | Saudi Arabia |
| United Arab Emirates | |
| Turkey | |
| Rest of Middle East | |
| Africa | South Africa |
| Nigeria | |
| Rest of Africa |
| By Functionality | Tracking and Visualization | |
| Alignment and Collaboration | ||
| Performance Analytics | ||
| Integrations and Automation | ||
| Reporting and Insights | ||
| Other Functionalities | ||
| By Deployment Type | Cloud-Based | |
| On-Premises | ||
| By Organization Size | Small and Medium Enterprises (SMEs) | |
| Large Enterprises | ||
| By Industry Vertical | IT and Telecommunications | |
| BFSI | ||
| Healthcare and Life Sciences | ||
| Manufacturing | ||
| Retail and eCommerce | ||
| Other Industry Verticals | ||
| By Geography | North America | United States |
| Canada | ||
| Mexico | ||
| South America | Brazil | |
| Argentina | ||
| Rest of South America | ||
| Europe | Germany | |
| United Kingdom | ||
| France | ||
| Italy | ||
| Spain | ||
| Russia | ||
| Rest of Europe | ||
| Asia-Pacific | China | |
| India | ||
| Japan | ||
| South Korea | ||
| Australia and New Zealand | ||
| Rest of Asia-Pacific | ||
| Middle East | Saudi Arabia | |
| United Arab Emirates | ||
| Turkey | ||
| Rest of Middle East | ||
| Africa | South Africa | |
| Nigeria | ||
| Rest of Africa | ||


Key Questions Answered in the Report
What is the current OKR and goal management software market size and growth outlook?
The OKR and goal management software market size stands at USD 2.65 billion in 2026 and is projected to reach USD 4.38 billion by 2031, reflecting a 10.59% CAGR over 2026-2031, according to Mordor Intelligence.
Which functionality segment is expanding fastest in OKR platforms?
Integrations and Automation is forecast to grow at a 12.01% CAGR to 2031, as firms prioritize seamless data flows over standalone dashboards.
Why are SMEs adopting OKR tools more rapidly than large enterprises?
Usage-based pricing, self-serve onboarding and AI coaching have lowered complexity and cost barriers, driving a 13.22% CAGR among SMEs through 2031.
How do data-sovereignty rules influence deployment choices?
Regulations such as GDPR and PIPL keep 67.41% of deployments on-premises in 2025, but certified regional clouds and hybrid options are accelerating cloud growth at 12.89% CAGR.
Which vertical is expected to see the fastest OKR adoption and why?
Healthcare and Life Sciences will advance at an 11.65% CAGR, because value-based care links reimbursement to measurable outcomes that OKR frameworks track.
Page last updated on:


