United States Productivity Management Software Market Size and Share
Market Overview
| Study Period | 2019 - 2030 |
|---|---|
| Forecast Data Period | 2025 - 2030 |
| Historical Data Period | 2019 - 2023 |
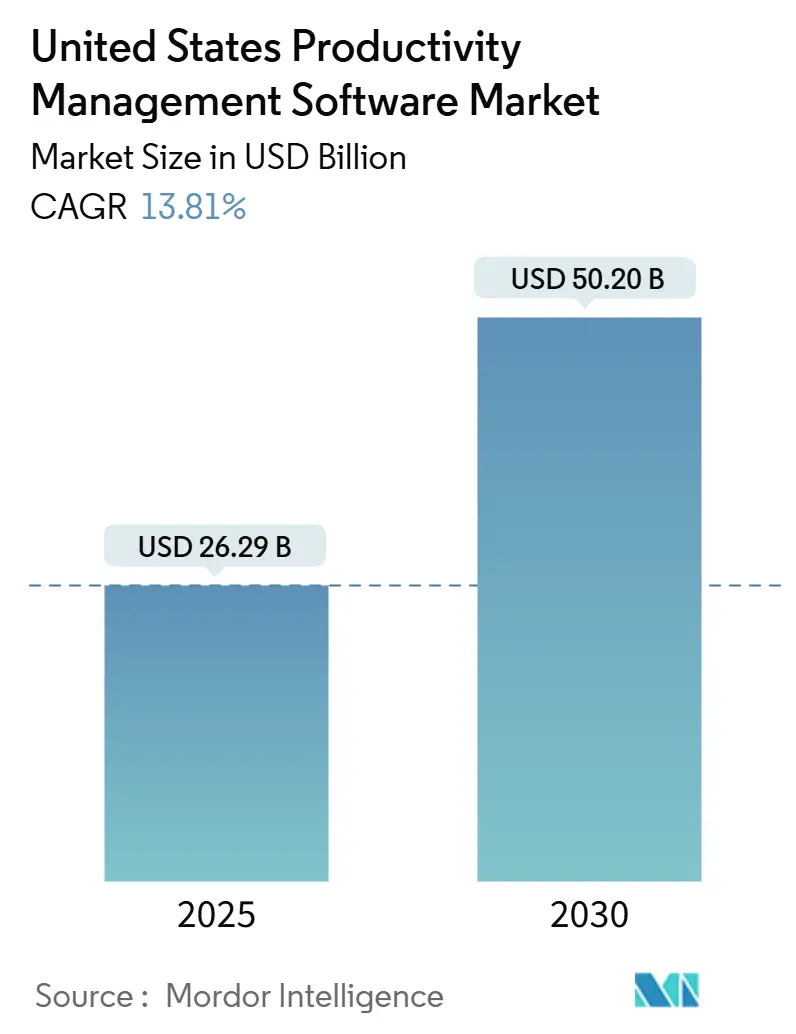
| Market Size (2025) | USD 26.29 Billion |
| Market Size (2030) | USD 50.20 Billion |
| Growth Rate (2025 - 2030) | 13.81% CAGR |
| Market Concentration | Medium |
Major Players *Disclaimer: Major Players sorted in no particular order Image © Mordor Intelligence. Reuse requires attribution under CC BY 4.0. | |
United States Productivity Management Software Market Analysis by Mordor Intelligence
The United States productivity management software market size was USD 26.29 billion in 2025 and is forecasted to reach USD 50.20 billion by 2030, representing a 13.81% CAGR over the period. This expansion mirrors employers' urgency to orchestrate distributed workforces, resolve talent constraints, and embed data-driven routines that outgrow legacy project platforms. Cloud-native deployment holds clear sway, aided by FedRAMP momentum and vendor innovation in real-time collaboration. Small and medium-sized enterprises intensify demand because low-code automation enables them to mimic the process rigor of larger peers without adding headcount. Function mix is also shifting as firms channel budgets from basic task tracking toward AI-infused business intelligence that flags bottlenecks before they derail timelines. Lastly, compliance obligations-from HIPAA to SEC rule updates are nudging buyers toward platforms that embed audit trails and granular permission controls.
Key Report Takeaways
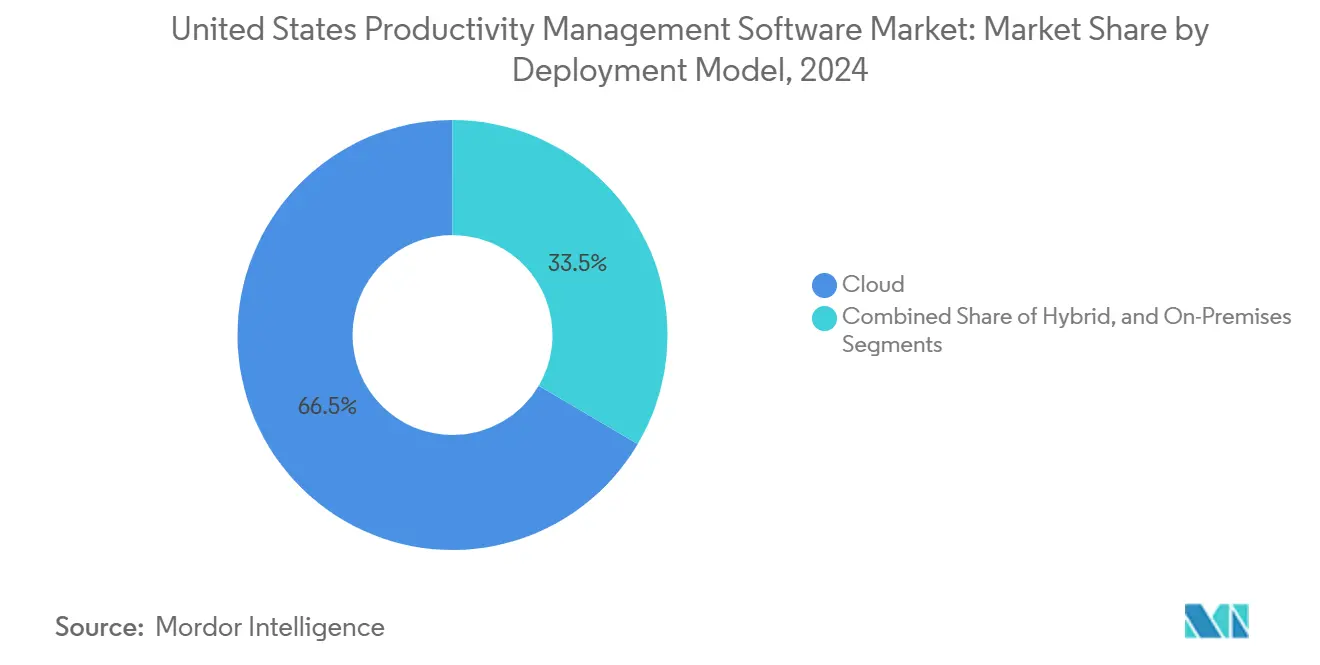
- By deployment model, cloud solutions captured a 66.54% revenue share in 2024; hybrid architectures are projected to log the fastest growth rate of 14.92% from 2024 to 2030.
- By organization size, SMBs commanded 63.41% of the United States productivity management software market share in 2024, while the same segment is poised to expand at a 15.11% CAGR through 2030.
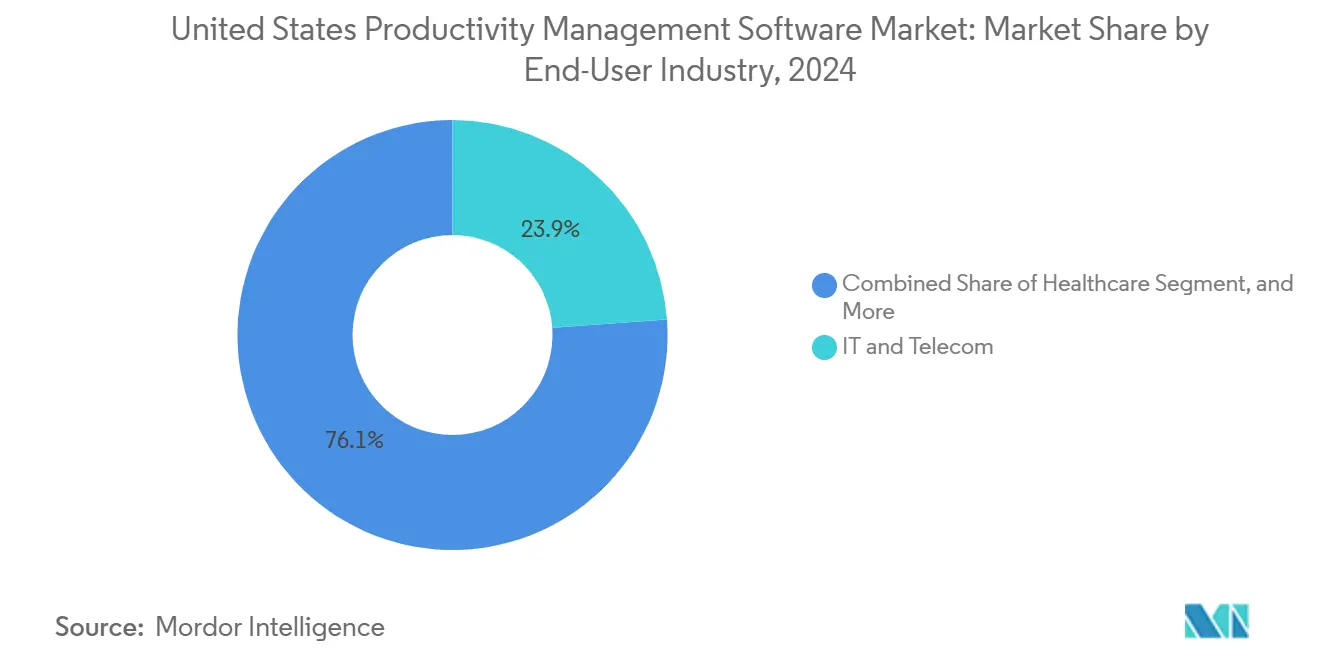
- By end-user industry, IT and telecom held 23.86% share of the United States productivity management software market size in 2024, whereas healthcare is advancing at a 13.88% CAGR.
- By functionality, project and task management retained 37.74% of the United States productivity management software market size in 2024; business intelligence and reporting is on track for a 13.97% CAGR to 2030.
- By region, the South accounted for 34.63% of the United States productivity management software market share in 2024, and the West is projected to post a 14.23% CAGR through 2030.
United States Productivity Management Software Market Trends and Insights
Drivers Impact Analysis*
| Driver | (~) % Impact on CAGR Forecast | Geographic Relevance | Impact Timeline |
|---|---|---|---|
| Accelerated cloud-native adoption | +2.8% | National, West and Northeast focus | Medium term (2-4 years) |
| Hybrid and remote work model shift | +3.2% | National, metro hubs | Short term (≤ 2 years) |
| AI-powered productivity analytics | +2.5% | West and Northeast | Medium term (2-4 years) |
| Low-code automation uptake in SMBs | +2.1% | South and Midwest | Short term (≤ 2 years) |
| Compliance-driven transparency needs | +1.9% | Regulated industries | Long term (≥ 4 years) |
| Vertical-specific workflow templates | +1.7% | Healthcare and BFSI | Medium term (2-4 years) |
| Source: Mordor Intelligence | |||
Hybrid and Remote Work Model Shift
Hybrid arrangements have evolved from stopgap to permanent policy, with 67% of professionals now splitting their time between the office and home, a trend that has raised expectations for asynchronous communication, file co-authoring, and schedule visibility.[1]Thomson Reuters, “Future of Professionals Report 2024,” thomsonreuters.com Firms deploying unified productivity suites recorded a 19% faster project completion and cut meeting minutes by 31%. These improvements were traced to centralized task boards and auto-generated status updates. The urge to protect employee well-being also favors platforms that throttle notifications after hours and offer mobile offline modes. Metropolitan hubs, from New York to San Francisco, are proving grounds because knowledge labor density accelerates feedback loops that refine features. Vendors that surface team sentiment analytics without intrusive tracking gain a competitive edge, particularly among regulated clients who must balance transparency with privacy. Growth prospects remain solid for providers who integrate seamless video, chat, and task management into a single interface.
Accelerated Cloud-Native Adoption
Public cloud credentials have become table stakes as enterprises relocate workloads; FedRAMP filings for collaboration software topped 2,000 in 2024, underscoring the federal appetite for secure cloud options.[2]Asana Inc., “Q3 FY2025 Financial Results,” asana.com Migration resulted in documented productivity upticks of 23%, primarily through reduced context switching and anytime mobile access. Once on cloud rails, vendors roll out rapid feature updates, shortening cycles from quarterly to bi-weekly, which entrenches usage. Traditional on-premises incumbents confront attrition unless they pivot to SaaS or hybrid pathways. Regional cloud spend is highest on the West Coast, though Southern states are narrowing gaps as hyperscaler data centers proliferate. Over the medium term, certifications such as SOC 2 and ISO 27001 will further influence provider selection, creating a competitive advantage for suppliers that continually invest in compliance infrastructure.
AI-Powered Productivity Analytics
Seventy-five percent of large U.S. organizations embedded AI in at least one productivity workflow during 2024, and 42% reported measurable efficiency gains within half a year. Atlassian’s Rovo release shows how natural language queries and knowledge graphs shorten search time for historical project artifacts.[3]Atlassian Corporation, “Q1 FY2025 Earnings Results,” atlassian.com Predictive scheduling now flags overdue milestones days in advance, while auto-classification directs tasks to the most suitable employee, reducing rework. Data-network effects snowball because performance models refine with every completed project, boosting customer lock-in. Security-centric buyers demand explainable AI, spurring vendors to publish model lineage and bias audits. Midsize enterprises adopt AI at a measured pace yet still gravitate toward platforms that bundle out-of-the-box, prescriptive recommendations, which do not require in-house data scientists.
Low-Code Automation Uptake in SMBs
Subscription pricing and visual workflow builders collapse technical barriers, letting smaller firms automate approvals, invoice routing, and customer onboarding without writing code. SMBs deploying low-code functionality reported 35% faster cycle times for core processes, a benefit that is particularly pronounced in regions with a tight labor supply, such as the South. Template libraries lower learning curves, while marketplace connectors integrate accounting, CRM, and support tools. Vendors court reseller networks to broaden their reach because SMB buying journeys often rely on local solution partners. Competition intensifies around usage-based tiers that scale predictably with headcount, sidestepping capex. Over the short term, platforms that couple low-code with AI suggestions will widen the lead by automating rule creation and spotlighting bottlenecks.
Restraints Impact Analysis*
| Restraint | (~) % Impact on CAGR Forecast | Geographic Relevance | Impact Timeline |
|---|---|---|---|
| Data privacy and security concerns | -1.8% | Regulated industries | Medium term (2-4 years) |
| High switching costs from legacy tools | -2.3% | Large enterprises | Long term (≥ 4 years) |
| Market saturation among generalist vendors | -1.4% | Mid-market segment | Short term (≤ 2 years) |
| Fragmented cross-platform standards | -1.1% | Multi-vendor setups | Medium term (2-4 years) |
| Source: Mordor Intelligence | |||
Data Privacy and Security Concerns
Granular activity logging, although vital for transparency, raises alarms about employee surveillance and data residency. The EU Data Act’s extraterritorial reach now extends to U.S. vendors that process data of European citizens, obliging them to adhere to strict consent and transfer controls. Financial and healthcare buyers add several months of penetration testing and policy review before go-live, stretching sales cycles. Data localization rules prompt hybrid deployments, ensuring sensitive records remain on-premises and limiting SaaS revenue potential. Workforce backlash is another hurdle: 34% of firms reported pushback when tooling seemed intrusive. Vendors that champion privacy-by-design, including default anonymization and role-based dashboards, are better positioned to calm stakeholder unease.
High Switching Costs From Legacy Project Tools
Enterprises often sink USD 150,000-USD 500,000 into migration budgets that cover historical data mapping, custom integration rewrites, and user training. The parallel operation of old and new systems prolongs payback periods and strains IT resources. Custom scripts embedded in legacy on-premises platforms complicate export routines, especially when workflows are tied to proprietary ERP modules. Executive reluctance grows if previous transformation initiatives overshot timelines or budgets. To ease the burden, vendors bundle dedicated migration teams and API utilities that replicate configurations in days rather than weeks. Even so, conservative sectors such as utilities and defense may defer transition until end-of-life deadlines force action, dampening near-term topline growth.
*Our forecasts treat driver/restraint impacts as directional, not additive. The impact forecasts reflect baseline growth, mix effects, and variable interactions.
Segment Analysis
By Deployment Model: Cloud Commands Scale, Hybrid Builds Trust
Cloud accounted for 66.54% of 2024 revenue, reflecting trust in elastic capacity and the security certifications amassed by hyperscalers. Hybrid options, however, clock a 14.92% CAGR, becoming the next inflection point in the United States productivity management software market, as they preserve on-premises data governance while unlocking cloud analytics. The United States productivity management software market size for hybrid deployments is expected to expand significantly between 2025 and 2030, driven by hospital systems and financial institutions that must segregate regulated datasets.
Vendor roadmaps increasingly offer portable micro-services that let administrators migrate workloads workload-by-workload, trimming downtime. Success stories from federal agencies adopting hybrid FedRAMP-authorized stacks provide reassurance to late adopters. For their part, pure on-premises suites continue to fade except in classified environments. Competitive stakes will hinge on how deftly suppliers package unified billing, single sign-on, and cross-environment monitoring dashboards.


By Organization Size: SMB Dominance Reshapes Go-to-Market
SMBs held a 63.41% share in 2024, yet also recorded the fastest 15.11% CAGR, a rarity within enterprise software domains. That double achievement underscores how cost-effective subscription tiers and marketplace integrations unlock enterprise-grade workflows for small teams. The United States productivity management software market share attributable to SMBs is large enough that vendors craft dedicated support channels and community forums, ensuring a quick onboarding process.
Large organizations are concentrating their spending on AI augmentation and deep analytics, rather than relying solely on seat licenses, which is nudging suppliers toward outcome-driven pricing or value-based bundles. Channel partners that understand SMB pain points-such as bookkeeping automation or customer ticket routing- achieve higher attach rates. The SMB wave is strongest in the South and Midwest, where traditional manufacturing, construction, and professional services firms are looking to digitize without inflating payroll.
By End-User Industry: Healthcare Surges on Compliance and Care Complexity
IT and telecom accounted for 23.86% of the 2024 revenue, driven by agile product sprints and globally distributed DevOps teams. Healthcare, however, is projected to post a 13.88% CAGR through 2030, giving it the fastest growth in the United States productivity management software market. Clinical trial coordination, HIPAA reporting, and telehealth scheduling demand secure yet flexible workflow engines, areas where horizontal vendors create industry templates or partner with health-tech specialists.
BFSI buyers prioritize audit trails and SOC 2 mapping while retail companies lean on inventory and promotional calendar alignment. Manufacturing adoption centers on supply chain visibility and quality loops. Education-sector uptake rises as universities blend research project orchestration with administrative digitization. Government demand grows steadily following cloud policy overhauls that favor commercial off-the-shelf SaaS, so long as FedRAMP high baselines are met.
By Functionality: Intelligence Takes Center Stage
Project and task management still accounts for 37.74% of the 2024 value, solidifying its role as the anchor module. Yet, business intelligence and reporting is pacing a 13.97% CAGR, lifting its contribution to the United States' productivity management software market size at the segment level. Organizations are now pivoting from tracking “what happened” to predicting “what will happen,” fueling spending on dashboards that correlate effort with revenue or risk.
Vendors incorporate AI suggestions into reports, highlighting resource imbalances or the probability of a timeline slip. Time tracking remains essential in consulting because accurate logs drive billing accuracy. Resource planning draws interest from capital projects in construction and utilities, where material and crew sequencing determine margin. Collaboration features are no longer differentiators; they must exist, but rarely sway decisions unless paired with document co-authoring and version history.
Geography Analysis
Regional performance differences largely mirror local industry mixes. Southern states combine manufacturing, logistics, and growing technology corridors, which together absorb licenses for project sequencing, resource allocation, and compliance tracking. Technology workforces moving from coastal metros are driving buyer sophistication, prompting vendors to balance robust features with affordable tiers. The South maintained a 34.63% revenue share in 2024 due to its diversified industry presence and ongoing corporate relocations seeking lower operating costs. At the same time, the West enjoys a 14.23% CAGR that reins in any notion of saturation. Tech-centric ecosystems around San Francisco and Seattle funnel early feedback to vendors, accelerating iterations that ripple nationwide.
The Northeast relies on financial hubs that hunger for compliance features and low latency. The Midwest sees an upswing as rust-belt manufacturers adopt lean digital playbooks. State incentives for digital transformation, such as tax credits for software purchases, further tilt regional curves. Labor market differences matter too: areas with dense developer pools adopt cutting-edge AI features earlier, whereas regions with tighter talent supply opt for off-the-shelf low-code tools. Western states set the innovation tempo. Frequent product beta programs launch there, and venture capital continues to fund challengers that offer AI co-pilots or context-aware dashboards. Privacy laws in California spur early adoption of privacy-by-design architectures, lessons vendors later roll out elsewhere.
The Northeast and Midwest move at a deliberate pace. Financial institutions in New York deploy granular permission controls to meet SEC oversight requirements. Chicago-centric manufacturers and insurers invest in integration APIs that link productivity data to core policy or plant systems. Universities across both areas embrace grant management templates to smooth multidisciplinary research administration. Across all four regions, state training grants for digital literacy accelerate user adoption, providing fertile ground for the upsell of new modules.
Competitive Landscape
Competitive intensity is moderate. The top cohort-Atlassian, Monday.com, Asana, and Smartsheet-leverages ecosystem breadth and integration depth to defend share. Atlassian reported USD 1.06 billion in quarterly revenue, representing 42% year-over-year cloud growth, which proves that cloud migration remains a key monetization engine. Monday.com’s revenue reached USD 251.1 million in Q2 2024 with AI automation as the prime upsell lever.
Challengers include ClickUp and Notion, both of which have been funded to refine their user experiences and deploy AI-suggested workflow builders. Vertical specialists, especially in healthcare, position themselves by embedding HIPAA compliance checks and pre-configured clinical templates, a route that sidelines generalists lacking domain depth. Vendors also race to publish public APIs and app marketplaces, recognizing that cross-platform interoperability is now a buying criterion.
Strategic alliances emerge as another force: Smartsheet integrated Microsoft Copilot into its UI, ensuring parity in AI capabilities without recreating foundation models in-house. On the M&A front, smaller point-solution makers focused on advanced resource planning are likely targets because incumbents seek bolt-on differentiation while guarding against feature creep. Pricing rivalry is shifting toward seat-plus-usage hybrids, rewarding suppliers who can tie costs to measurable business outcomes.
United States Productivity Management Software Industry Leaders
Atlassian Corporation Public Limited Company
Asana Inc.
Monday.com Ltd.
Smartsheet Inc.
Wrike, Inc.
- *Disclaimer: Major Players sorted in no particular order

Recent Industry Developments
- September 2025: Atlassian recorded Q3 FY2025 revenue of USD 1.19 billion, a 23% year-over-year jump, as cloud migrations and the AI-driven Rovo platform lifted enterprise demand for integrated productivity and knowledge tools.
- August 2025: Monday.com bought Craft Docs for USD 180 million, adding document creation features that strengthen its position against Notion and Confluence in the all-in-one workspace market.
- October 2025: Asana introduced its Advanced AI package that flags project risks and balances resource loads, giving large teams earlier warnings and smoother delivery.
- July 2025: Smartsheet released workflow templates tailored to healthcare and manufacturing, bundling built-in compliance checks that shorten setup time for regulated users.


United States Productivity Management Software Market Report Scope
| Cloud |
| On-Premises |
| Hybrid |
| Small and Medium Enterprises |
| Large Enterprises |
| BFSI |
| Healthcare |
| Retail and E-Commerce |
| Manufacturing |
| IT and Telecom |
| Education |
| Government |
| Other End-User Industries |
| Project and Task Management |
| Time Tracking |
| Resource Planning |
| Business Intelligence and Reporting |
| Collaboration |
| Other Functionality |
| By Deployment Model | Cloud |
| On-Premises | |
| Hybrid | |
| By Organization Size | Small and Medium Enterprises |
| Large Enterprises | |
| By End-User Industry | BFSI |
| Healthcare | |
| Retail and E-Commerce | |
| Manufacturing | |
| IT and Telecom | |
| Education | |
| Government | |
| Other End-User Industries | |
| By Functionality | Project and Task Management |
| Time Tracking | |
| Resource Planning | |
| Business Intelligence and Reporting | |
| Collaboration | |
| Other Functionality |


Key Questions Answered in the Report
How large will the United States productivity management software market be in 2030?
The market is projected to hit USD 50.20 billion in 2030, reflecting a 13.81% CAGR from 2025.
Which deployment option is growing fastest?
Hybrid deployment is set to expand at 14.92% CAGR as firms balance cloud scalability with on-premises data control.
Why are SMBs critical to near-term demand?
SMBs already hold more than 60% share and their 15.11% CAGR shows they view low-code automation as a route to enterprise-level efficiency without major IT staffing.
What functionality is picking up spending momentum?
Business intelligence and reporting modules are pacing a 13.97% CAGR because executives want predictive insight rather than retrospective status.
Which industry vertical is projected to grow quickest?
Healthcare is forecast for a 13.88% CAGR, underpinned by HIPAA compliance needs and telehealth workflow complexity.
How are vendors differentiating offerings?
Providers are embedding AI for predictive scheduling, surfacing contextual insights, and packaging vertical templates that accelerate regulated-sector onboarding.
Page last updated on:


