
Project Management Software Systems Market Size and Share
Market Overview
| Study Period | 2020 - 2031 |
|---|---|
| Market Size (2026) | USD 11.27 Billion |
| Market Size (2031) | USD 23.09 Billion |
| Growth Rate (2026 - 2031) | 15.42 % |
| Fastest Growing Market | Asia-Pacific |
| Largest Market | North America |
| Market Concentration | Medium |
Major Players *Disclaimer: Major Players sorted in no particular order Image © Mordor Intelligence. Reuse requires attribution under CC BY 4.0. | |
Project Management Software Systems Market Analysis by Mordor Intelligence
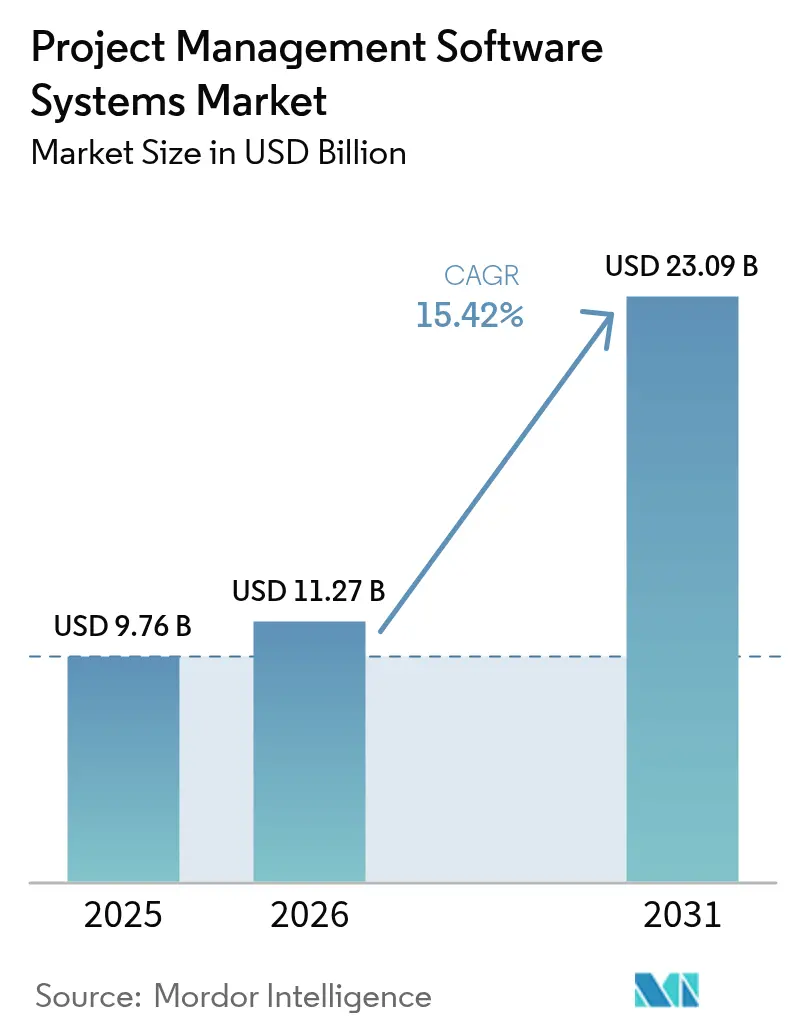
The project management software systems market size was valued at USD 9.76 billion in 2025 and estimated to grow from USD 11.27 billion in 2026 to reach USD 23.09 billion by 2031, at a CAGR of 15.42% during the forecast period (2026-2031). Expansion remains anchored in cloud-first deployment, low-code configurability, and predictive analytics that collectively upgrade project oversight from task tracking to strategic orchestration. Demand intensifies as distributed teams require real-time collaboration, and enterprises integrate project data with finance, HR, and customer systems for unified visibility. Hybrid deployment registers the fastest growth because regulated industries still need local data control. Small and medium enterprises (SMEs) accelerate adoption by bypassing traditional implementation hurdles, while AI-native features strengthen risk management and cost forecasting. Competitive intensity increases as vendors embed industry-specific workflows and open API ecosystems.
Key Report Takeaways
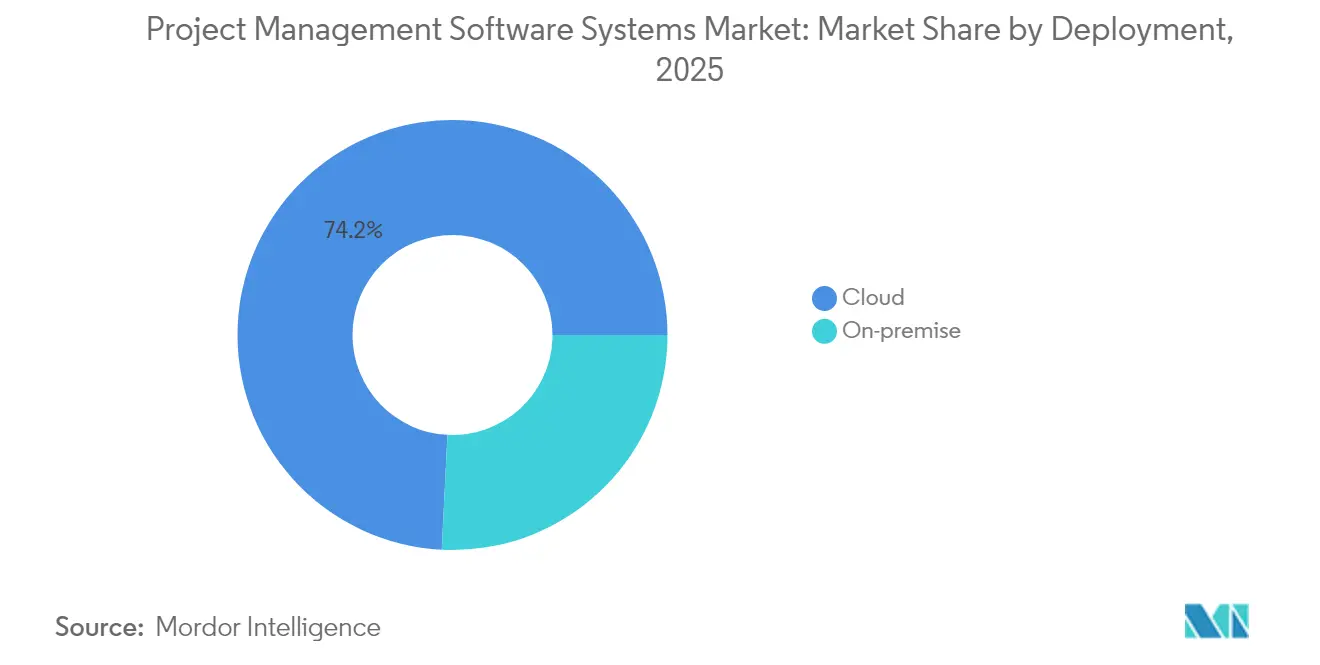
- By deployment, cloud services held 74.20% of the project management software systems market share in 2025, whereas hybrid models posted the highest 18.12% CAGR through 2031.
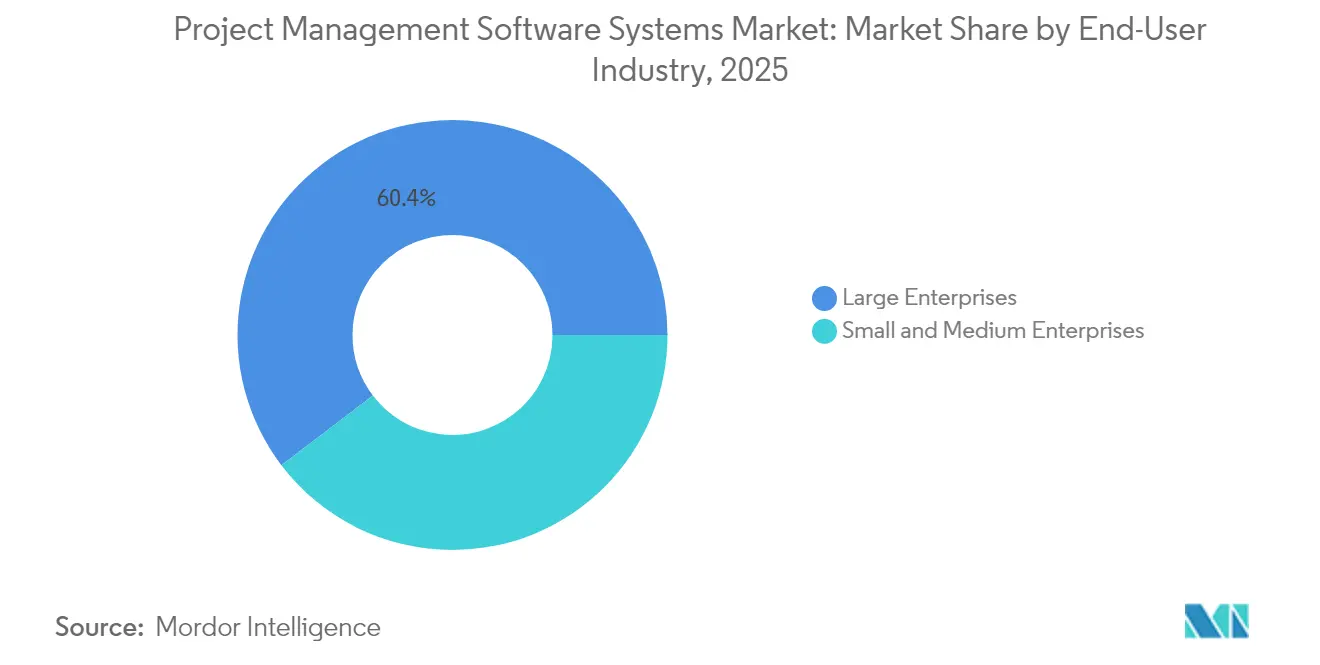
- By organization size, large enterprises represented 60.35% of revenue in 2025, while SMEs expand at a 16.89% CAGR.
- By end-user industry, IT and telecom led with 28.15% revenue in 2025; healthcare grows fastest at 15.85% CAGR to 2031.
- By subscription type, annual plans captured 52.75% of revenue in 2025, outpacing other contract options.
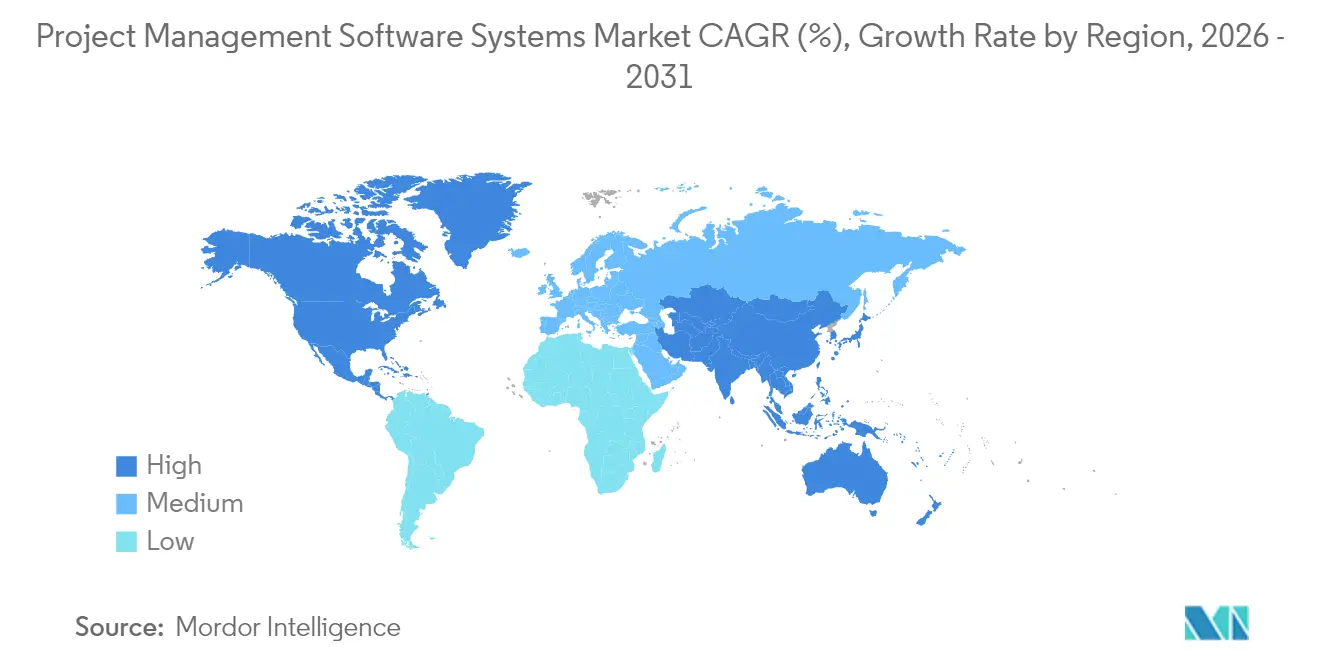
- By geography, North America commanded a 36.12% market share of project management software systems market in 2025, while the Asia-Pacific region registered the strongest 16.06% CAGR through 2031.
Note: Market size and forecast figures in this report are generated using Mordor Intelligence’s proprietary estimation framework, updated with the latest available data and insights as of 2026.
Market Trends and Insights
Drivers Impact Analysis of Project Management Software Systems Market*
| Driver | (~) % Impact on CAGR Forecast | Geographic Relevance | Impact Timeline |
|---|---|---|---|
| Cloud-first adoption for remote and hybrid teams | +3.2% | North America, Europe | Short term (≤ 2 years) |
| Integration of PM platforms with SaaS stacks | +2.8% | North America, Asia-Pacific | Medium term (2-4 years) |
| SME uptake through low-code configurability | +2.1% | Asia-Pacific, Latin America | Medium term (2-4 years) |
| AI-driven predictive analytics | +1.9% | North America, Europe | Long term (≥ 4 years) |
| Vertical-specific PM suites | +1.4% | Global | Medium term (2-4 years) |
| ESG compliance reporting | +0.8% | Europe, North America | Long term (≥ 4 years) |
| Source: Mordor Intelligence | |||
Cloud-First Adoption for Remote and Hybrid Project Teams
Organizations report 54% faster task completion when shifting from desktop tools to cloud-native platforms.[1]Dustin Moskovitz, “Work Innovation at Scale,” asana.com The project management software systems market gains traction because real-time synchronization enables distributed teams to sustain momentum across time zones. IT departments prefer cloud scalability that removes capacity planning burdens. Hybrid models are projected to grow at an 18.4% CAGR because regulated sectors balance accessibility with data control. Vendors respond by offering data-residency options that satisfy sovereignty mandates while maintaining friction-free collaboration.
Integration of PM Platforms with Enterprise SaaS Stacks
Enterprises run an average of 976 applications, yet only 28% are meaningfully integrated, stalling project data flow. Modern platforms position themselves as integration hubs tied to finance, CRM, and HR systems, thereby increasing the relevance of project management software systems in enterprise architecture. The SaaS integration segment is projected to exceed USD 15 billion by 2025, and firms that deploy comprehensive integration strategies report 30% productivity lifts. Cloud-native vendors gain an advantage through open APIs and pre-built connectors, which reduce the need for expensive custom coding.
SME Uptake Boosted by Low-Code / No-Code Configurability
Low-code builders eliminate months-long implementations, allowing SMEs to launch in weeks and align spend with cash cycles. The shift democratizes advanced features once exclusive to large enterprises, propelling SME demand within the project management software systems market. Asia-Pacific SMEs adopt aggressively as the manufacturing and services sectors digitize. Vendors streamline onboarding through guided templates that maintain enterprise-grade depth when required.
AI-Driven Predictive Analytics for Schedule and Cost Variance
Eighty-two percent of executives expect AI to reinvent project management within five years. Algorithms surface early-stage schedule slips and budget overruns so managers act proactively. Construction projects using AI cost tracking save 5-10% on materials by intercepting errors. Early deployments reside in North America and Europe because data quality and analytics talent are prerequisites, but broader adoption will follow as packaged AI modules reach mid-market buyers.
Restraints Impact Analysis of Project Management Software Systems Market*
| Restraint | (~) % Impact on CAGR Forecast | Geographic Relevance | Impact Timeline |
|---|---|---|---|
| High migration and customization costs | -2.4% | Global | Short term (≤ 2 years) |
| Data-sovereignty and privacy constraints | -1.8% | Europe, Asia-Pacific | Medium term (2-4 years) |
| Feature commoditization and vendor lock-in | -1.1% | Global | Long term (≥ 4 years) |
| Change-management fatigue | -0.9% | North America, Europe | Medium term (2-4 years) |
| Source: Mordor Intelligence | |||
High Migration and Customization Costs for Legacy Estates
Enterprises face implementation bills that triple license fees because data mapping, validation, and user training are labor-intensive. Migration overruns average 30% and can reach USD 15,000 per terabyte of archives. The hurdle delays refresh cycles and slows the project management software systems market uptake among incumbents with heavily customized workflows.
Data-Sovereignty and Privacy Concerns in Multi-Tenant Clouds
GDPR and region-specific localization rules complicate pure-cloud rollouts, especially in healthcare and finance. Hybrid deployments, therefore, persist as enterprises keep sensitive artifacts on-premise while benefiting from cloud collaboration. Compliance documentation and breach-response planning also raise operating overhead, tempering project management software systems market growth in regulated economies.
*Our forecasts treat driver/restraint impacts as directional, not additive. The impact forecasts reflect baseline growth, mix effects, and variable interactions.
Project Management Software Systems Market Segment Analysis
By Deployment:
Hybrid Models Bridge Security GapsCloud deployment accounted for 74.20% of revenue in 2025, but hybrid configurations grew at an 18.12% CAGR, signaling the strongest momentum within the project management software systems market. Hybrid solutions synchronize local repositories with cloud workspaces; this duality attracts firms bound by data residency statutes. On-premise solutions persist in government and defense, yet their share is shrinking as security certifications for cloud zones become tighter.
The hybrid rise reflects tools that now manage seamless offline sync, encrypted tunnels, and selective storage. Construction companies store drawings on local servers while sharing field updates through cloud dashboards. Vendors differentiate by offering granular tenancy controls, creating upsell paths around compliance.



By Organization Size:
SMEs Drive Market DemocratizationLarge enterprises controlled 60.35% of the 2025 spend, but SMEs chart a 16.89% CAGR, reshaping the project management software systems market size trajectory. Growth centers on the Asia-Pacific region, where local governments are funding digital upskilling grants. Japanese SMEs adopt AI-assisted scheduling to offset labor shortages. Pricing tiers remove user minimums, reducing the barrier to entry.
Enterprise growth plateaus in saturated regions, so vendors launch light editions and community events geared to smaller firms. Yet, multi-national corporations still anchor revenue with complex integrations and premium analytics bundles. Dual focus forces product teams to maintain scalability without complicating the onboarding process.
By End-User Industry:
Healthcare Leads Vertical SpecializationIT and Telecom held 28.15% revenue in 2025, but healthcare posts the fastest 15.85% CAGR, leveraging compliance-ready templates for patient safety and capital projects. Construction follows, motivated by rising material volatility that raises demand for predictive costing. Hospitals deploy Procore to manage USD 3 billion programs and remove manual spreadsheets.
Specialization sparks new bundles: clinical trial tracking modules, Building Information Modeling (BIM) connectors, and ESG reporting dashboards. Vendors partner with regulatory bodies to certify workflows, giving them pricing power and stickier renewals within the project management systems software market.
By Subscription Type:
Annual Models Dominate Enterprise PreferencesAnnual contracts captured 52.75% of 2025 revenue, reflecting the CFO's preference for budget predictability in the project management software systems market. Monthly plans remain popular among startups that need staffing flexibility. One-time licenses fade as perpetual models clash with cloud updates.
Vendors test usage-based overlays that add AI credits or advanced analytics once consumption passes set thresholds. Monday.com grants 500 free credits each month to entice experimentation while preserving transparent add-on rates. Alignment of pricing to value achieved keeps churn low.
Geography Analysis
North America Project Management Software Systems Market
North America held 36.12% of the project management software systems market in 2025. Enterprises there leverage robust infrastructure and sizable IT budgets to roll out end-to-end project ecosystems. Microsoft recorded 16% revenue growth to USD 245 billion in 2024, supported by integrated project functions within Microsoft 365. Innovation hubs continue to pioneer AI modules, yet regional growth moderates as penetration nears saturation.
APAC Project Management Software Systems Market
Asia-Pacific grows at a 16.06% CAGR through 2031, the fastest across regions. China’s SaaS segment is expanding at nearly 30% annually, with multinationals installing integrated Salesforce and Azure stacks to manage cross-border initiatives. India’s SaaS revenue is forecast to increase from USD 7.18 billion in 2023 to USD 62.93 billion by 2032, driven by cloud adoption and startup momentum. SMEs across Southeast Asia adopt local-language PM suites that embed regional compliance norms.
EMEA and South America Project Management Software Systems Market
Europe posts steady gains as GDPR compels localization features, rewarding vendors offering EU data centers and advanced encryption. South America, and Middle East, and Africa are now improving broadband and payment rails, nurturing cloud subscriptions previously held back by infrastructure gaps. Vendors anticipate double-digit uptake once connectivity costs fall further.

Regulatory Landscape
The regulatory environment for project management software systems is increasingly shaped by privacy, security, and AI governance requirements as vendors embed predictive analytics and AI-native features into planning, resourcing, and risk workflows. In the EU, the EU AI Act introduces obligations around risk management, documentation, and human oversight for covered AI systems, which raises demand for audit-ready traces inside project workflows as organizations operationalize AI governance across distributed teams.
Enterprise security and compliance requirements also reinforce secure-by-design delivery and continuous controls across project lifecycles. ISO/IEC 27001 remains a widely used anchor for information security management, and its Annex A 5.8 explicitly calls for information security requirements to be integrated into project management, supporting adoption of built-in access controls, audit logs, and evidence capture within project and portfolio management environments. In the United States, NIST's AI Risk Management Framework (AI RMF) provides a commonly referenced structure (GOVERN, MAP, MEASURE, MANAGE) that drives organizations to document AI-related legal and regulatory requirements at project initiation, which can influence hybrid deployment choices where data sovereignty or regulated artifacts require tighter control.
Value Chain Analysis
The value chain for project management software systems spans core platform development (workflow engines, scheduling, portfolio analytics), cloud infrastructure and identity services, integration layers (APIs, connectors, iPaaS), implementation and change management (systems integrators and consulting), and ongoing operations (support, security monitoring, and training). As enterprises connect project execution to finance, HR, CRM, and DevOps toolchains, vendors and partners increasingly deliver packaged integrations and vertical templates. Marketplaces and pre-built connectors also reduce time-to-value for both large enterprises and SMEs.
In 2026, upstream policy and ecosystem moves strengthened demand for interoperable stacks and sovereign options, including the European Commission's tech sovereignty initiatives and related EU open-source positioning, as well as public-sector digitization governance such as Portugals Decree-Law No. 85/2026 establishing a State Simplification and Technology Network to harmonize public digital procurement and governance. On the product capability side, major platforms have moved toward agentic and AI-assisted workflows that change downstream service needs, such as Atlassian's July 2026 updates introducing capabilities like Jira Planner and a Jira Coding Agent, and IBM's July 2026 enterprise software development updates adding multi-agent capabilities and modernization workflows. These shifts increase the importance of data readiness, governance, and integration services as organizations operationalize AI assistants inside PM and work management processes.
Competitive Landscape
The project management software systems market is moderately fragmented. Microsoft deploys ecosystem leverage across Office, Azure, and Teams. Asana reported USD 188.3 million Q4 2025 revenue and positive free cash flow after launching AI Studio that automates routine workflows. Monday.com focuses on modular AI Blocks and Digital Workforce capabilities aimed at scale deployments. Atlassian maintains dominance with developer-centric Jira integration.
Disruptors like ClickUp, valued at USD 4 billion, bet on unified workspaces that converge docs, chat, and goals. Celoxis introduced Lex, an AI assistant for proactive risk alerts. Specialist players target niches: Procore in construction, Pulsora in ESG data, Suits Inc. in Japan’s SME sector. Acquisition activity rises as incumbents buy vertical features or AI engines to keep pace.
Robust API ecosystems remain decisive because enterprises prize seamless data flow. Platforms with open standards outcompete feature-rich but closed suites, underlining integration as a differentiator in renewal cycles. Pricing innovation, especially consumption-based extensions, further defines competitive posture.
Project Management Software Systems Industry Leaders
Microsoft Corporation
SAP SE
Broadcom Inc. (CA Technologies)
Oracle Corporation
ServiceNow Inc.
- *Disclaimer: Major Players sorted in no particular order

Project Management Software Systems Market Companies Covered in this Report
- Adobe Inc. (Workfront)
- AEC Software Inc.
- Asana Inc.
- Atlassian Corporation PLC
- Basecamp LLC
- Broadcom Inc. (Clarity PPM)
- ClickUp (Mango Technologies, Inc.)
- Microsoft Corporation
- Monday.com Ltd.
- Oracle Corporation
- Planview Inc.
- Procore Technologies Inc.
- SAP SE
- ServiceNow Inc.
- Smartsheet Inc.
- Teamwork.com Ltd.
- Trello Enterprise (Atlassian)
- Unit4 N.V.
- Wrike Inc. (Citrix Systems)
- Zoho Corporation Pvt Ltd.
Read Analysis of Project Management Software Systems Companies

Market Opportunities and Future Outlook
Standardization and governance frameworks are creating whitespace for project management platforms that can package AI oversight, auditability, and repeatable controls into everyday project workflows. In June 2026, the Project Management Institute (PMI) published a global standard for applying AI in portfolio, program, and project management, which provides a concrete reference point for enterprises and public-sector PMOs to formalize AI usage, controls, and accountability. Vendors that translate these requirements into configurable templates (policies, approval gates, risk registers, and evidence capture) can extend beyond task execution into portfolio governance, particularly where hybrid deployment is used to keep sensitive project artifacts under local control.
Public-sector and regulated-industry modernization also supports demand for structured oversight capabilities embedded in PM systems, including repeatable status reporting, audit trails, and cross-tool integration. For example, Florida introduced HB 1197 (2026), with provisions for state agencies to establish IT project management and oversight standards by July 1, 2027, which reinforces the need for standardized controls, dashboards, and governance workflows rather than ad hoc spreadsheets. Alongside these governance signals, enterprises running large SaaS portfolios and fragmented application landscapes continue to prioritize integration hubs and open APIs, creating opportunities for vendors that reduce migration friction, support secure integrations, and offer low-code configuration that SMEs can adopt with less reliance on services.
Recent Industry Developments in Project Management Software Systems Market
- June 2026: SAP announced that Nokia signed a strategic multi-year agreement to advance cloud and AI-driven business transformation using RISE with SAP, with Nokias ERP landscape hosted on Microsoft Azure. The announcement reinforces hyperscaler-aligned enterprise delivery models where project and portfolio governance needs to integrate tightly with ERP and cloud operations, supporting demand for integrated PM workflows across complex transformation programs.
- November 2025: ServiceNow announced new integrations connecting ServiceNow AI Control Tower with Microsoft Foundry and Copilot Studio to improve AI agent collaboration, orchestration, and governance. The move expands cross-platform governance patterns that enterprises can extend into work management and project execution, strengthening vendor ecosystems built around identity, policy controls, and shared auditability.
- May 2024: ServiceNow and Microsoft expanded their strategic alliance to combine generative AI capabilities and enhance enterprise choice and flexibility across their platforms. The expanded partnership elevates integrated workflow automation across front, middle, and back office processes, increasing the importance of PM platforms that can connect project work to broader enterprise service and workflow systems.


Project Management Software Systems Market Report Scope and Research Methodology
Market Definition and Coverage
This market covers revenue generated from software systems used to plan, schedule, assign, collaborate, track time and costs, and report progress across projects and programs, delivered through cloud or on-premise deployment and sold via subscription or license.
Scope exclusions: We exclude general office productivity suites and generic communication tools when they are not sold or positioned as dedicated project management software systems.
Segments Covered in This Report
- By Deployment
- Cloud
- On-premise
- By Organization Size
- Large Enterprises
- Small and Medium Enterprises
- By End-user Industry
- IT and Telecom
- Healthcare
- Construction and Infrastructure
- BFSI
- Government and Public Sector
- Manufacturing
- Others
- By Subscription Type
- Monthly Subscription
- Annual Subscription
- One-time License
- By Geography
- North America
- United States
- Canada
- Mexico
- South America
- Brazil
- Argentina
- Rest of South America
- Europe
- United Kingdom
- Germany
- France
- Italy
- Spain
- Nordics
- Rest of Europe
- Middle East and Africa
- Middle East
- Saudi Arabia
- United Arab Emirates
- Turkey
- Rest of Middle East
- Africa
- South Africa
- Egypt
- Nigeria
- Rest of Africa
- Middle East
- Asia-Pacific
- China
- India
- Japan
- South Korea
- ASEAN
- Australia
- New Zealand
- Rest of Asia-Pacific
- North America
Data Sources, Market Sizing, and Validation
Desk Research
Desk work started by mapping the demand pool and the supply landscape using public sources that can be checked again later. We relied on non-paywalled sources such as the US Bureau of Labor Statistics for employment and wage signals, the US Census Bureau for business and industry statistics, the World Bank and IMF for macro indicators linked to IT spending capacity, and OECD digital economy publications for broad adoption context.
We also used company SEC filings, annual reports, and investor presentations to understand subscription mixes, ARR type disclosures, and pricing moves, and then cross-checked claims using association websites and reputable press coverage on enterprise software budgeting and SaaS procurement. Where needed, we used paid subscriptions for company financials and intelligence, and for news and financials, to fill gaps on private players and recent packaging changes. These examples are not exhaustive, and many other public and paid sources were used for data collection, validation, and clarification during the work.
Primary Interviews and Surveys
Primary work focused on validating what is actually purchased, how it is priced, and which use cases drive renewal versus churn. We spoke with a mix of software vendors, channel partners, implementation and advisory firms, and enterprise and mid-market buyers across key regions, which helped us tighten adoption rates, typical seat counts, and add-on attachment assumptions.
Distribution of primary research fieldwork respondents
| Company type | Respondent position | Region |
|---|---|---|
| Top tier: 26% | CXOs: 20% | APAC: 45% |
| Mid tier: 54% | Functional/Unit leaders: 29% | EMEA: 29% |
| Smaller Players: 20% | Managers: 51% | Americas: 26% |
Market-Sizing & Forecasting
Sizing combined a top-down build from the enterprise software spend pool, reconstructed using region level IT spend, SaaS penetration, and project management tool adoption, and then allocated into this market through pricing and usage signals. To keep totals realistic, we cross-checked the output with selective bottom-up approximations, including sampled average revenue per user per month multiplied by estimated paid seats, and channel checks on typical contract values for SMB and enterprise deals.
Inputs used in the model included cloud versus on-premise mix, average paid seat counts by organization size, renewal rates and churn pressure, typical price ranges by subscription term (monthly versus annual), and the share of buyers taking add-ons like reporting, resource management, and integrations. Forecasting leaned on scenario analysis supported by expert views on enterprise budget cycles, AI feature monetization, and consolidation trends, and then converted into yearly growth paths by region. Where vendor revenue splits were not disclosed, gaps were handled through conservative ranges validated with partner feedback and buyer interviews before finalizing the time series.
Data Validation & Update Cycle
Model outputs were checked against independent signals such as public software spending trends, workforce and project activity indicators, and disclosed revenue trajectories of listed vendors, and then reviewed for outliers at region and deployment level. When variance appeared too high, assumptions were revisited and experts were re-contacted to confirm whether the change was real or caused by inconsistent definitions.
Before sign-off, the work goes through multi-step analyst reviews so inputs, arithmetic, and scope alignment are verified in a repeatable way. Reports are refreshed annually, with interim updates triggered by material events like major pricing changes, platform bundling shifts, or large demand shocks. Right before delivery, a final pass is completed so clients receive the most current view available.
Mordor Intelligence's Project Management Software Systems Market Size Compared With Other Published Estimates
Different publishers can show different market sizes even when they use similar words, since software scope, revenue recognition, and the year used for reporting often shift the final totals. Variation also comes from how cloud subscriptions are annualized, how services are treated, and whether estimates are updated after major pricing and packaging changes.
Implementation and managed services revenues sit outside Mordor Intelligence's scope, which reduces totals versus sources that combine software subscriptions with delivery support in the same figure. Differences also come from how paid seat growth is assumed for SMB cohorts, and from whether platform bundles are fully attributed to project management instead of being partially allocated.
Benchmark comparison
| Source | Market Size | Gaps in Research Methodology |
|---|---|---|
| Mordor Intelligence | USD 11.27 B (2026) | |
| Global Consultancy A | USD 10.51 B (2026) | Uses a different revenue recognition timing for multi-year subscriptions and may carry a more conservative cloud penetration assumption for large enterprises, which can pull down the 2026 value. |
| Industry Publisher B | USD 12.24 B (2026) | Assumes faster expansion in paid seats and stronger ASP uplift, and it may count broader work-management modules as fully in-scope rather than limiting to dedicated project management software systems. |
The spread across the three figures is mainly explained by software-only versus software-plus-services treatment, and by how quickly usage and pricing are expected to rise. When the same inputs are applied consistently by region and buyer size, the final number stays easy to trace back to clear, repeatable steps.


Key Questions Answered in the Report
What is the projected value of the project management software systems market by 2031?
The market is forecast to reach USD 23.09 billion by 2031.
Which deployment model is growing fastest?
Hybrid deployment is expanding at an 18.12% CAGR as firms balance cloud access with data sovereignty needs.
Why are SMEs adopting project management platforms more quickly than before?
Low-code configurability now lets non-technical teams deploy and tailor solutions in weeks, removing historical cost and complexity barriers.
Which industry vertical shows the highest growth through 2031?
Healthcare leads with a 15.85% CAGR due to stringent regulatory requirements and complex capital projects.
Page last updated on:





