
Task Management Software Market Size and Share
Market Overview
| Study Period | 2020 - 2031 |
|---|---|
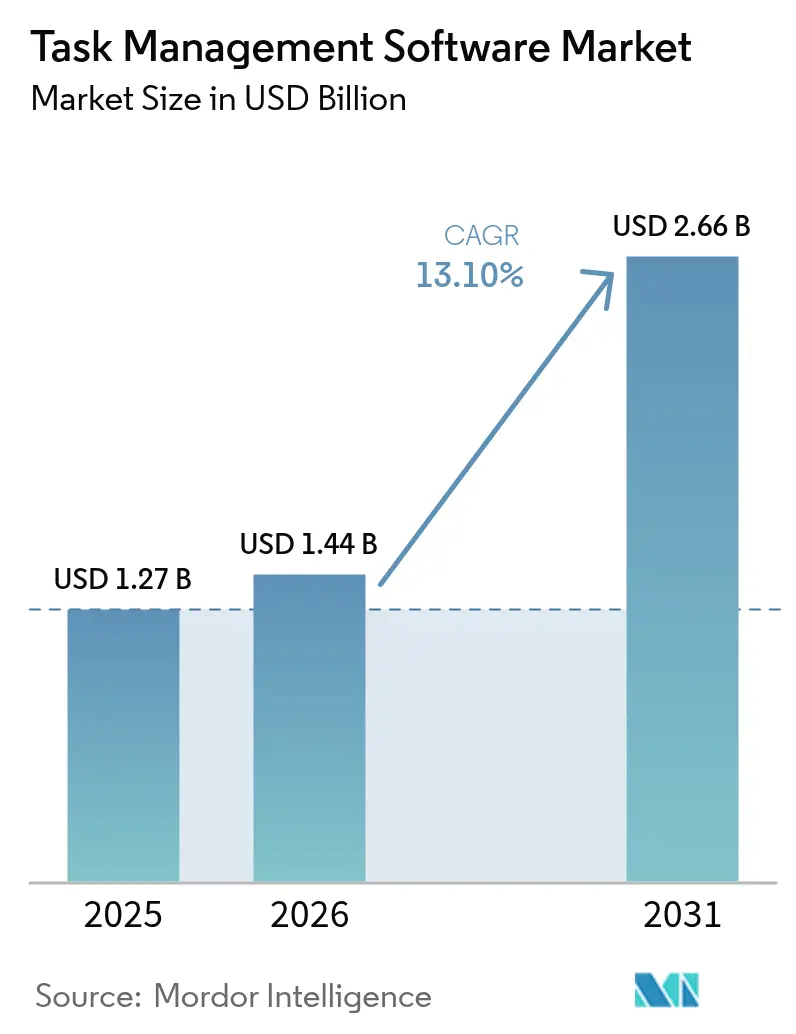
| Market Size (2026) | USD 1.44 Billion |
| Market Size (2031) | USD 2.66 Billion |
| Growth Rate (2026 - 2031) | 13.10 % |
| Fastest Growing Market | Asia Pacific |
| Largest Market | North America |
| Market Concentration | Medium |
Major Players *Disclaimer: Major Players sorted in no particular order Image © Mordor Intelligence. Reuse requires attribution under CC BY 4.0. | |
Task Management Software Market Analysis by Mordor Intelligence
The Task Management Software Market size was valued at USD 1.27 billion in 2025 and estimated to grow from USD 1.44 billion in 2026 to reach USD 2.66 billion by 2031, at a CAGR of 13.1% during the forecast period (2026-2031). Rapid cloud adoption by small and medium enterprises, the embedding of generative AI, and the convergence with low-code automation are expanding platform functionality and addressable use cases. Vendors are bundling task orchestration features with collaboration suites, creating sticky ecosystems that lower churn. Services revenue is accelerating because enterprises need integration and change-management expertise to unlock platform value. Regulatory pressure on data residency is reshaping deployment economics, yet the task management software market continues to benefit from hybrid work permanence and vertical-specific template proliferation.
Key Report Takeaways
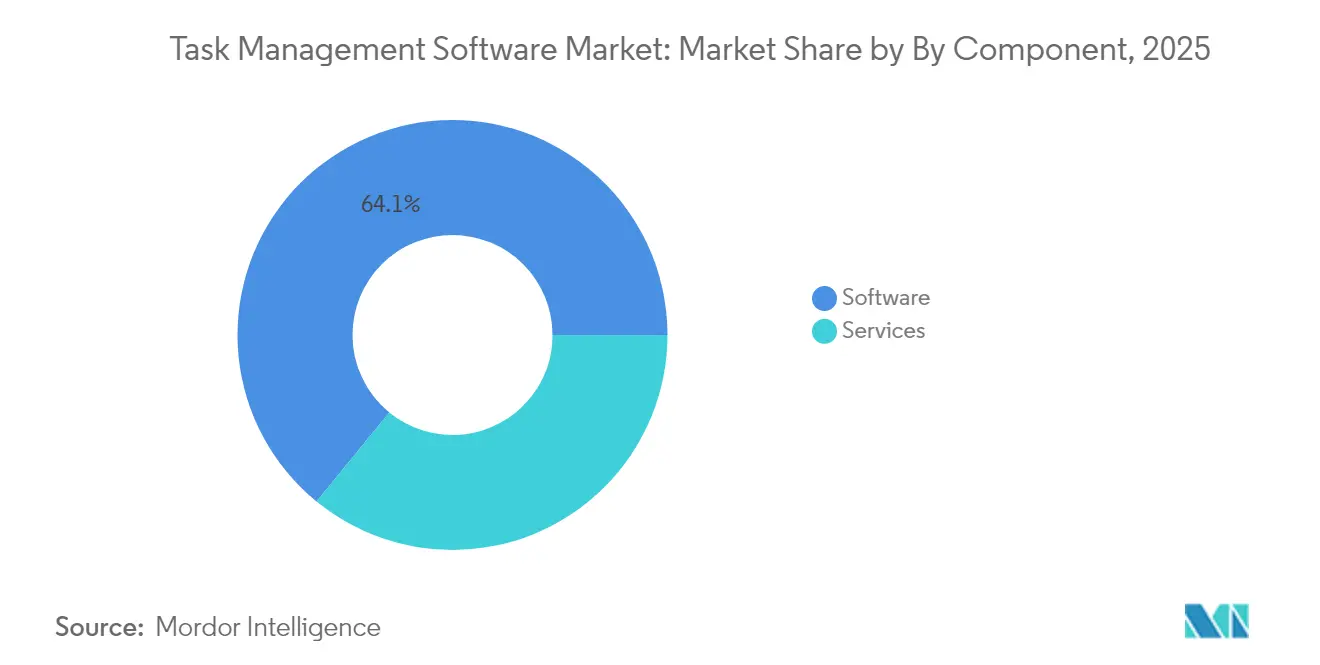
- By component, managed services grew 16.8% CAGR to 2031, annually and are expected to continue outpacing overall task management software market growth. Software packages still represented 64.10% revenue in 2025.
- By organization size, large enterprises captured 54.60% 2025 revenue due to complex program portfolios that demand robust reporting, single sign-on, and granular permissions. Nonetheless, SMEs will expand at a 14.1% CAGR through 2031.
- By deployment mode, cloud maintained a 77.10% 2025 share because browser-based access and continuous updates remain essential for distributed teams. The hybrid segment is on a 15.6% CAGR trajectory, through 2031.
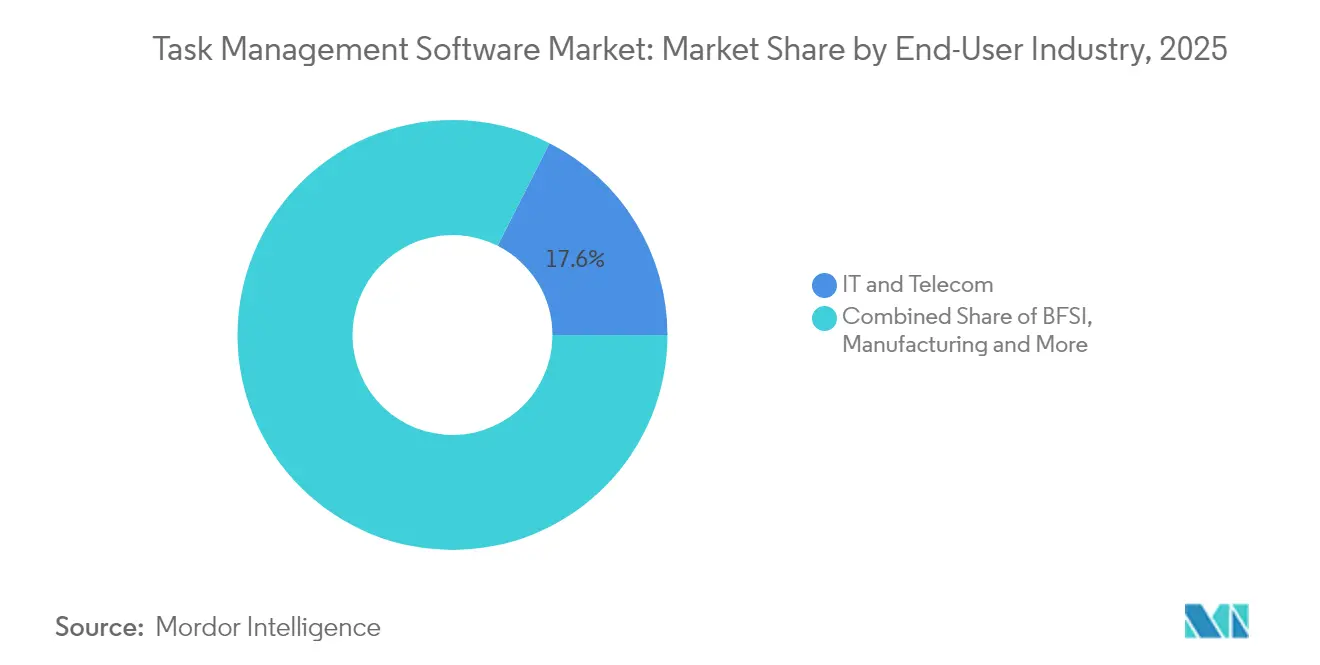
- By end-user industry, Information technology and telecommunications businesses produced 17.55% of 2025 revenue, retail and ecommerce firms, however, are projected to post the fastest expansion at 16.0% CAGR through 2031.
- By business function, marketing and creative departments produced 22.40% of 2025 revenue, finance, HR, and sales teams are projected to post the fastest expansion at 16.9% CAGR, through 2031.
- By geography, North America represented 37.10% revenue in 2025, while Asia-Pacific is projected to record an 13.8% CAGR through 2031.
Note: Market size and forecast figures in this report are generated using Mordor Intelligence’s proprietary estimation framework, updated with the latest available data and insights as of 2026.
Global Task Management Software Market Trends and Insights
Drivers Impact Analysis*
| Driver | (~) % Impact on CAGR Forecast | Geographic Relevance | Impact Timeline |
|---|---|---|---|
| Rapid Adoption of Cloud By SMEs | +4.9% | North America, Europe, Global | Medium term (2-4 years) |
| Explosion of Hybrid/Remote Workforces Requiring Unified Task Visibility | +3.8% | APAC, North America, Global | Short term (≤ 2 years) |
| Vertical-Specific Task Suites for Regulated Industries (E.G., Life-Sciences Eqms) | +2.1% | North America, Europe | Long term (≥ 4 years) |
| Rise of Low-Code/No-Code Platforms That Embed Task Engines | +1.9% | Global, SME-centric | Medium term (2-4 years) |
| Bundling of Task Analytics Into Employee-Experience (EX) Cloud Stacks | +1.2% | North America, Europe | Medium term (2-4 years) |
| ESG Compliance and Audit-Trail Mandates Boosting Traceable Task Workflows | +0.8% | Europe, North America | Long term (≥ 4 years) |
| Source: Mordor Intelligence | |||
Rapid Adoption of Cloud by SMEs
Subscription pricing removes capital expense, automatic updates protect feature parity, and bundled modules increase wallet share, encouraging smaller firms to migrate en masse. A 2024 Indian survey showed half of SMEs ranking cloud infrastructure as the top IT priority.[1]Zoho Research Team, “India SME Cloud Adoption Survey 2024,” zoho.com Salesforce reports that 52% of small businesses already use AI-enabled tools, paying a median USD 29 per user monthly, evidence that cloud economics have democratized advanced capabilities.[2]Salesforce Research, “Small Business Trends Report 2024,” salesforce.com Vendors now bundle CRM, HR, and accounting with task orchestration, deepening lock-in. Emerging-market SMEs, unburdened by legacy systems, adopt full-stack cloud suites in greenfield rollouts. Minimal regulatory friction exists, though providers increasingly open regional data centers to meet local privacy rules.
Expansion of Hybrid and Remote Workforces
Global firms now manage employees who collaborate across time zones and device types, which amplifies the need for unified task visibility. Fragmented tool stacks create duplicate work, missed dependencies, and unnecessary meetings that erode productivity gains. Modern platforms consolidate project feeds, chat threads, and status indicators into a single pane of glass that reduces administrative overhead for managers. Real-time dashboards surface workload balance and risk metrics, enabling proactive interventions rather than reactive fire-fighting. Embedded ambient intelligence captures work events automatically, so individual contributors update fewer fields while leadership still obtains complete audit trails. Asynchronous collaboration features such as comment threads and automated reminders further streamline hand-offs.
Vertical-Specific Task Suites for Regulated Industries
Life sciences, banking, and healthcare teams need workflow engines that embed compliance controls from day one. Sector-tailored solutions integrate validation steps, electronic signatures, and audit-ready documentation directly into task templates, reducing the cost of non-conformance. Automated monitoring flags issues such as missing approvals or outdated SOP references before audits occur, helping companies avoid regulatory penalties. Vendors with deep domain expertise also offer pre-qualified integrations with electronic records systems, reducing custom development cycles. The move toward industry-aligned blueprints is winning favor among risk-averse buyers who view generic workspaces as insufficient to satisfy stringent legal obligations.
Rise of Low-Code and No-Code Platforms
Business users without extensive coding backgrounds can now spin up advanced process automation that links CRM, ERP, and collaboration apps through drag-and-drop interfaces.[3]Automation Software Connect Apps & Design Workflows, Make, make.com Over 90% of enterprises plan to exploit unified APIs by 2025 to connect workflows, reflecting a shift from IT-centric customization toward citizen development. Rich libraries of pre-built connectors allow rapid iteration, while governance layers ensure that role-based access and data-loss prevention policies remain intact. When task engines are embedded into broader application builders, the software becomes invisible infrastructure that simply powers daily operations. Vendors differentiate through scalability safeguards that prevent performance degradation as workflow volumes surge.
Restraints Impact Analysis*
| Restraint | (~) % Impact on CAGR Forecast | Geographic Relevance | Impact Timeline |
|---|---|---|---|
| Persistent Saas Sprawl Creating Integration Fatigue | -2.2% | North America, Europe, Global | Short term (≤ 2 years) |
| Data-Residency and Sovereignty Regulations Slowing Multi-Tenant Adoption | -1.8% | Europe, Global | Long term (≥ 4 years) |
| Change-Management Inertia in Legacy-Heavy Verticals (Manufacturing, Public Sector) | -1.1% | Manufacturing, Public sector | Medium term (2-4 years) |
| AI-Generated Task Recommendations Facing Explainability Scrutiny | -0.7% | Europe, North America | Medium term (2-4 years) |
| Source: Mordor Intelligence | |||
Persistent SaaS Sprawl and Integration Fatigue
Organizations juggle 50-plus cloud applications on average, and 60% of IT leaders still add new tools each month, creating sprawling ecosystems that drain performance gains. Connecting so many point solutions requires ongoing API maintenance, license governance, and security hardening that consume precious engineering hours. The resulting integration fatigue encourages vendor consolidation toward multi-module suites that promise lower total cost of ownership. Enterprises wasted USD 18 million annually on redundant SaaS spending in 2024, prompting nearly every CIO survey respondent to prioritize rationalization roadmaps over the next fiscal year. Comprehensive task management suites that incorporate chat, document management, and analytics reduce swivel-chair overhead and centralize data lineage.
Data-Residency and Sovereignty Regulations
GDPR expansion, cross-border transfer restrictions, and national localization mandates complicate cloud rollouts for multi-tenant task platforms.[4]Data Residency – Microsoft Cloud for Sovereignty, Microsoft Learn, microsoft.com Governments in Europe, China, and the Middle East now demand that sensitive user data remain within defined geographic borders, limiting elasticity benefits. Vendors respond with region-specific deployments, sovereign cloud instances, and customer-managed encryption key options that preserve collaboration without violating local statutes. Complex procurement cycles slow deal velocity because buyers must map every data flow against evolving legal frameworks. Platforms that can demonstrate granular governance and automated compliance reporting gain competitive advantage, particularly among risk-conscious financial and public sector clients.
*Our forecasts treat driver/restraint impacts as directional, not additive. The impact forecasts reflect baseline growth, mix effects, and variable interactions.
Segment Analysis
By Component: Managed Services Accelerate Enterprise Adoption
Managed services grew 16.8% annually and are expected to continue outpacing overall task management software market growth as enterprises seek turnkey delivery of AI-driven workflow design and optimization. Software packages still represented 64.10% revenue in 2025 because they provide the digital foundation, yet many buyers lack in-house teams to configure advanced rules, train machine learning models, and integrate legacy applications. Services specialists close this gap by offering playbooks that shorten time to value and outcome-based contracts that align provider incentives with productivity gains. The partnership model often includes continuous improvement programs that calibrate orchestration engines against evolving staffing patterns and compliance mandates.
Providers now bundle change-management training, governance audits, and security remediation into annual engagements, creating recurring revenue streams that rival license subscriptions. This service-led adoption pattern is expected to raise platform stickiness because clients embed vendor resources deep within operational teams. Vendors that can seamlessly convert engagement data into new product features will secure long-term competitive moats in the task management software market.



By Organization Size: SME Growth Democratizes Enterprise Capabilities
Large enterprises captured 54.60% 2025 revenue due to complex program portfolios that demand robust reporting, single sign-on, and granular permissions. Nonetheless, SMEs will expand at 14.1% CAGR through 2031 as intuitive onboarding, affordable per-seat pricing, and low-code flexibility level the competitive playing field. Cloud-native architectures eliminate hardware spend and shorten procurement cycles, helping smaller firms deploy enterprise-grade automation within days rather than quarters.
The task management software market size for the SME segment is projected to approach parity with the large-enterprise segment near the end of the decade as growing firms scale usage across newly formed teams. Vendors that nurture freemium or tiered offerings stand to convert initial projects into organization-wide deployments, driving predictable expansion revenue. Community forums, template libraries, and localized language packs further accelerate adoption in emerging economies.
By Deployment Mode: Hybrid Cloud Balances Accessibility with Control
Cloud maintained 77.10% 2025 share because browser-based access and continuous updates remain essential for distributed teams. Yet many regulated industries and sovereignty-sensitive regions are turning to hybrid models that blend public cloud collaboration with on-premise repositories for protected data sets. The hybrid segment is on a 15.6% CAGR trajectory, reflecting demand for fine-grained data placement and legacy system integration.
Task management software market share will likely tilt gradually toward flexible hybrid orchestration engines that synchronize tasks, comments, and file attachments across deployment layers in near real time. Security teams appreciate the ability to enforce zero-trust controls within private subnets while still enabling external partners to access non-sensitive project boards in the cloud. Platform roadmaps increasingly feature containerized nodes, edge caches, and policy-driven data routing that assure consistent performance regardless of the hosting topology.
By End-User Industry: Retail Acceleration Reflects Omnichannel Complexity
Information technology and telecommunications businesses produced 17.55% of 2025 revenue because they require iterative sprint planning, incident response workflows, and cross-functional release schedules. Retail and eCommerce firms, however, are projected to post the fastest expansion at 16.0% CAGR due to omnichannel order management, seasonal promotions, and third-party logistics orchestration.
The task management software market size for retail is growing as consumer expectations for next-day fulfillment and unified brand experiences intensify coordination pressure across merchandising, marketing, and warehouse teams. Platform templates now cater to assortment planning, store remodel projects, and last-mile delivery tracking, giving retailers the operational agility once reserved for agile software teams. Vendors that tie task completion to customer journey analytics help merchants attribute revenue lift directly to process improvements, reinforcing investment justification.
By Business Function: Marketing Drives Cross-Functional Integration
Marketing and creative departments are adopting sophisticated project boards that manage asset production, multichannel content calendars, and localization workflows, making them a gateway for broader platform penetration produced 22.40% of 2025 revenue. Completed deliverables must pass brand-compliance reviews, accessibility checks, and legal approvals before launch, which creates a rich use case for automation.
Finance, HR, and sales teams are projected to post the fastest expansion at 16.9% CAGR, while increasingly build parallel workspaces within the same environment, yielding single-source-of-truth visibility across budget planning, talent onboarding, and customer lifecycle management. This convergence underscores a wider trend in the task management software industry toward integrated digital operations platforms that stitch together departmental workflows without forcing context switching or duplicate data entry.
Geography Analysis
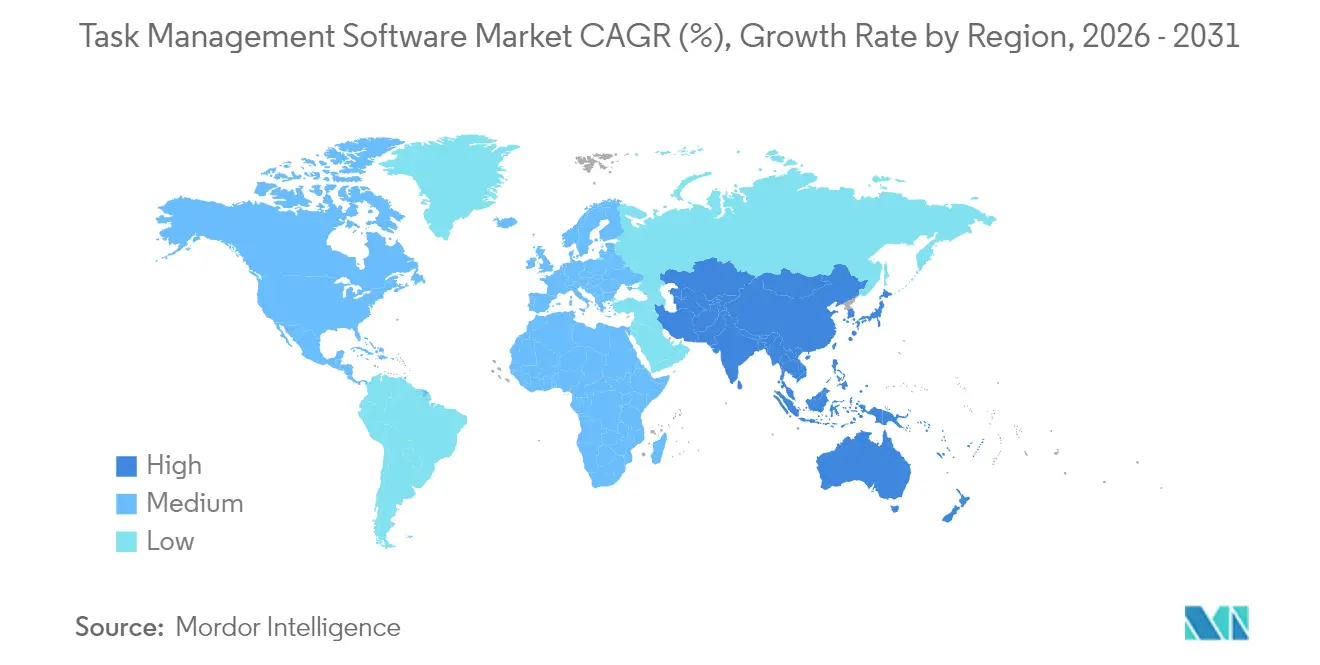
North America retained 37.10% of 2025 revenue because early adopters rely on AI-augmented orchestration to satisfy Sarbanes-Oxley audit requirements and to mitigate worker shortage pressures. Tight integration between task engines and incumbent productivity suites accelerates rollout because most enterprises are already entrenched in large vendor ecosystems. Robust venture funding and a vibrant startup landscape also feed rapid product innovation cycles that resonate with buyers seeking competitive differentiation.
Asia Pacific is advancing at a 13.8% CAGR as improved mobile broadband coverage, government cloud incentives, and SME digitalization programs combine to create favorable market conditions. Countries such as India and Indonesia champion domestic SaaS champions that localize pricing and language, while China’s regulatory environment favors providers with sovereign cloud options. Many regional businesses leapfrog legacy on-premise deployments altogether, adopting cloud or hybrid task engines that support geographically dispersed supply chains across Southeast Asia.
Europe maintains steady growth despite navigating GDPR, DORA, and emerging artificial-intelligence risk guidelines that raise implementation complexity. Vendors that operate within the region respond by offering data-residency controls, customer-managed encryption keys, and continuous compliance reporting that align with stringent privacy norms. Southern Europe is witnessing accelerated uptake among mid-market exporters who seek operational visibility across far-flung subsidiaries. Elsewhere, Latin America, the Middle East, and Africa remain nascent but promising as cloud infrastructure expands and public-sector modernization programs anchor early demand for structured project oversight.

Regulatory Landscape
Task management software vendors operate under a tightening set of privacy, security, and AI governance rules that affects product design (audit trails, access controls, retention) and deployment options (regional hosting, sovereign instances). In the European Union, GDPR-driven data protection requirements continue to shape cross-border data transfer practices and reinforce data-residency features, while the EU AI Act introduces AI-specific obligations, with entry into force in August 2024 and a full application date of August 2, 2026. This is particularly relevant for platforms embedding generative AI into task creation, prioritization, and recommendations.
Public-sector and regulated-industry adoption further elevates compliance requirements. In the United States, federal procurement standards such as FedRAMP are shifting toward automation-friendly authorization artifacts (OSCAL) under the FedRAMP 20x initiative, raising the bar for SaaS providers targeting government workloads. Alongside privacy and security controls, growing scrutiny of AI explainability and governance increases the need for defensible decision logs and policy controls for AI-generated task recommendations, especially for enterprises operating across multiple jurisdictions.
Value Chain Analysis
The value chain begins with cloud infrastructure and identity/security foundations (IaaS/PaaS, SSO, encryption, observability) that support multi-tenant SaaS delivery across regions. The core software value is created by task/project engines and collaboration layers (work objects, notifications, calendars, files, comments), increasingly coupled with AI capabilities and automation builders that connect to external systems through APIs and app marketplaces. Distribution is anchored in product-led growth (freemium and tiered self-serve), marketplaces inside collaboration and developer ecosystems, and enterprise sales for larger rollouts that require governance, reporting, and data-residency options.
Services and ecosystem partners form an important downstream layer because enterprises need integrations, workflow design, and change management to reduce SaaS sprawl and operationalize automation. Atlassian expanding its Teamwork Graph for agentic work and introducing new agent tooling (including Rovo Studio) highlights how platform vendors push more value into shared data layers and developer ecosystems, which in turn supports demand for implementation partners that can integrate across Jira, collaboration suites, and line-of-business tools. As a result, connectors, developer intelligence, and governance tooling act as differentiators beyond basic task tracking.
Competitive Landscape
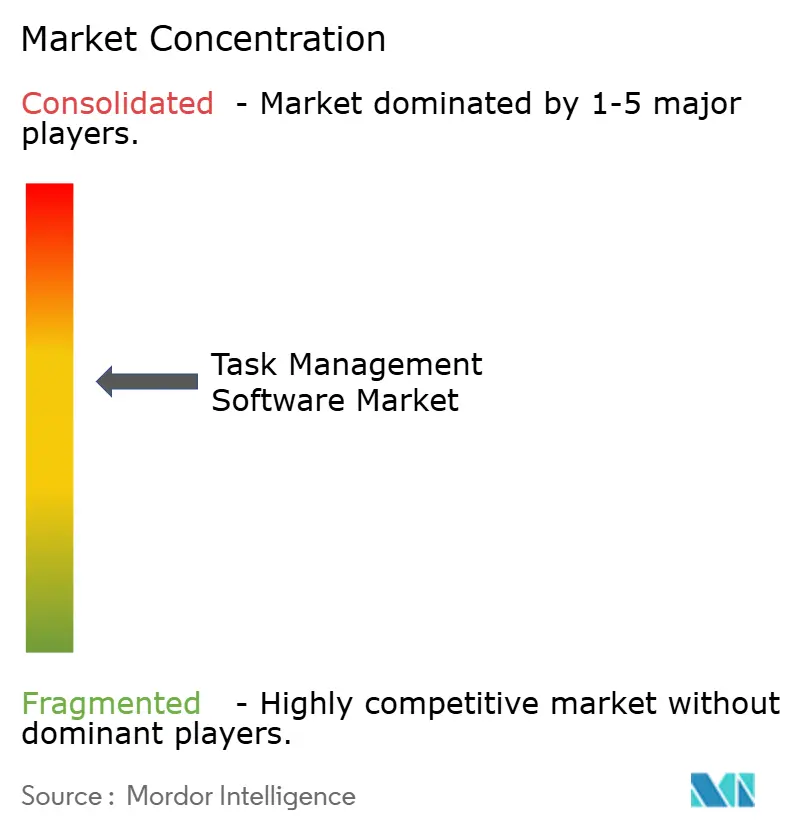
The task management software market exhibits moderate fragmentation with leading five vendors controlling roughly 40% of global revenue, yet consolidation is accelerating as full-suite platforms acquire specialized point solutions. Microsoft embeds Planner and Project across Office subscriptions, driving land-and-expand momentum through bundled pricing. Atlassian scales Jira Work Management into non-technical teams while leveraging a marketplace of over 5,000 integrations to minimize context switching.
Pure-play disruptors like ClickUp and Asana differentiate through design simplicity, AI-powered workload balancing, and transparent time-to-value metrics that resonate with digitally native firms. Monday.com invested heavily in a federated data layer that lets customers construct custom applications around shared work objects, blurring the line between low-code platform and task engine. Vertical specialists such as Veeva build compliance-ready templates that protect margins against generalist suites.
Strategic alliances between task vendors and ERP giants allow embedded task widgets to surface inside core finance or HR screens, fulfilling customer demand for unified operational intelligence. Private equity firms signal confidence in the sector’s cash-flow durability by taking mature platforms private to accelerate roadmap execution, as seen in the pending Smartsheet buyout. Vendors that can articulate outcome-based ROI and support sovereign deployment options are well positioned to capture share from slower competitors.
Task Management Software Industry Leaders
Microsoft Corporation
Atlassian Corporation Plc
RingCentral, Inc.
Asana Inc.
monday.com Ltd.
- *Disclaimer: Major Players sorted in no particular order

Market Opportunities and Future Outlook
Agentic workflow orchestration is creating new monetization and adoption pathways beyond traditional task boards, particularly where buyers want AI agents to create, triage, and move work across multiple systems. Vendor roadmaps in 2026 show specific moves toward interoperability for AI agents, including Wrike launching a Conversational AI Agent Builder and expanding Model Context Protocol (MCP) connections, and monday.com introducing a unified AI stack that supports integrating external agents (for example, via MCP and open APIs). This supports a path for task management platforms to operate as a governed system of record that can securely supply context to external agents while keeping permissions, audit trails, and controllable automation in place.
Data-residency and regulated-industry needs continue to support hybrid and sovereign deployment patterns, which favors vendors and partners that package compliance-ready templates (for example, lifecycle controls, approvals, and audit evidence) and provide managed services for rollout and integration. Taskade adding automation integrations (including Salesforce, Jira, and monday.com) shows ongoing demand to reduce integration fatigue by connecting work management to CRM, developer tools, and collaboration suites. As consolidation and suite bundling intensify, there is also room for specialists offering vertical blueprints (life sciences, banking, public sector) and for services providers that standardize migrations, governance, and cross-tool rationalization programs.
Recent Industry Developments
- July 2026: Asana announced an operating system for human-agent teams, extending its platform toward agent-driven work orchestration. The release builds on its AI roadmap and targets deployments where teams want AI agents to manage multi-step execution while preserving enterprise-grade visibility and controls.
- June 2026: Microsoft and Atos Group expanded their strategic collaboration to scale secure agentic AI across Atos, including deployment of Microsoft 365 Copilot and broader agent capabilities. The partnership points to how large enterprises are standardizing on suite ecosystems and governance models that can influence task and project execution workflows.
- December 2024: Smartsheet shareholders approved a privatization deal led by Blackstone and Vista Equity Partners. The transaction supports accelerated product and go-to-market investment under private ownership, with implications for competitive intensity among full-suite work management vendors.


Research Methodology Framework and Report Scope
Market Definition and Coverage
For this study, the market covers software tools that help individuals and teams create, assign, prioritize, and track tasks through a workflow, including collaboration features and basic reporting that supports day-to-day execution.
Scope exclusions: We exclude general office suites unless task management is priced and sold as a distinct product, and we also exclude pure professional services that are not tied to task management software delivery.
Segmentation Overview
- By Component
- Software
- Stand-alone Task Management Apps
- Integrated Project and Work-Management Suites
- Services
- Professional (Implementation, Consulting)
- Managed Services
- Software
- By Organization Size
- Small and Medium Enterprises
- Large Enterprises
- By Deployment Mode
- Cloud
- Public Cloud
- Private and Hybrid Cloud
- On-Premise
- Cloud
- By End-User Industry
- BFSI
- IT and Telecommunication
- Retail and eCommerce
- Manufacturing
- Healthcare and Life-Sciences
- Government and Public Sector
- Travel, Tourism and Hospitality
- Other End-User Industrys (Education, Media, etc.)
- By Business Function
- Marketing and Creative
- HR and Recruiting
- Finance and Accounting
- Sales and Customer Success
- By Geography
- North America
- United States
- Canada
- Mexico
- South America
- Brazil
- Argentina
- Chile
- Rest of South America
- Europe
- United Kingdom
- Germany
- France
- Italy
- Spain
- Rest of Europe
- Asia-Pacific
- China
- Japan
- India
- South Korea
- Australia and New Zealand
- Rest of Asia-Pacific
- Middle East and Africa
- Middle East
- United Arab Emirates
- Saudi Arabia
- Turkey
- Rest of Middle East
- Africa
- South Africa
- Kenya
- Nigeria
- Rest of Africa
- Middle East
- North America
Data Sources, Market Sizing, and Validation
Desk Research
Desk research was used to set a clear boundary around task management software, and then to ground the demand picture using public adoption signals. We reviewed sources such as the US Bureau of Labor Statistics for knowledge worker trends, the US Census Bureau for business counts by size, and the OECD for digital adoption context across economies.
We also referenced public materials from bodies such as the International Organization for Standardization for security and quality language that affects buying decisions, and the National Institute of Standards and Technology for cybersecurity guidance that can shape vendor requirements for regulated users. To connect these signals back to revenue, we used company filings, investor presentations, reputable press coverage, and product pricing pages, and then cross-checked with paid subscriptions used for company financials and news tracking. We also used a patent database to understand feature direction. The sources listed here are illustrative only, and many other public and paid references were consulted for data collection, validation, and clarification.
Primary Interviews and Surveys
Primary work focused on validating what gets purchased, how it gets priced, and how usage expands after rollout across teams. We spoke with a mix of software publishers, channel partners, systems integrators, and enterprise and SMB buyers, so assumptions on conversion, renewal, and packaging could be checked across regions.
For a global view, inputs were verified across industries with different collaboration intensity, and then adjusted where procurement cycles and compliance requirements affect typical contract lengths and discounting.
Distribution of primary research fieldwork respondents
| Company type | Respondent position | Region |
|---|---|---|
| Top tier: 25% | CXOs: 16% | APAC: 47% |
| Mid tier: 58% | Functional/Unit leaders: 27% | EMEA: 32% |
| Smaller Players: 17% | Managers: 57% | Americas: 21% |
Market-Sizing & Forecasting
Sizing starts with one top-down build where the addressable pool is reconstructed from counts of target organizations and active knowledge workers, and then filtered by collaboration intensity and software adoption rates. In task management software, paid use is usually tied to seats or packaged plans, so expected paid users and average revenue per user (ARPU) become the main bridge from adoption to revenue.
To keep totals realistic, we corroborate with selective bottom-up approximations, such as sampled price list checks across common plan tiers, partner channel feedback on discount ranges, and revenue split patterns between software subscriptions and related services. Inputs used in the model include cloud versus on-premises mix, typical seat expansion after initial team rollout, renewal levels, integration demand with broader work tools, and regional differences in price realization due to taxes and currency. When data is missing for smaller vendors or niche vertical use, gaps are handled through peer grouping by packaging style and customer size, followed by conservative revenue per customer ranges validated through interviews.
For forecasting, we rely on scenario analysis supported by trend smoothing on adoption and ARPU, and then adjust the curves using expert views on hybrid work persistence, automation features entering standard plans, and procurement tightening during weak macro periods. The output is reviewed by region and by major buyer type so the growth path remains consistent with practical buying cycles.
Data Validation & Update Cycle
Validation is done through multiple checks so one weak input does not drive the final number. Model outputs are compared against independent signals such as reported subscription growth trends from public filings, observed price changes on product pages, and channel feedback on deal sizes, and then large variances are investigated before sign-off.
We also run consistency checks across years so sharp jumps only remain when there is a clear explanation, such as major pricing changes or a step-up in adoption. Reports are refreshed annually, and interim updates are made when major events occur that can change demand or pricing. Before delivery, a fresh analyst pass is completed so the latest public information is reflected in assumptions and the final tables.
Mordor Intelligence's Task Management Software Market Size Compared With Other Published Estimates
Published market sizes for task management software can look far apart because the split between task tools, project management systems, and broader collaboration platforms is defined differently, and the pricing basis used in the model is not always the same. Differences also come from the year chosen for currency conversion and whether list pricing or realized pricing is used.
A refresh-led gap shows up when pricing and exchange rates move quickly, because the same seat growth can translate into different USD revenue totals. By re-checking plan tier mix, discounting ranges, and currency timing close to publication, and then re-contacting sources when an outlier appears, the market sizing refresh cadence and validation checks applied by Mordor Intelligence keep ARPU progression tied to what buyers are actually paying in each region.
Benchmark comparison
| Source | Market Size | Gaps in Research Methodology |
|---|---|---|
| Mordor Intelligence | USD 1.44 B (2026) | |
| Industry Publication A | USD 3.30 B (2023) | Uses an earlier base year and appears to include adjacent work management categories, which can pull in broader collaboration or project workflow revenue beyond task focused tools. |
| Advisory Bulletin B | USD 4.11 B (2024) | Starts from a higher 2024 value and likely applies a wider vendor and pricing scope, with less clarity on whether revenue reflects realized subscription pricing versus list price assumptions. |
The spread in the table mainly comes from scope edges and how pricing is translated into USD for the stated year. When plan mix, discounting, and currency timing are treated consistently and then checked against real buying patterns, the final market value becomes easier to trace and reproduce across updates.


Key Questions Answered in the Report
Which industries are driving task management software adoption?
IT and telecommunications lead with 17.55% market share in 2025, while retail and eCommerce show the fastest growth at 16.0% CAGR. Healthcare, manufacturing, and financial services increasingly adopt vertical-specific solutions for compliance and regulatory requirements.
How do small businesses compare to enterprises in adoption?
Large enterprises maintain 54.60% market share in 2025, but small and medium enterprises drive faster adoption at 14.1% CAGR. Cloud-based deployment models eliminate traditional infrastructure barriers, enabling SMEs to access enterprise-grade functionality.
What specific benefits do regulated industries gain?
Regulated industries require specialized features like audit trails, compliance workflows, and regulatory reporting. Life sciences organizations use electronic Quality Management Systems (eQMS) that embed regulatory knowledge into workflow templates, ensuring automatic compliance with validation and approval requirements.
Who are the major players in the task management software market?
Key players include Microsoft Corporation, Atlassian, Asana, monday.com, Smartsheet, Adobe (Workfront), ServiceNow, and emerging AI-native platforms. Microsoft leverages productivity suite integration, while pure-play vendors focus on sophisticated project coordination capabilities.
How are vendors monetizing generative AI features?
Nearly one quarter of suppliers now sell AI capabilities in premium tiers, adding usage-based pricing layers above core subscriptions.
Which regions present the highest upside for new entrants?
Asia-Pacific shows the strongest growth at 13.8% CAGR as organizations leapfrog legacy systems and embrace cloud-native task orchestration.
Page last updated on:


 Your data is secure and never sold or shared.


