Oil Storage Market Size and Share
Market Overview
| Study Period | 2021 - 2031 |
|---|---|
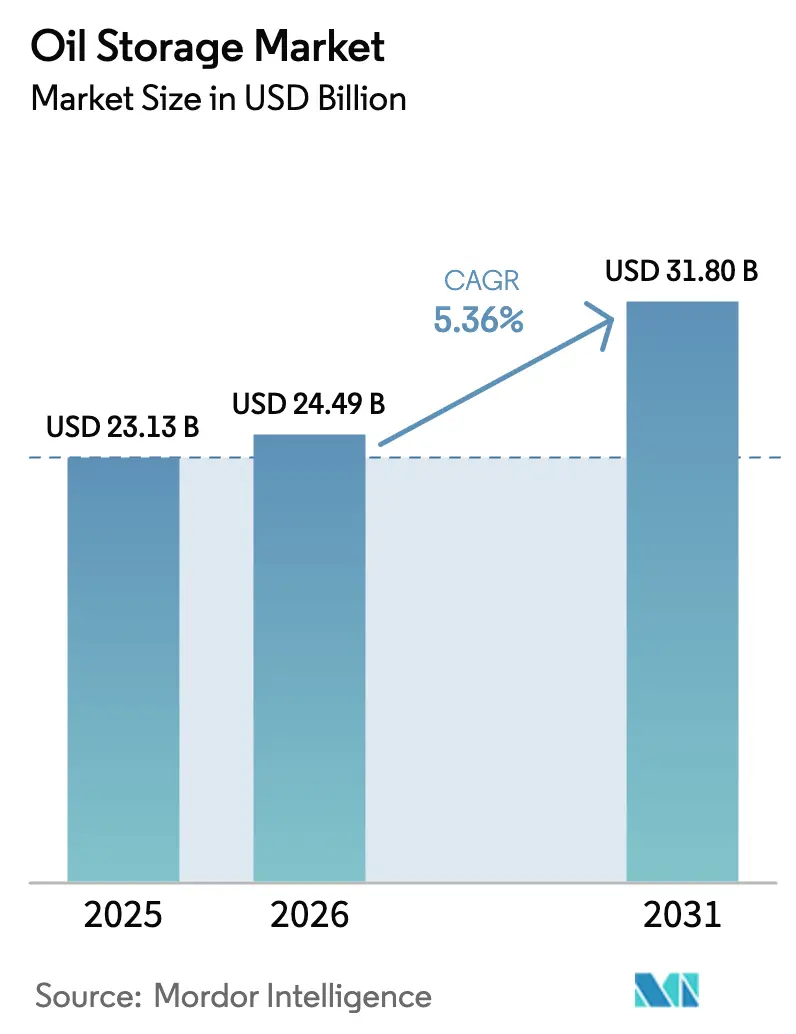
| Market Size (2026) | USD 24.49 Billion |
| Market Size (2031) | USD 31.80 Billion |
| Growth Rate (2026 - 2031) | 5.36% CAGR |
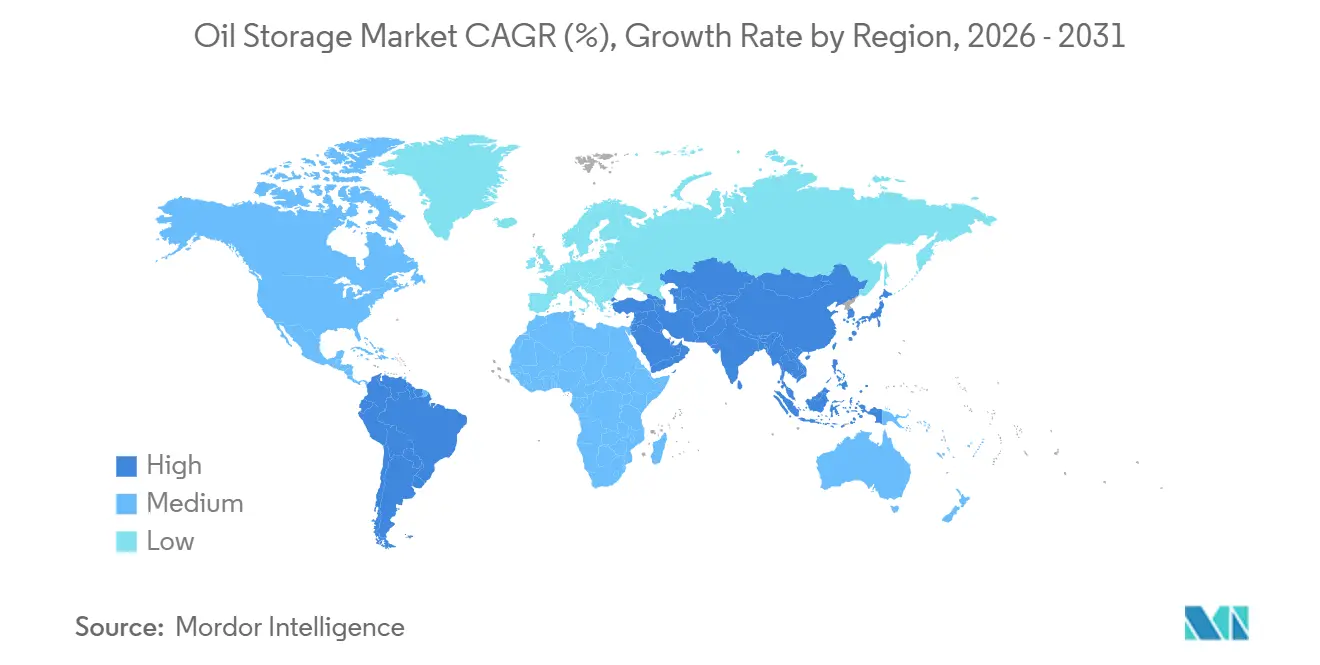
| Fastest Growing Market | Asia Pacific |
| Largest Market | Asia Pacific |
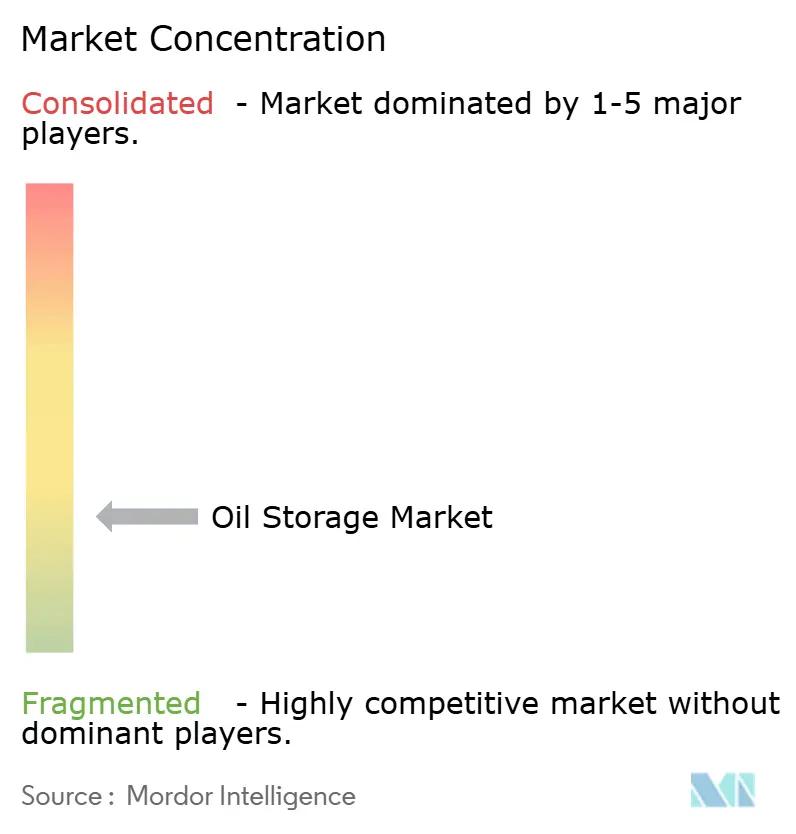
| Market Concentration | Low |
Major Players *Disclaimer: Major Players sorted in no particular order Image © Mordor Intelligence. Reuse requires attribution under CC BY 4.0. | |
Oil Storage Market Analysis by Mordor Intelligence
The Oil Storage Market size is projected to expand from USD 23.13 billion in 2025 and USD 24.49 billion in 2026 to USD 31.80 billion by 2031, registering a CAGR of 5.36% between 2026 to 2031.
This expansion mirrors how governments and commercial operators value optionality in an era of heightened price volatility, strategic‐reserve build-outs, and refinery network shifts. Underground caverns retained clear leadership thanks to favorable geotechnical economics, but modular above-ground tanks, fiberglass-reinforced plastic construction, and floating storage units are each recording faster uptake as operators seek capital-light, rapid-deployment assets. Asia-Pacific remains the revenue anchor, underpinned by China’s and India’s refinery additions, while North America pivots toward export hubs and strategic petroleum reserve (SPR) refills. Competitive intensity stands at a low level because the top five independent terminal operators control only about 30% of third-party capacity, leaving space for state-owned and integrated oil companies to self-supply. High capex, multi-year permitting, and rising cyber-insurance costs act as natural brakes on speculative builds, yet simultaneously elevate tariff resilience for incumbent tank-farm owners.
Key Report Takeaways
- By storage facility, underground caverns commanded 61.8% of the oil storage market share in 2025; above-ground tanks are forecast to post a 6.4% CAGR through 2031.
- By construction material, carbon steel led with 40.4% of the oil storage market size in 2025, while fiberglass-reinforced plastic is expected to expand at a 6.9% CAGR to 2031.
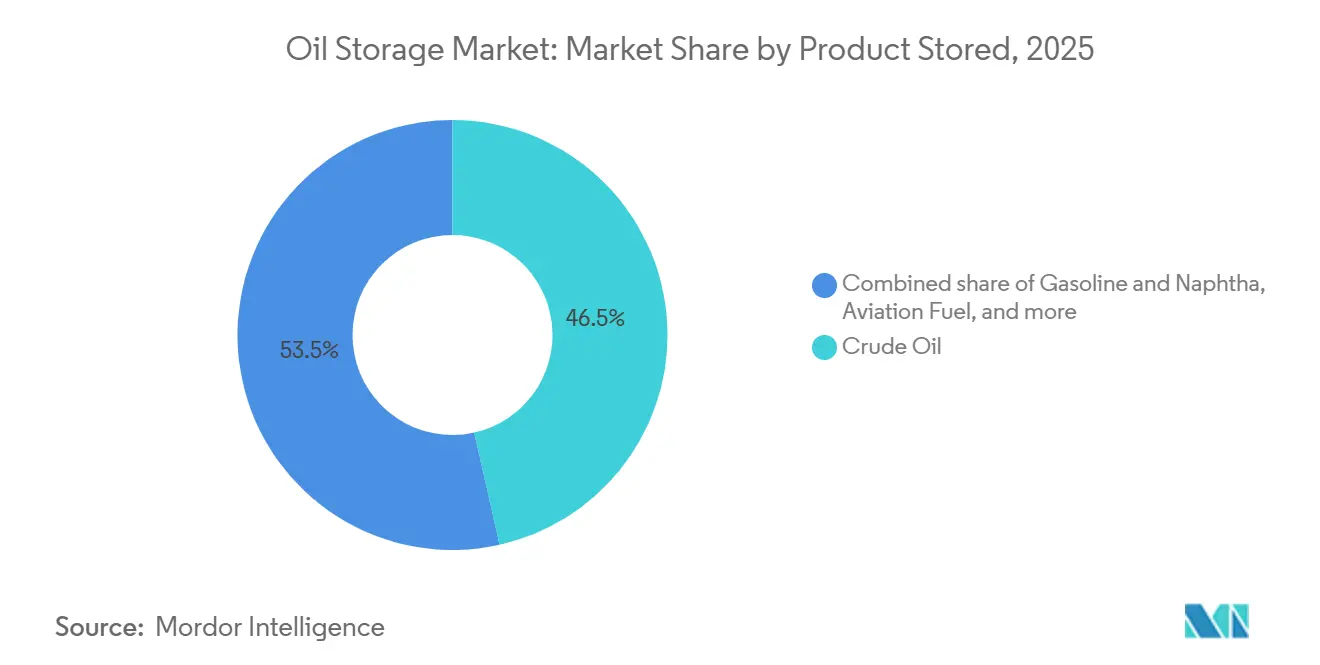
- By product stored, crude oil accounted for 46.5% share of the oil storage market size in 2025, and aviation fuel is advancing at a 7.5% CAGR through 2031.
- By capacity range, installations above 500,000 m³ captured 39.9% of the oil storage market share in 2025; units under 100,000 m³ are projected to grow at a 7.2% CAGR.
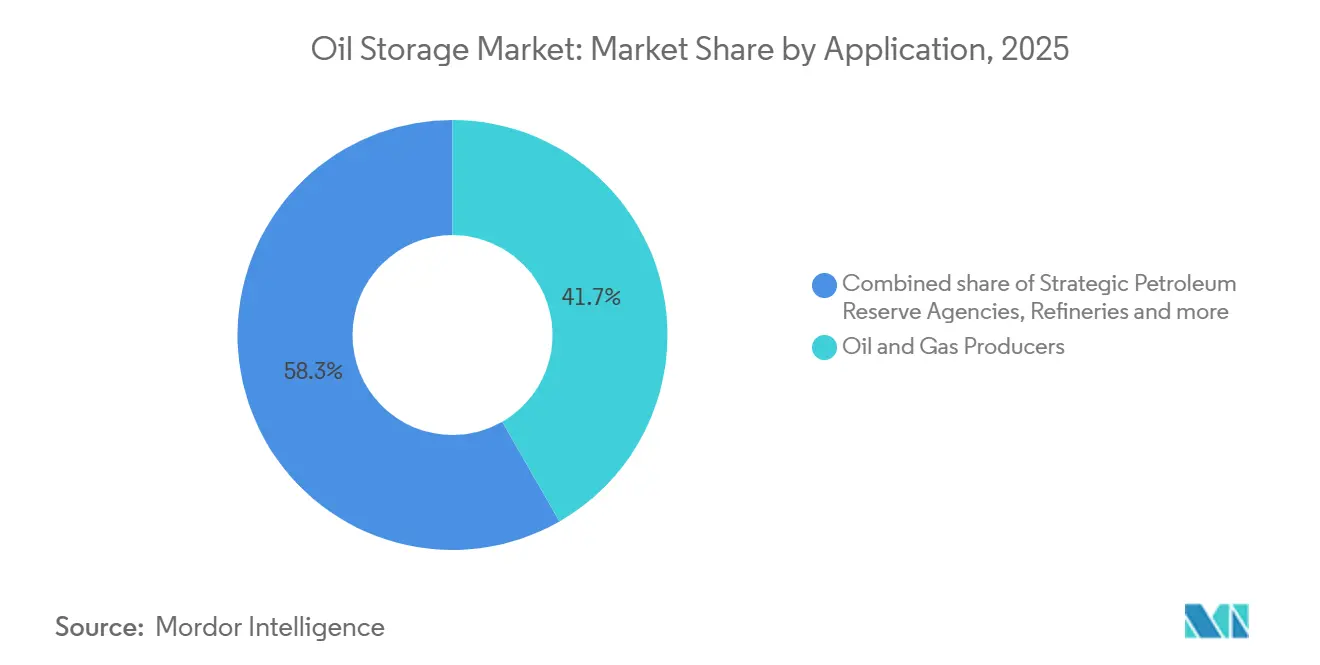
- By application, oil and gas producers held 41.7% of the oil storage market share in 2025, whereas strategic petroleum reserve agencies exhibit the highest projected CAGR at 8.1% to 2031.
- By geography, Asia-Pacific generated 42.3% of 2025 revenue; the region is expected to register a 5.8% CAGR through 2031.
Note: Market size and forecast figures in this report are generated using Mordor Intelligence’s proprietary estimation framework, updated with the latest available data and insights as of January 2026.
Global Oil Storage Market Trends and Insights
Drivers Impact Analysis*
| Driver | (~) % Impact on CAGR Forecast | Geographic Relevance | Impact Timeline |
|---|---|---|---|
| Rising global energy demand & petroleum-product consumption | 1.2% | Global, led by Asia-Pacific and Middle East | Long term (≥ 4 years) |
| Strategic petroleum reserve build-outs by governments | 1.5% | North America, China, India, EU | Medium term (2-4 years) |
| Volatile crude-oil prices increasing commercial stock-holding | 1.0% | Global, concentrated in trading hubs | Short term (≤ 2 years) |
| Growing refinery throughput in emerging economies | 1.1% | Asia-Pacific core, spill-over to Middle East | Long term (≥ 4 years) |
| AI-driven predictive tank-farm optimisation adoption | 0.4% | North America, Europe, select Asia terminals | Medium term (2-4 years) |
| Modular floating storage units for offshore production zones | 0.3% | Middle East, West Africa, Latin America | Medium term (2-4 years) |
| Source: Mordor Intelligence | |||
Rising Global Energy Demand and Petroleum-Product Consumption
The International Energy Agency (IEA) expects petroleum-product demand to expand by 1.8 million b/d between 2026 and 2028, led by aviation-fuel growth in Asia-Pacific and diesel in sub-Saharan Africa.[1]International Energy Agency, “Oil 2024,” iea.org Accelerating industrialization in India drove a 4.2% increase in refinery throughput during 2025, highlighted by Indian Oil Corporation’s 300,000 b/d capacity addition at its Gujarat complex.[2]Indian Oil Corporation, “Refinery Expansion Update,” iocl.com Tank-farm utilization in China’s Shandong province surpassed 92% in early 2025, underscoring infrastructure lag relative to crude-import quotas. Operators co-located with refinery clusters leverage resilient tariff premiums as just-in-time inventory strategies become fragile under logistics stress.
Strategic Petroleum Reserve Build-Outs by Governments
Washington allocated USD 1.5 billion in fiscal 2025 to replenish the U.S. SPR after emergency releases depleted inventories to 395 million barrels, its lowest level since 1983.[3]U.S. Energy Information Administration, “International Outlook,” eia.gov Beijing’s state reserve capacity reached roughly 1.0 billion barrels by end-2025, equal to 90 days of net imports, as part of a sovereignty-focused energy agenda.[4]National Energy Administration of China, “Strategic Reserves Progress Report,” nea.gov.cn India’s third phase added 6.5 million barrels across Chandikhol and Padur, lifting national reserves to 39 million barrels. These sovereign procurements pivot demand from spot leasing toward long-term tariffs, trimming merchant margins yet lifting baseline utilization for operators that accept lower returns. A European Commission proposal to mandate 90-day cover across member states could stimulate another 50 million barrels of capacity before 2028.
Volatile Crude-Oil Prices Increasing Commercial Stock-Holding
Brent prices oscillated between USD 70 and USD 92 per barrel through 2025, repeatedly flipping the forward curve into contango and rewarding time-spread storage plays. Six-month spreads above USD 3.50 typically render land-based tankage profitable, driving Cushing, Oklahoma, utilization toward 88% and Fujairah, UAE, toward 91% during Q4 2025. Floating storage on very large crude carriers (VLCCs) also surged as charter rates touched USD 45,000 per day. Operators with flexible lease contracts captured windfall margins, while those on fixed tariffs lagged.
Growing Refinery Throughput in Emerging Economies
Asia-Pacific hosts 2.6 million b/d of the 4.9 million b/d global refinery additions scheduled for 2024-2028, according to the U.S. Energy Information Administration. China National Offshore Oil Corporation’s 400,000 b/d Daxie complex and Saudi Aramco’s 400,000 b/d Jazan refinery each embedded more than 20 million barrels of tank capacity into plant designs. Hindustan Petroleum Corporation’s Visakhapatnam expansion paired 3 million barrels of new storage with predictive-maintenance software to minimize demurrage.
Restraints Impact Analysis*
| Restraint | (~) % Impact on CAGR Forecast | Geographic Relevance | Impact Timeline |
|---|---|---|---|
| Energy-transition-led decline in fossil-fuel share | -0.8% | Europe, North America | Long term (≥ 4 years) |
| High capex & lengthy permitting for new terminals | -0.5% | Global, acute in Europe and North America | Medium term (2-4 years) |
| Cyber-insurance mandates inflating OPEX | -0.3% | North America, Europe, select Asia terminals | Short term (≤ 2 years) |
| Coastal-zoning land scarcity near deep-water ports | -0.4% | Asia-Pacific, Middle East, select EU ports | Long term (≥ 4 years) |
| Source: Mordor Intelligence | |||
AI-Driven Predictive Tank-Farm Optimization Adoption
Vopak deployed Honeywell Forge analytics across Singapore and Rotterdam in 2025, trimming unplanned downtime by 18% and boosting annual tariff revenue by USD 12 million. Kinder Morgan piloted a digital-twin platform at the Houston Ship Channel, lowering truck-loading queues by 22 minutes per transaction. Only Tier-1 operators with access to USD 5-10 million technology budgets are scaling such systems, widening the performance gap with smaller independents.
Modular Floating Storage Units for Offshore Production Zones
Converted or purpose-built floating storage units (FSUs) provide roughly 2 million barrels of movable capacity that can be redeployed within 30 days, a fraction of the 36 months typical for greenfield terminals. Petrobras chartered two FSUs for pre-salt fields in 2025, accelerating time-to-first-oil by 18 months. Upfront costs run USD 80-120 million, about 30% below comparable land-based capacity, although marine OPEX remains higher.
*Our forecasts treat driver/restraint impacts as directional, not additive. The impact forecasts reflect baseline growth, mix effects, and variable interactions.
Segment Analysis
By Storage Facility: Caverns Hold Lead while Above-Ground Tanks Accelerate
Underground caverns controlled 61.8% of the oil storage market share in 2025, largely because salt-dome geology yields operating costs near USD 3.50 per barrel versus USD 12 for above-ground systems. China’s Huangdao and Zhoushan SPR sites illustrate how coastal aquifers provide secure, surveillance-resistant capacity for sovereign reserves. Above-ground tanks, however, are projected to log a 6.4% CAGR through 2031, driven by rapid-deployment schedules, lower permitting barriers, and growing use in offshore production zones where modular designs shorten construction to 18 months.
Commercial operators favor above-ground tanks because higher product turnover and blending flexibility offset their larger evaporation losses. Fiberglass-reinforced plastic vessels are winning conversions from carbon steel in sour-crude and high-sulfur fuel-oil service thanks to reduced corrosion maintenance. The Bryan Mound and Big Hill SPR caverns in Texas remain emblematic of cavern economics, yet Vopak’s 2025 installation of FRP vessels at Fujairah signals a shifting value calculus for commercial terminals.


By Construction Material: Carbon Steel Dominates yet Composites Capture Premium Niches
Carbon steel accounted for 40.4% of construction-material demand within the oil storage market size in 2025 because of mature fabrication supply chains and comprehensive API 650 certification. It stays cost-advantaged for large-diameter tanks above 50 meters. Still, fiberglass-reinforced plastic is slated to grow at 6.9% CAGR as owners weigh full lifecycle economics rather than headline capex.
Lifecycle modeling shows corrosion management consumes roughly 35% of a steel tank’s total ownership cost over 30 years, whereas FRP eliminates internal coating and cathodic-protection budgets. Duplex stainless steel is gaining traction in sulfur-rich crude service; Saudi Aramco opted for that material in its Yanbu expansion to anticipate Manifa blend properties. Regulatory pressure on volatile organic compound emissions further tilts European gasoline and naphtha storage toward FRP and stainless steel solutions.
By Product Stored: Aviation Fuel Emerges as Fastest-Growing Category
Crude oil remained the largest product with 46.5% volume share in 2025, but aviation fuel is forecast to register a 7.5% CAGR through 2031, the fastest among all categories. Passenger traffic is expected to exceed 4.7 billion enplanements during 2026, surpassing the 2019 pre-pandemic peak. The European Union’s ReFuelEU Aviation regulation mandates 2% sustainable aviation fuel (SAF) blend by 2025, increasing to 6% by 2030, spurring dedicated SAF-compatible tankage at airports such as Singapore Changi, which commissioned 500,000 barrels in 2025.
Gasoline and naphtha mirror overall oil storage market growth rates on petrochemical pull, whereas diesel storage benefits from freight logistics expansion in India and Africa. Fuel-oil tankage faces structural contraction as IMO 2020 sulfur caps reduce high-sulfur demand. Product mix evolution, therefore, mirrors downstream decarbonization timelines: aviation and petrochemical chains expand, while long-haul road transport faces electrification beyond 2030.
By Capacity Range: Mega-Terminals Anchor Share while Distributed Networks Gain Momentum
Facilities above 500,000 m³ represented 39.9% of the oil storage market share in 2025, leveraging scale economies to push storage fees below USD 0.50 per barrel per month. Saudi Aramco’s 50-million-barrel Ras Tanura hub typifies the model with integrated pipelines to domestic refineries and export jetties. Vopak’s 13-million-barrel Europoort terminal demonstrates similar advantages in Europe’s largest refining corridor.
Conversely, units below 100,000 m³ will record the highest growth at 7.2% CAGR because distributed assets alleviate inland bottlenecks and enable traders to capture regional arbitrage. Bharat Petroleum’s 50,000-m³ modular depots along Indian truck corridors cut diesel haulage costs by 12% after rollout in 2024-2025. Mid-sized terminals between 100,000 and 250,000 m³ deliver balanced flexibility for regional refineries, posting a 5.8% CAGR.
By Application: Producers Dominate Today while SPR Agencies Outpace Growth
Oil and gas producers owned 41.7% application share in 2025, using captive tankage to buffer upstream output swings and optimize crude-slate blends at integrated refineries. ExxonMobil alone operates about 25 million barrels along the U.S. Gulf Coast. Strategic petroleum reserve entities, however, will expand at an 8.1% CAGR through 2031, outstripping all other segments as sovereigns re-evaluate energy security after 2022 supply shocks.
Refineries represent 28% application demand with inventory ratios of roughly 15 days of crude and 10 days of products, while traders hold 18% leveraging market structure plays. Petrochemical users register a 5.5% CAGR on the back of naphtha and LPG feedstock demand in Asia-Pacific crackers. China’s SPR alone could absorb 150 million barrels of new capacity by 2028, or about 15% of all global additions forecast over the period.
Geography Analysis
Asia-Pacific controlled 42.3% of 2025 revenue and will sustain a 5.8% CAGR through 2031, led by refinery throughput additions totaling 2.6 million b/d between 2024 and 2028. Independent refiners in Shandong province lifted storage capacity by 8 million barrels during 2024-2025, yet utilization stayed above 90% amid higher crude-import quotas. India’s third SPR phase delivered 6.5 million barrels of new caverns, bringing total sovereign reserves to 39 million barrels and raising national cover to 9.5 days of 2025 net imports. ASEAN import terminals expanded to meet rising diesel and jet-fuel needs, with Singapore’s Jurong Island retaining its role as a regional hub.
North America captured roughly 24% oil storage market share in 2025 and is expected to grow at a 4.9% CAGR as refinery rationalization balances Gulf Coast export-terminal expansion. Cushing, Oklahoma’s working capacity sits near 76 million barrels, yet utilization averaged only 62% in mid-2025 after pipeline reversals routed Permian flows directly to coastal refineries. Kinder Morgan and Enterprise Products added 12 million barrels of new export storage around Corpus Christi and Houston to support 4 million b/d of outbound crude. The U.S. SPR refill program targets 180 million barrels by 2027, partially offsetting slower demand growth.
Europe, the Middle East, and Africa together generated 34% of the 2025 turnover with varying momentum. Europe advances at 4.2% CAGR as refinery closures moderate demand but energy-security initiatives lift strategic stocks. Vopak added 2 million barrels at Rotterdam in 2025 to serve renewable diesel and LNG-to-liquids trades. The Middle East exhibits stronger growth at 6.1% CAGR thanks to downstream integration by Saudi Aramco and ADNOC, alongside Fujairah’s expansion as an inter-regional bunkering center. Africa’s capacity builds cluster around Nigeria, Angola, and Egypt, balancing offshore production storage with product import terminals where domestic refining lags consumption.

Competitive Landscape
Market concentration is low; Vopak, VTTI, Oiltanking, Kinder Morgan, and Buckeye Partners collectively hold close to 30% of global third-party capacity. Fragmentation grants incumbents pricing power in land-constrained hubs like Jurong Island, the U.S. Gulf Coast, and Fujairah, while fostering tariff competition in secondary ports. Strategic focus has shifted from greenfield construction toward portfolio optimization and energy-transition molecules. Vopak divested inland European assets in 2024 to redeploy capital into coastal hubs and ammonia or hydrogen storage, whereas VTTI formed a USD 800 million venture with ADNOC to build 10 million barrels of crude storage in Fujairah.
Technology adoption further separates leaders. Vopak’s Honeywell Forge rollout boosted uptime and yielded USD 12 million annual tariff upside, while Kinder Morgan’s digital-twin pilot shaved truck waiting times by one-third. Regulatory requirements for cyber-insurance are inflating OPEX 8-12% since 2024, disadvantaging operators that lag on ISO 28000 or NIST frameworks.
Barriers to entry stay high: a 500,000 m³ terminal commonly costs USD 150 million and takes more than three years to permit, ensuring that existing coastally located tank farms retain durable strategic value. Modular floating-storage and FRP-tank suppliers are carving niches by delivering faster, lower-maintenance solutions, but large capital outlays and strict API 650 compliance keep the disruptive threat contained.
Oil Storage Industry Leaders
Koninklijke Vopak NV
Vitol Tank Terminals International BV (VTTI)
Oiltanking GmbH
Kinder Morgan Inc.
Buckeye Partners L.P.
- *Disclaimer: Major Players sorted in no particular order

Recent Industry Developments
- October 2025: China is set to add eleven new oil reserve sites this year and next, as Beijing ramps up its stockpiling efforts to ensure supply security. Out of the 11 sites, three are located inland in northern Shaanxi province and southwest Yunnan, while the remaining sites are positioned along the east and south coasts.
- September 2025: During the fiscal year (FY) 2024/2025, Al-Hamra Oil Port in Al-Alamein city managed a throughput of 74 million barrels (mmbbl) of oil, as reported by Ibrahim Massoud, chairman of West Desert Petroleum Company (WEPCO), the port's operating entity.
- March 2025: In a move underscoring its commitment to chemical logistics, MOL has inked a deal to fully acquire LBC Tank Terminals Group Holding Netherlands Coöperatief UA (LBC) for around USD 1.7 billion. While the acquisition awaits regulatory nods, it marks MOL's strategic integration of onshore tank storage with its established chemical tanker and container transport operations.
- February 2025: India's budget document revealed a support allocation of INR 55.97 billion (USD 646.78 million) for oil purchases aimed at bolstering the country's strategic petroleum reserves (SPRs). The Indian Strategic Petroleum Reserve Ltd (ISPRL), tasked with managing the nation's oil inventories, oversees three SPRs in southern India, boasting a combined capacity of roughly 5 million tons.


Global Oil Storage Market Report Scope
Oil storage plays a pivotal role in the energy supply chain, holding crude oil or refined products in large tanks or underground caverns. This process helps balance supply and demand, facilitates transport, and manages market fluctuations. Oil is collected from extraction points, refined, and then distributed as finished products to consumers. Facilities, commonly referred to as tank farms or depots, utilize a range of tanks, be it fixed roof, floating roof, pressurized, or underground, tailored to the oil's characteristics and storage requirements. These tanks serve as conduits, transporting oil from production fields to refineries and ultimately to retail sites.
The oil storage market is segmented by storage facility, construction material, product stored, capacity range, application, and geography. By storage facility, the market is segmented into above-ground storage tanks and underground storage tanks. By construction material, the market is segmented into carbon steel, stainless steel, fiberglass-reinforced plastic, composites, and others. By product stored, the market is segmented into crude oil, gasoline and naphtha, diesel and middle distillates, aviation fuel, and others. By capacity range, the market is segmented into up to 100k m³, 100 to 250k m³, 250 to 500k m³, and above 500k m³. By application, the market is segmented into oil and gas producers, refineries, traders and distributors, petrochemical and industrial users, and strategic petroleum reserve agencies. By geography, the market is segmented into North America, Europe, Asia-Pacific, South America, and the Middle East and Africa. The report also covers the market sizes and forecasts for the global oil storage market across major countries within each of the key regions. For each segment, the market sizing and forecasts are provided on the basis of value (USD).
| Above Ground Storage Tanks (ASTs) |
| Underground Storage Tanks (USTs) |
| Carbon Steel |
| Stainless Steel |
| Fiberglass-Reinforced Plastic |
| Composites and Others |
| Crude Oil |
| Gasoline & Naphtha |
| Diesel & Middle Distillates |
| Aviation Fuel |
| Others (Fuel Oil, LPG, etc.) |
| Up to 100k m³ |
| 100 to 250k m³ |
| 250 to 500k m³ |
| Above 500k m³ |
| Oil and Gas Producers |
| Refineries |
| Traders and Distributors |
| Petrochemical and Industrial Users |
| Strategic Petroleum Reserve Agencies (SPRs) |
| North America | United States |
| Canada | |
| Mexico | |
| Europe | Germany |
| United Kingdom | |
| France | |
| Italy | |
| Spain | |
| NORDIC Countries | |
| Russia | |
| Rest of Europe | |
| Asia-Pacific | China |
| India | |
| Japan | |
| South Korea | |
| ASEAN Countries | |
| Australia and New Zealand | |
| Rest of Asia-Pacific | |
| South America | Brazil |
| Argentina | |
| Colombia | |
| Rest of South America | |
| Middle East and Africa | Saudi Arabia |
| United Arab Emirates | |
| South Africa | |
| Egypt | |
| Rest of Middle East and Africa |
| By Storage Facility | Above Ground Storage Tanks (ASTs) | |
| Underground Storage Tanks (USTs) | ||
| By Construction Material | Carbon Steel | |
| Stainless Steel | ||
| Fiberglass-Reinforced Plastic | ||
| Composites and Others | ||
| By Product Stored | Crude Oil | |
| Gasoline & Naphtha | ||
| Diesel & Middle Distillates | ||
| Aviation Fuel | ||
| Others (Fuel Oil, LPG, etc.) | ||
| By Capacity Range | Up to 100k m³ | |
| 100 to 250k m³ | ||
| 250 to 500k m³ | ||
| Above 500k m³ | ||
| By Application | Oil and Gas Producers | |
| Refineries | ||
| Traders and Distributors | ||
| Petrochemical and Industrial Users | ||
| Strategic Petroleum Reserve Agencies (SPRs) | ||
| By Geography | North America | United States |
| Canada | ||
| Mexico | ||
| Europe | Germany | |
| United Kingdom | ||
| France | ||
| Italy | ||
| Spain | ||
| NORDIC Countries | ||
| Russia | ||
| Rest of Europe | ||
| Asia-Pacific | China | |
| India | ||
| Japan | ||
| South Korea | ||
| ASEAN Countries | ||
| Australia and New Zealand | ||
| Rest of Asia-Pacific | ||
| South America | Brazil | |
| Argentina | ||
| Colombia | ||
| Rest of South America | ||
| Middle East and Africa | Saudi Arabia | |
| United Arab Emirates | ||
| South Africa | ||
| Egypt | ||
| Rest of Middle East and Africa | ||


Key Questions Answered in the Report
How large is the oil storage market in 2026 and what growth is expected?
The oil storage market size reached USD 24.49 billion in 2026 and is forecast to rise to USD 31.80 billion by 2031 at a 5.36% CAGR.
Which storage facility type holds the biggest share today?
Underground caverns lead with 61.8% share because of low operating costs and high security for strategic reserves.
What segment is growing fastest in terms of product stored?
Aviation fuel storage shows the quickest expansion at a 7.5% CAGR, helped by passenger traffic recovery and sustainable aviation fuel mandates.
Which region contributes the most revenue?
Asia-Pacific generated 42.3% of 2025 revenue and is on track to keep the top spot through 2031.
What factors restrain new terminal construction?
High capital expenditure, multi-year permitting, cyber-insurance requirements, and coastal land scarcity collectively dampen greenfield activity.
Page last updated on:


