Natural Gas Storage Market Size and Share
Market Overview
| Study Period | 2021 - 2031 |
|---|---|
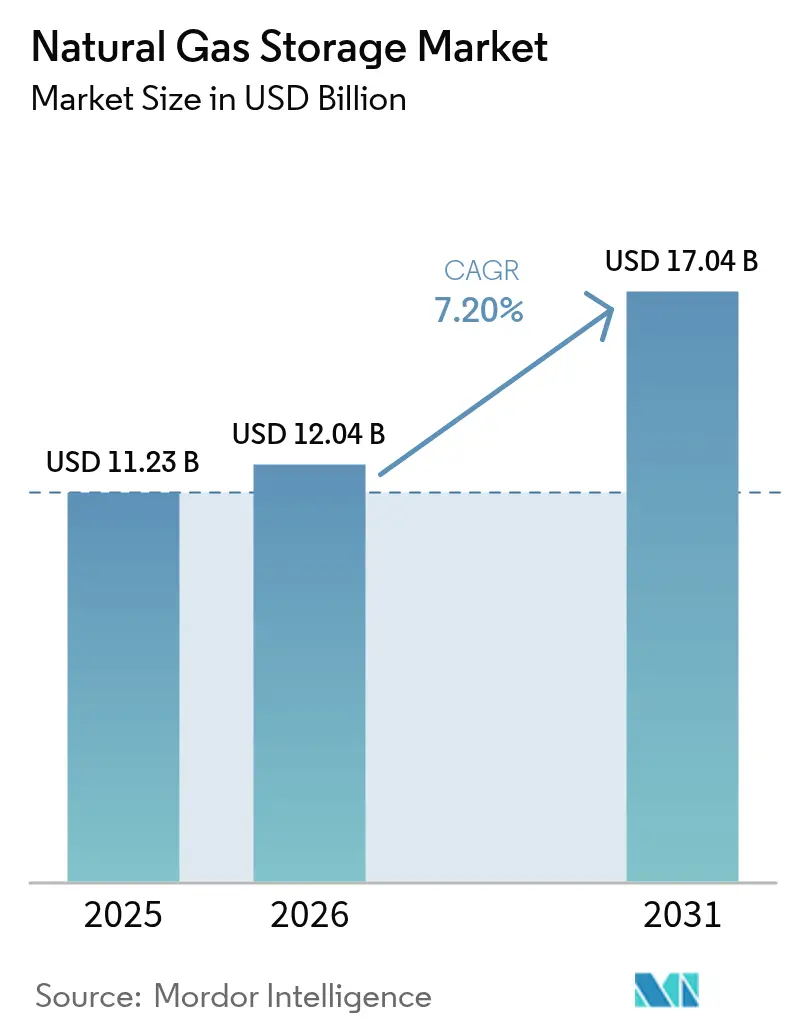
| Market Size (2026) | USD 12.04 Billion |
| Market Size (2031) | USD 17.04 Billion |
| Growth Rate (2026 - 2031) | 7.20% CAGR |
| Fastest Growing Market | Asia Pacific |
| Largest Market | North America |
| Market Concentration | Low |
Major Players *Disclaimer: Major Players sorted in no particular order Image © Mordor Intelligence. Reuse requires attribution under CC BY 4.0. | |
Natural Gas Storage Market Analysis by Mordor Intelligence
Natural Gas Storage market size in 2026 is estimated at USD 12.04 billion, growing from 2025 value of USD 11.23 billion with 2031 projections showing USD 17.04 billion, growing at 7.20% CAGR over 2026-2031.
Seasonal heating swings, rising LNG trade volumes, and the emergence of hydrogen blend regulations collectively underpin persistent demand growth across every major consuming region. Underground depleted reservoirs continue to drive capacity additions due to their cost advantage, while salt caverns gain traction in premium peak-shaving services thanks to their rapid cycling performance. The Asia-Pacific region displays the fastest capacity build-out as China accelerates its strategic reserve mandates and India scales up gas-fired power generation, whereas North America leverages its mature infrastructure near prolific shale basins to maintain the largest regional share of the natural gas storage market. Storage operators are increasingly bundling seasonal balancing with short-cycle services to maximise utilisation, a strategy that mitigates revenue pressure from battery storage technologies. Capital spending priorities are shifting toward emission-mitigating retrofits and hydrogen-ready upgrades to comply with evolving environmental regulations and capitalize on future low-carbon opportunities.
Key Report Takeaways
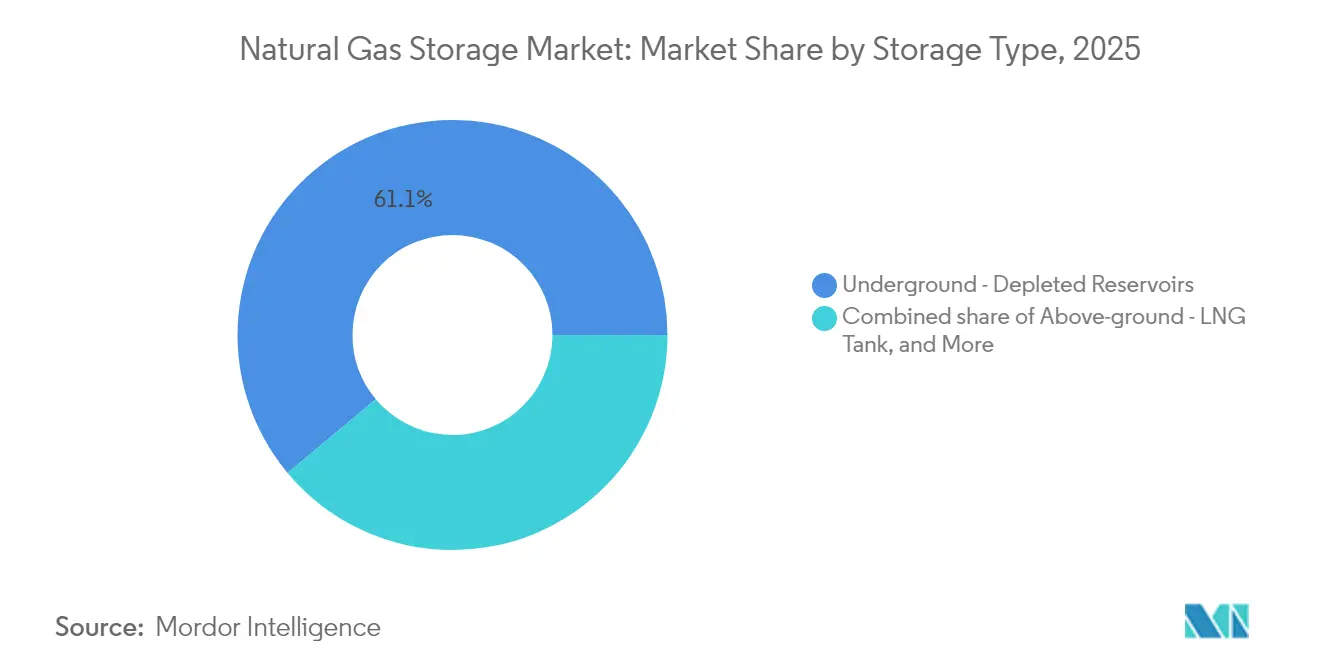
- By storage type, depleted reservoirs held 61.08% of the natural gas storage market share in 2025, while LNG tanks are projected to record a 9.22% CAGR to 2031.
- By mode of service, seasonal balancing accounted for 58.35% of the natural gas storage market size in 2025, and peak shaving is expected to advance at an 8.62% CAGR through 2031.
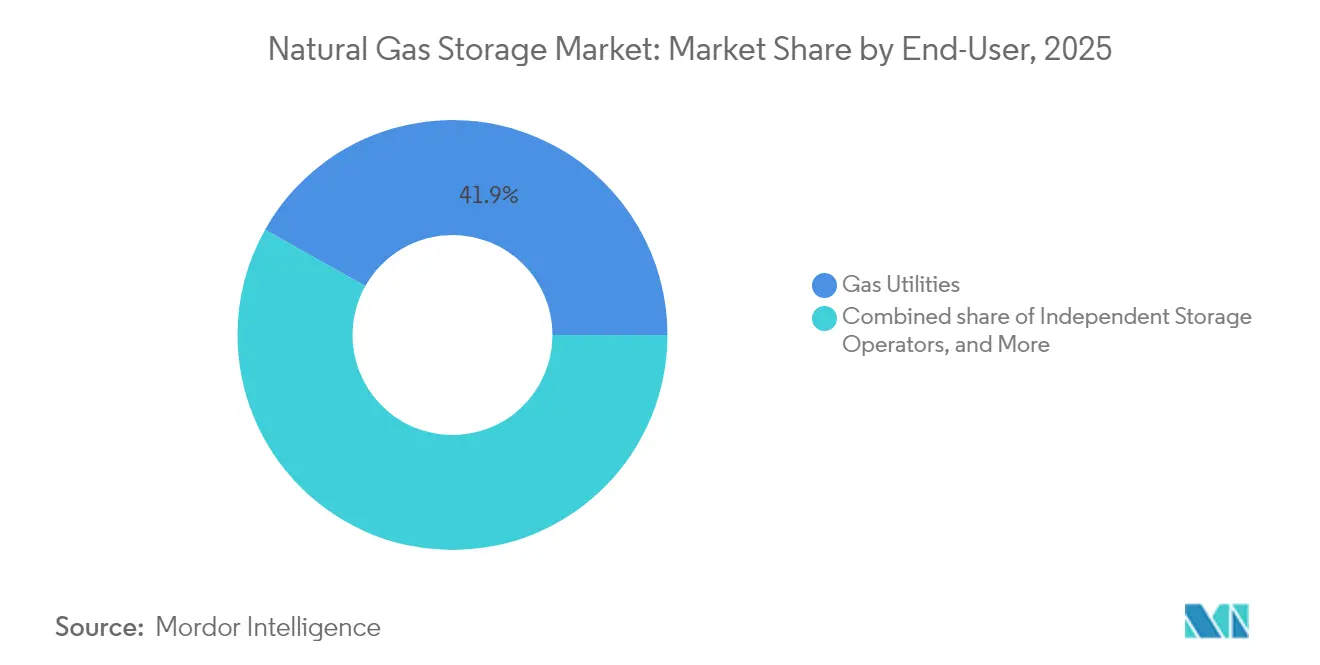
- By end-user, gas utilities commanded a 41.85% share of the natural gas storage market size in 2025, while independent operators posted the highest 8.95% CAGR toward 2031.
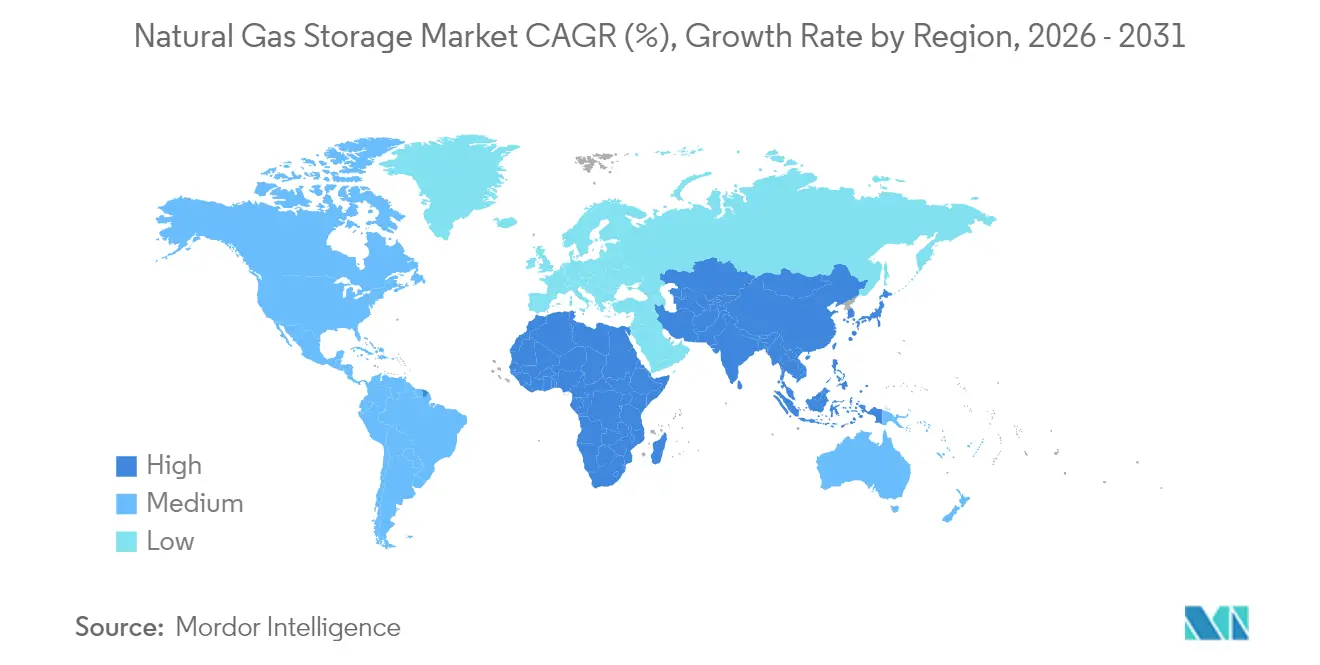
- By geography, North America led the natural gas storage market in 2025, accounting for a 35.10% revenue share, while the Asia-Pacific region is forecasted to post a 11.07% CAGR from 2025 to 2031.
Note: Market size and forecast figures in this report are generated using Mordor Intelligence’s proprietary estimation framework, updated with the latest available data and insights as of 2026.
Global Natural Gas Storage Market Trends and Insights
Drivers Impact Analysis*
| Driver | (~) % Impact on CAGR Forecast | Geographic Relevance | Impact Timeline |
|---|---|---|---|
| Growing gas-fired power generation demand | 1.50% | Global, with concentration in Asia-Pacific and North America | Medium term (2-4 years) |
| Expansion of global LNG trade & balancing need | 2.10% | Global, particularly Asia-Pacific and Europe | Long term (≥ 4 years) |
| Seasonal residential-heating demand swings | 1.80% | North America & Europe, with emerging impact in Asia | Short term (≤ 2 years) |
| Strategic-reserve mandates for energy security | 1.20% | Asia-Pacific core, spill-over to Europe and Middle East | Long term (≥ 4 years) |
| Hydrogen-blend regulations requiring flexible storage | 0.80% | Europe & North America, early adoption in select APAC markets | Long term (≥ 4 years) |
| Short-cycle shale-gas volatility near production basins | 0.60% | North America, particularly Permian and Haynesville regions | Medium term (2-4 years) |
| Source: Mordor Intelligence | |||
Growing Gas-Fired Power Generation Demand
Data-center expansion and grid peaking needs keep gas turbines in the spotlight, prompting utilities and independent producers to line up multi-year storage contracts that hedge against fuel supply volatility.[1]Robert Bryce, “Data Centers Fuel Natural Gas Reliance,” realclearenergy.com In the Asia-Pacific region, more than 25 GW of new combined-cycle capacity entering service between 2025 and 2028 is already supporting long-term storage bookings. North American operators observe heavier withdrawal profiles during summer heatwaves when air conditioning and renewable energy shortfalls coincide, reinforcing the natural gas storage market’s role in year-round reliability. Equipment lead times for new plants now exceed 30 months, which raises the option value of existing storage caverns located near major power hubs. Market participants, therefore, view firm storage rights as essential insurance in regions with capacity constraints.
Expansion of Global LNG Trade & Balancing Need
Qatar’s North Field program adds 16 MTPA of liquefaction by 2030, boosting global LNG supply by 85% and requiring additional storage to manage voyage timing gaps. US Gulf Coast export terminals also push cargoes toward Asia, intensifying congestion risks at key trans-shipment hubs. Storage hubs enable parcel aggregation that maximises vessel utilisation and captures price spreads when spot markets diverge, a practice especially pronounced in Europe, where TTF volatility has exceeded 60% since 2024. Emerging consumers, such as those in the Philippines, face a five-fold increase in LNG volumes through 2029, which accelerates above-ground tank construction schedules. Floating storage regasification units bridge the infrastructure gap while underscoring the structural shortfall of permanent capacity, cementing the natural gas storage market as a linchpin of LNG system flexibility.
Seasonal Residential-Heating Demand Swings
Heating demand continues to drive winter withdrawal cycles in temperate OECD regions, where buildings account for nearly 40% of total gas consumption. Polar vortex events compress withdrawal windows and expose vulnerabilities in pipeline deliverability, leading regulators to compel local distribution companies to allocate more line pack and contracted storage. European inventory minimums introduced after 2024, following Russian supply disruptions, now require all member states to achieve 90% fullness by 1 November, effectively ring-fencing storage volumes from commercial optimization. These rules increase base-load revenue stability for operators but intensify summer injection competition, elevating hub spreads that reward flexible cavern facilities. Asia-Pacific utilities are adopting similar winter preparation targets, expanding the natural gas storage market footprint in regions that have historically relied on oil-based peaking fuels.
Strategic-Reserve Mandates for Energy Security
China’s national oil and gas reserve framework targets storage capacity that exceeds commercial turnover rates by 30%, creating a floor under utilisation regardless of price cycles.[2]Center on Global Energy Policy, “Asia-Pacific Gas Security,” columbia.edu Inventory requirements translate into long-dated take-or-pay contracts, which improve bankability for large caverns and insulated above-ground tanks. Europe instituted comparable reserve obligations after 2024, stipulating minimum capacity bookings that are remunerated through regulated tariffs. Resource-rich states in the Middle East are also considering dedicated domestic storage to balance export commitments with local demand peaks. This policy wave secures revenue for the natural gas storage market while reducing exposure to spot demand variability.
Restraints Impact Analysis*
| Restraint | (~) % Impact on CAGR Forecast | Geographic Relevance | Impact Timeline |
|---|---|---|---|
| High cap-ex for salt-cavern development | -0.9% | Global, particularly acute in regions without existing salt formations | Long term (≥ 4 years) |
| Stringent methane-leakage rules increasing O&M cost | -1.3% | North America & Europe, with emerging impact in Asia-Pacific | Medium term (2-4 years) |
| Battery storage cannibalising peak-shaving revenues | -0.7% | Global, with highest impact in renewable-heavy grids | Medium term (2-4 years) |
| Environmental permitting complexity | -0.5% | North America & Europe, with varying impact in emerging markets | Long term (≥ 4 years) |
| Source: Mordor Intelligence | |||
High Cap-ex for Salt-Cavern Development
Greenfield salt storage requires an investment of USD 100–150 million for each billion cubic feet, which is almost double the cost of converting a depleted reservoir. Limited availability of suitable domes outside North America and Eastern Europe further inflates construction lead times. Financing costs rise because lenders require firm service agreements before approving debt, a hurdle that smaller developers struggle to clear. Environmental permitting often takes 18-24 months longer than for depleted fields, locking up capital during non-revenue-generating phases and diluting project returns. Although salt caverns deliver superior cycling rates, vital for peak shaving, budget overruns can shift customers toward alternative storage types, constraining the natural gas storage market penetration of cavern technology.
Stringent Methane-Leakage Rules Increasing O&M Cost
The US EPA Waste Emissions Charge, which ranges from USD 900 to USD 1,500 per metric ton of methane, incurs annual compliance expenses that approach 7% of revenue for older facilities. European continuous monitoring standards add USD 2-5 million each year for large sites through mandatory sensor networks and advanced leak detection. Smaller independents without integrated operations lose economies of scale, spurring consolidation as larger players buy distressed assets. While newer caverns equipped with low-bleed valves and automated vent capture incur lower penalties, retrofits at legacy reservoirs divert capital away from expansion. These costs weigh on the growth rate of the natural gas storage market, even as they drive technological upgrades.
*Our forecasts treat driver/restraint impacts as directional, not additive. The impact forecasts reflect baseline growth, mix effects, and variable interactions.
Segment Analysis
By Storage Type: Underground Dominance Faces LNG Challenge
Depleted reservoirs accounted for 61.08% of the natural gas storage market in 2025, primarily due to their low conversion costs and widespread geological availability. Salt caverns, despite higher construction costs, secure premium pricing for high-deliverability, peak-shaving services, and are also well-suited for future hydrogen storage. Aquifer projects remain modest because cushion-gas requirements lift working-gas economics. Above-ground LNG tanks show a 9.22% CAGR through 2031 as import terminals proliferate in Asia-Pacific and Africa to accommodate rising LNG cargo arrivals. Pressurized vessels serve niche industrial clusters where subsurface geology is unsuitable; however, their higher boil-off rates restrict their adoption. Regional policy on hydrogen blending and methane emissions increasingly shapes the technology mix, with operators favouring retrofitted caverns over new reservoirs in jurisdictions prioritising low-carbon readiness.
Underground facilities dominate base-load and seasonal balancing contracts that underpin cash flow stability in the natural gas storage market. LNG tank projects benefit from co-location with regasification or liquefaction plants, which allows integrated optimisation of marine scheduling and terminal send-out. Utilities and merchants alike increasingly structure hybrid offerings that combine subsurface capacity with above-ground tanks to diversify risk. Advancements in insulation and boil-off gas recovery further improve LNG tank economics, narrowing the cost gap with caverns for short-cycle service. Over the forecast period, technology selection will be driven by local geology, permitting timelines, and hydrogen preparedness, rather than a one-size-fits-all approach.


By Mode of Service: Peak-Shaving Gains on Seasonal Balancing
Seasonal balancing accounted for 58.35% of the natural gas storage market size in 2025, reflecting utilities’ need to match winter demand with summer surplus injection. Peak-shaving services are projected to record an 8.62% CAGR through 2031, as renewable variability and extreme weather events exacerbate short-duration demand spikes. Base-load storage retains relevance for strategic reserves and industrial supply security but faces slower growth as efficiency measures temper baseline consumption. Caverns with high cycling rates capture the lion’s share of peak-shaving revenue, whereas depleted fields and aquifers remain dominant in seasonal balancing, given their large working gas volumes.
Customers increasingly sign multi-service contracts that guarantee flexible withdrawal profiles, blurring the historical distinction between mode categories. For instance, a power utility may allocate 70% of its contracted volume to seasonal draws and reserve 30% for emergency peak demand. This shift supports higher asset utilisation, bolstering returns for facility owners. Operators that can dynamically reconfigure service allocations based on market signals will gain a competitive advantage, reinforcing strategic investments in control-system upgrades and analytics across the natural gas storage market.
By End-user: Independent Operators Challenge Utility Dominance
Gas utilities retained 41.85% of the natural gas storage market share in 2025, primarily due to their regulated cost recovery and embedded customer relationships. Independent storage operators are projected to grow at a 8.95% CAGR through 2031, as merchant models capitalize on arbitrage opportunities and tailor services to meet the needs of power generators, industrials, and LNG merchants. Power-sector demand continues to rise, driven by additional gas-fired capacity and resiliency needs in data-center-centric economies. Industrial customers are increasingly bypassing utilities, contracting directly with independent operators for bespoke capacity that aligns with their plant outage schedules and commodity procurement needs.
Utility dominance varies by region. In North America, rate-based incentives continue to encourage utilities to invest in new storage, while independents leverage FERC-approved market-based rates to expand in unregulated commercial hubs. Europe is seeing a shift toward merchant ownership, where unbundling rules separate network operations from asset investment. The Asia-Pacific region remains a mix of state-owned utilities and private consortia, with some piloting greenfield subsurface caverns. Competitive dynamics, therefore, hinge on regulatory frameworks, financing access, and the ability to deploy hydrogen-ready assets across the natural gas storage market.
Geography Analysis
North America held a 35.10% revenue lead in the natural gas storage market in 2025 and continues to invest in brownfield expansions that minimise permitting delays. The region’s shale-driven production volatility keeps working gas turnover high, which sustains merchant spreads during seasonal and intra-day price swings. Canada’s Cavern Alliance programme encourages joint utility-merchant ventures that pool credit strength for large-scale expansions.
The Asia-Pacific’s natural gas storage market size is growing at the fastest rate, supported by an 11.07% CAGR that reflects China’s reserve mandates and India’s expanding gas-to-power footprint. ASEAN importers are accelerating LNG tank and floating storage installations to buffer procurement lead times and hedge against spot market exposure. South Korea and Japan are exploring salt cavern sites to complement their existing above-ground tanks, aiming to diversify their storage technology portfolios.
Europe maintains balanced growth anchored by strategic inventory obligations introduced after 2024. Underground depleted reservoirs in Germany and the Netherlands dominate capacity, yet new salt cavern clusters in Eastern Europe enhance peak-shaving optionality. Southern European LNG importers are investing in tank additions to manage seasonal demand surges driven by tourism. Emerging markets in the Middle East and Africa, led by Saudi Arabia and South Africa, are piloting depleted reservoir conversions to underpin domestic gas-to-power programs, establishing a nascent regional natural gas storage market that is expected to accelerate beyond 2027.

Competitive Landscape
The natural gas storage market remains moderately fragmented, although regional concentration varies according to geology and regulation. Integrated midstream groups combine storage with pipeline and LNG terminals to capture optimisation synergies that independent operators cannot fully replicate. Williams’ USD 1.95 billion purchase of Hartree Partners’ storage assets in August 2024 reinforced the premium valuations for location-advantaged caverns.[4]Securities and Exchange Commission, “Williams Form 8-K on Hartree Acquisition,” sec.gov Sempra Infrastructure invests heavily in hydrogen-ready upgrades at Port Arthur LNG Phase 2, signalling strategic alignment with low-carbon policy trajectories.
Independent merchants expand through greenfield salt cavern projects where they can secure long-term service agreements with power producers seeking high-deliverability rates. Regional utilities continue to dominate in regulated jurisdictions, yet they increasingly form joint ventures with merchants to finance costly emission control retrofits. Technology adoption patterns reveal that early investment in fibre-optic leak detection, automated valve controls, and materials compatible with hydrogen blends confers operating cost advantages. Market participants that balance regulatory reliability with commercial agility will strengthen their position in the evolving natural gas storage market.
Natural Gas Storage Industry Leaders
Gazprom PJSC
China National Petroleum Corp.
Engie SA
TC Energy Corp.
Kinder Morgan Inc.
- *Disclaimer: Major Players sorted in no particular order

Recent Industry Developments
- February 2025: Sempra Infrastructure and Japan Bank for International Cooperation signed a strategic collaboration MOU to enhance LNG supply chains and advance carbon capture initiatives, with storage positioned as a critical component of the transition.
- January 2025: QatarEnergy ordered 128 additional LNG tankers as part of its 200-vessel “floating pipeline” strategy, creating significant demand for coordinated storage infrastructure.
- July 2024: Sempra Infrastructure signed an EPC contract with Bechtel for Port Arthur LNG Phase 2, a USD 13 billion investment that will require substantial storage capacity.
- July 2024: QatarEnergy acquired a 20% stake in the Suriname Block 5 upstream acreage, underscoring its long-term LNG supply and related storage needs.


Global Natural Gas Storage Market Report Scope
The natural gas storage market report include:
| Underground - Depleted Reservoirs |
| Underground - Salt Caverns |
| Underground - Aquifers |
| Above-ground - LNG Tanks |
| Above-ground - Pressurised Vessels |
| Base-Load Storage |
| Peak-Shaving Storage |
| Seasonal Balancing Storage |
| Gas Utilities |
| Independent Storage Operators |
| Power Generators |
| Industrial and Commercial Consumers |
| North America | United States |
| Canada | |
| Mexico | |
| Europe | Germany |
| United Kingdom | |
| France | |
| Italy | |
| NORDIC Countries | |
| Russia | |
| Rest of Europe | |
| Asia-Pacific | China |
| India | |
| Japan | |
| South Korea | |
| ASEAN Countries | |
| Australia and New Zealand | |
| Rest of Asia-Pacific | |
| South America | Brazil |
| Argentina | |
| Colombia | |
| Rest of South America | |
| Middle East and Africa | Saudi Arabia |
| United Arab Emirates | |
| Qatar | |
| South Africa | |
| Egypt | |
| Rest of Middle East and Africa |
| By Storage Type | Underground - Depleted Reservoirs | |
| Underground - Salt Caverns | ||
| Underground - Aquifers | ||
| Above-ground - LNG Tanks | ||
| Above-ground - Pressurised Vessels | ||
| By Mode of Service | Base-Load Storage | |
| Peak-Shaving Storage | ||
| Seasonal Balancing Storage | ||
| By End-user | Gas Utilities | |
| Independent Storage Operators | ||
| Power Generators | ||
| Industrial and Commercial Consumers | ||
| By Geography | North America | United States |
| Canada | ||
| Mexico | ||
| Europe | Germany | |
| United Kingdom | ||
| France | ||
| Italy | ||
| NORDIC Countries | ||
| Russia | ||
| Rest of Europe | ||
| Asia-Pacific | China | |
| India | ||
| Japan | ||
| South Korea | ||
| ASEAN Countries | ||
| Australia and New Zealand | ||
| Rest of Asia-Pacific | ||
| South America | Brazil | |
| Argentina | ||
| Colombia | ||
| Rest of South America | ||
| Middle East and Africa | Saudi Arabia | |
| United Arab Emirates | ||
| Qatar | ||
| South Africa | ||
| Egypt | ||
| Rest of Middle East and Africa | ||


Key Questions Answered in the Report
What is the current size of the natural gas storage market?
The natural gas storage market size stood at USD 12.04 billion in 2026 and is projected to reach USD 17.04 billion by 2031.
Which region leads the natural gas storage market?
North America led with 35.10% revenue share in 2025, supported by extensive depleted reservoirs and salt caverns near shale production hubs.
What is driving the fastest growth in Asia-Pacific?
Strategic-reserve mandates in China and expanding gas-fired power generation in India are propelling an 11.07% CAGR for Asia-Pacific storage capacity.
Why are salt caverns important for hydrogen blending?
Salt caverns offer superior material compatibility and rapid cycling rates, making them well-suited for networks targeting up to 20% hydrogen blends.
How do methane-leak regulations affect storage operators?
New EPA and EU rules impose higher monitoring and repair costs, which raise operating expenses for legacy facilities and accelerate consolidation.
What service mode is growing fastest?
Peak-shaving storage is advancing at an 8.62% CAGR through 2031 as renewable intermittency boosts demand for rapid-response gas deliveries.
Page last updated on:


