
Oil And Gas Electric Packer Market Size and Share
Market Overview
| Study Period | 2021 - 2031 |
|---|---|
| Forecast Data Period | 2026 - 2031 |
| Historical Data Period | 2021 - 2024 |
| Growth Rate | 2.96 % |
| Fastest Growing Market | North America |
| Largest Market | North America |
| Market Concentration | Medium |
Major Players *Disclaimer: Major Players sorted in no particular order Image © Mordor Intelligence. Reuse requires attribution under CC BY 4.0. | |
Oil And Gas Electric Packer Market Analysis by Mordor Intelligence
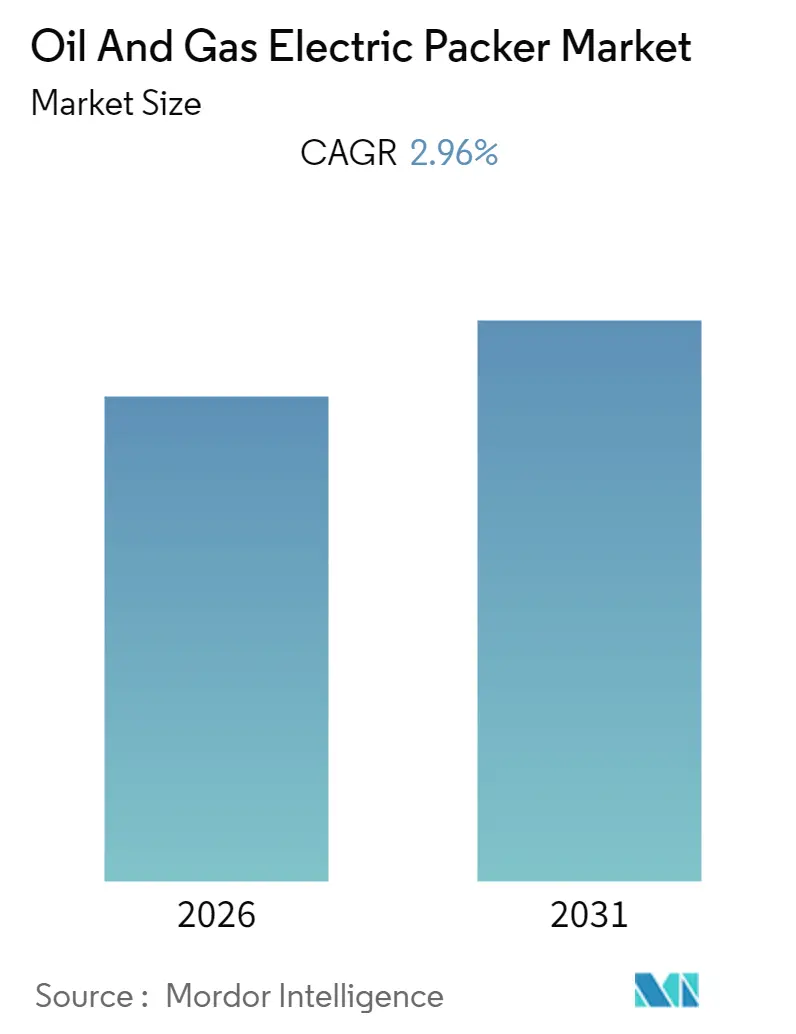
The Oil and Gas Electric Packer Market size is expected to register a CAGR of greater than 2.96% during the forecast period 2026-2031.
- Retrievable packers, owing to its ability to reuse is expected to witness higher growth rate in the forecast period.
- The exploration of deepwater and ultra-deepwater projects and increasing investment in the shale are likely to create ample opportunities for the market players in the near future.
- North America, with its vast reserves of recoverable shale gas and tight oil reserves in the world, is dominating in packer demand and is expected to continue its dominance in the forecast period.
Note: Market size and forecast figures in this report are generated using Mordor Intelligence’s proprietary estimation framework, updated with the latest available data and insights as of 2026.
Global Oil And Gas Electric Packer Market Trends and Insights
Retrievable Packer to Witness Significant Growth
- A retrievable packer is a type of packer that is run and retrieved on a running string or production string, unlike a permanent production packer that is set in the casing or liner before the production string is run.
- In Australia, the Browse gas project is expected to be developed in the forecast period. With an estimated capacity of 15.4 trillion cubic feet of dry gas, multiple wells in the future are likely to drive the demand of retrievable packers.
- Africa's offshore deep and ultra-deep space has continued to attract oil explorers and producers in increasing their operations, especially in Southern and Western Africa. Significant projects have either started or have been approved, in turn, creating opportunities for the packer market.
- In Russia, Gazprom Neft continues to conduct studies on its Bazhenov acreage and is targeting 40,000 b/d of production from shale by 2023. With this significant demand for the packers can be expected in the forecast period.
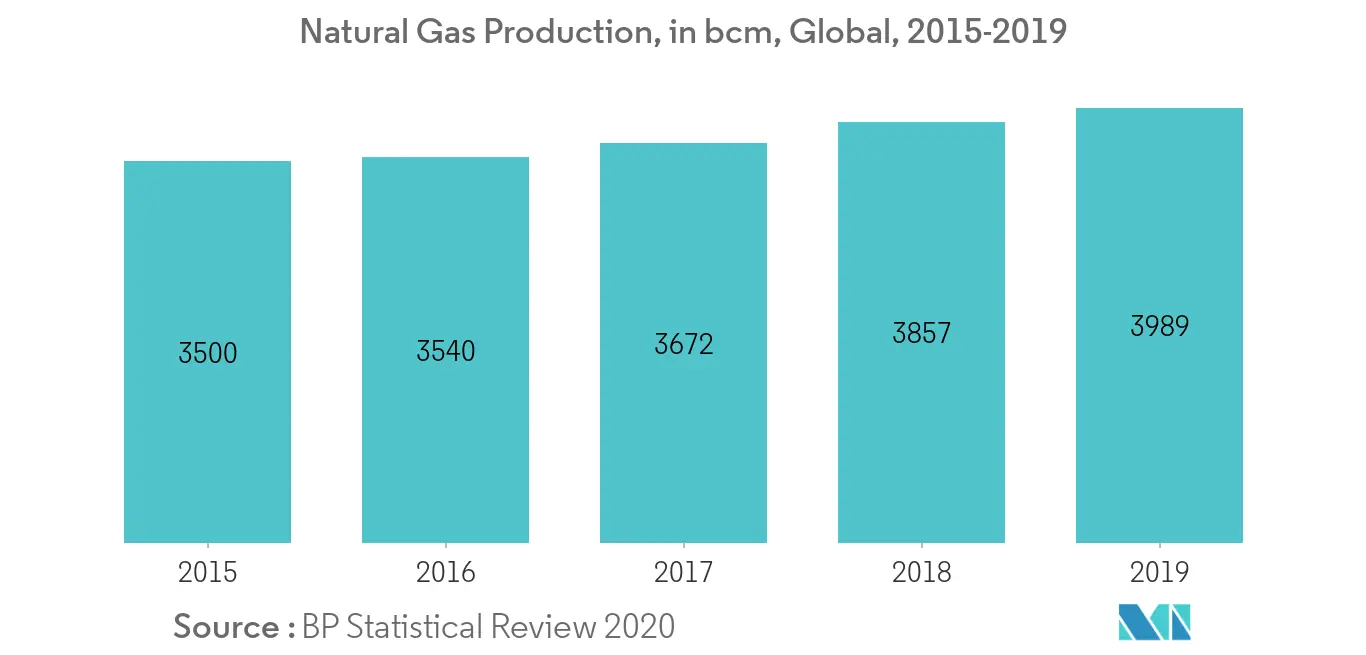
- With total gas production of 3,989 bcm, the market of oil and gas is growing and simultaneously driving the need for a retrievable packers.
- Due to the COVID-19 outbreak, delay in upstream projects is expected. However, later in the forecast period, with the initiation of new projects and completion of drilled wells, the market of the packers is expected to grow considerably


North America to Dominate the Market
- The United States is one of the largest producers of crude oil and natural gas, accounting for around 18% and 23% of the global production, respectively, in 2019. The production surged in 2019, mainly due to robust drilling in its shale reserves, led by the Permian Basin.
- It is expected that around USD 76 billion will be spent on 97 upcoming oil and gas projects in the country between 2018 and 2025 in the United States. Such robust growth in terms of new projects is projected to create a demand for completion and well intervention projects.
- As of April 2019, 8390 drilled wells are incomplete in the country, with the Permian Basin having the largest share. These wells are expected to be completed in the coming years, creating ample opportunity for the packer system in the future.
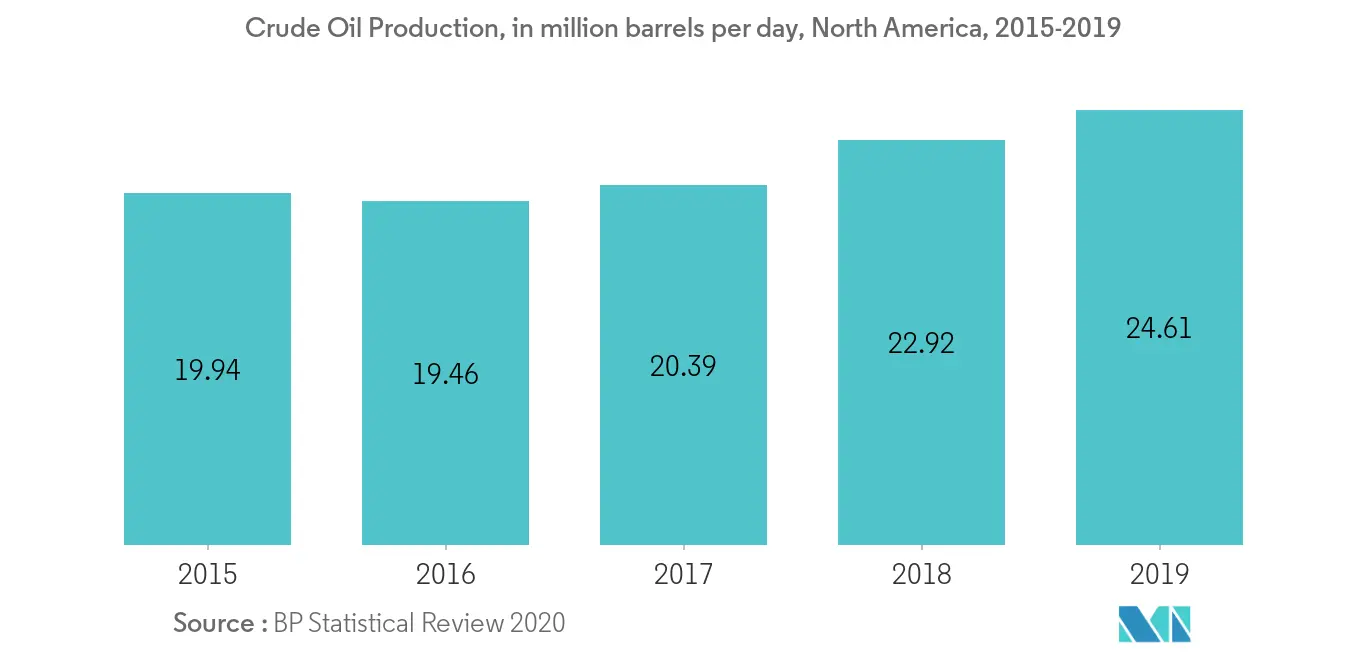
- With increased crude oil production to more than 24 million barrels per day, the North American region is expected to create sufficient demand and dominate the market.
- With increasing investment in Canada and the United States and the availability of vast reserves of shale gas and sand reserves, the region is leading the market of packers.
Regulatory Landscape
Regulation affecting electric packers is largely enforced through well-integrity and offshore safety regimes that reference industry standards for downhole isolation and completion equipment. In the United States offshore market, the Bureau of Safety and Environmental Enforcement (BSEE) regulates equipment and operating practices under 30 CFR Part 250, and compliance commonly aligns with API requirements used for packer qualification and performance validation.
A key compliance anchor for packer design and testing is API Specification 11D1 (Fourth Edition, 2021), which defines validation levels for demanding environments, including HPHT conditions (for example, V0-HR and V3-HR). In June 2026, BSEE issued a final rule (effective August 10, 2026) incorporating updated production measurement and safety-related industry standards into 30 CFR Part 250, reinforcing how referenced standards are used in equipment selection and documentation. BSEE also advanced a February 2026 proposed rule to revise elements of the 2023 Well Control Rule to streamline submissions and clarify recordkeeping, which shapes how operators document well-control and related equipment practices across the offshore lifecycle.
Value Chain Analysis
The electric packer value chain starts with upstream inputs such as specialty elastomers and metal components, then moves through tool design, qualification testing, manufacturing and assembly, and finally integration into completion and intervention systems. Material sourcing is a key node, since high-performance elastomers used in sealing elements (including HNBR-type formulations) and reinforcement materials can face constrained availability. That elevates lead-time risk for OEMs and for oilfield service providers that standardize specific element chemistries for HPHT and sour-service operating envelopes.
In the midstream stage, major OEMs and service companies (for example, Baker Hughes and SLB) supply electronically actuated or electric inflatable packer platforms configured for annular sealing, zonal isolation, and ESP feedthrough applications. Technical differentiation is increasingly tied to remote or electronic setting mechanisms, fail-safe overrides, and compatibility with power cables and control lines. In the downstream portion of the chain, offshore and deepwater programs more often follow direct OEM-to-operator or OEM-to-integrator procurement with project-specific qualification, while North American onshore activity relies more heavily on regional oilfield service hubs and distributor networks for fast-cycle delivery, redress, and field support tied to completion schedules.
Competitive Landscape
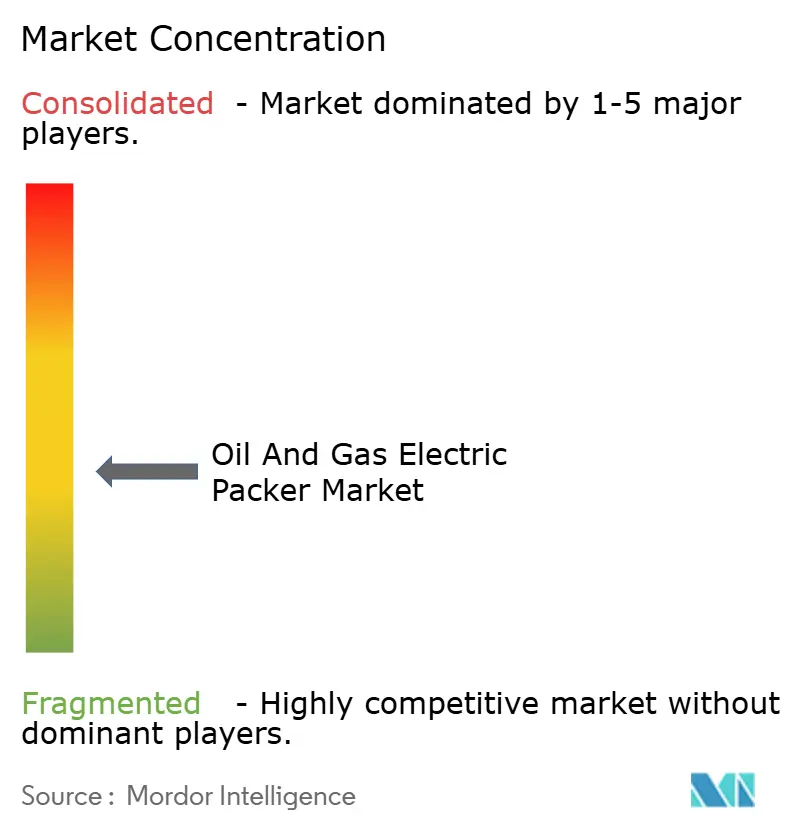
The oil and gas electric packer market is moderately consolidated. Some of the major players include National Oilwell Varco Inc, Halliburton Company, Weatherford International plc, Baker Hughes Company, and Schlumberger Limited.
Oil And Gas Electric Packer Industry Leaders
Halliburton Company
Weatherford International plc
Schlumberger Limited
Baker Hughes Company
National Oilwell Varco Inc
- *Disclaimer: Major Players sorted in no particular order

Market Opportunities and Future Outlook
Near-term opportunity areas concentrate on workflows where electric actuation reduces rig time and operational complexity, particularly in selective stimulation, rigless intervention, and complex completions that require reliable zonal isolation without pipe manipulation. Electrically activated tools that support single-run, multiple set-unset operations and real-time downhole monitoring align with operator needs for faster stage execution and improved wellbore integrity verification, especially where pressure and temperature monitoring and precise depth correlation (for example, CCL-based positioning) are used to manage multi-zone treatments.
Field activity and product roadmaps also point to whitespace in integrated, electronically controlled completion architectures that combine packers with conveyance and intervention systems. For example, in January 2026, Packers Plus Energy Services Inc. reported field trials of its ePLUS Dart technology across the Montney, Cardium, and Charlie Lake formations in Canada, highlighting continued innovation around higher stage-count stimulation and completion efficiency. On the supply side, OEM offerings such as Baker Hughes electronically actuated annular packer platforms and SLB electric inflatable packer systems emphasize commercialization of remote setting, modular configurations, and line-feedthrough capabilities, which support adoption in wells that use ESPs, chemical injection lines, and increasingly instrumented completion strings.
Recent Industry Developments
- June 2026: The United States Bureau of Safety and Environmental Enforcement (BSEE) issued a final rule updating 30 CFR Part 250 by incorporating revised industry standards used in offshore production measurement and safety practices, with an effective date of August 10, 2026. This action reinforces the compliance importance of referenced standards for equipment selection, qualification, and documentation in offshore completions where packer performance and validation practices are scrutinized.
- January 2026: Packers Plus Energy Services Inc. reported field trials of its ePLUS Dart technology across the Montney, Cardium, and Charlie Lake formations in Canada, targeting higher stage-count stimulation execution. The deployment highlights continued operator and service-company focus on faster, repeatable stimulation workflows, which increases pull-through for advanced isolation and completion hardware used to manage multi-stage treatments.
- June 2025: Weatherford International plc published a technical paper on rigless well intervention using a straddle packer system deployed via digital slickline. The work illustrates how intervention programs are moving toward lower-footprint, rigless operations that reduce well downtime and avoid workover complexity, supporting demand for packer systems that are compatible with digitally enabled conveyance and controlled setting/unsetting in live-well conditions.


Research Methodology Framework and Report Scope
Market Definition and Coverage
This market covers electric packers used in oil and gas wells to create zonal isolation during well completion, intervention, or production work, where setting and control are enabled through electric actuation and related downhole connectivity.
Scope exclusions: We exclude swellable, purely hydraulic or mechanical packers, and packers used outside oil and gas wells (such as geothermal or water wells), unless explicitly sold and specified for oil and gas use.
Segmentation Overview
- Type
- Retrievable
- Non-Retrievable
- Location of Deployment
- Offshore
- Onshore
- Geography
- North America
- Europe
- Asia-Pacific
- South America
- Middle-East and Africa
Data Sources, Market Sizing, and Validation
Desk Research
Desk work starts by mapping where electric packers are actually pulled through demand, which is mainly completion and workover activity in onshore and offshore wells. We lean on public series that indicate activity and spending direction, such as the EIA for drilling and production context, the IEA for broader upstream investment signals, and Baker Hughes rig counts for near term momentum.
To anchor volumes and pricing logic, we also review sources such as OPEC reports, national petroleum regulator releases where available, and peer reviewed SPE style papers that describe operating envelopes (temperature, pressure, intervention needs) that drive packer selection. Company filings, investor decks, and reputable trade coverage help confirm product positioning and regional exposure, and paid subscriptions for company financials, news, and patent databases are used selectively to cross check timelines and product maturity. The examples above are illustrative only, and many other public and paid sources were also used to collect, validate, and clarify data points.
Primary Interviews and Surveys
Primary discussions were used to convert activity signals into a realistic purchase pool for electric packers, and then to confirm adoption conditions in different well types and operating environments. We spoke with a mix of completion and intervention stakeholders, supply side engineering and sales roles, and procurement and operations contacts across major producing regions so assumptions on deployment mix, typical tool strings, and replacement cycles could be checked and adjusted.
Distribution of primary research fieldwork respondents
| Company type | Respondent position | Region |
|---|---|---|
| Top tier: 26% | CXOs: 15% | APAC: 44% |
| Mid tier: 59% | Functional/Unit leaders: 40% | EMEA: 36% |
| Smaller Players: 15% | Managers: 45% | Americas: 20% |
Market-Sizing & Forecasting
The sizing model begins from a demand pool view, where upstream completion and workover activity is reconstructed by region using public drilling and production indicators, and then filtered through the likely share of wells and intervals that need electric setting and control. After that, average units per job and typical service intensity are applied, which are then translated into value using region specific price bands validated through interviews.
To keep the totals grounded, we corroborate the outputs with selective bottom-up approximations, such as sampling supplier shipment narratives, channel checks on tool availability, and a simple ASP times volume build for a few high activity basins, before final numbers are set. Key inputs used in the model include rig counts and completion intensity, offshore versus onshore split, well complexity markers (such as high pressure, high temperature needs), intervention frequency for producing wells, and the expected change in electric completion adoption where digital control and repeatability matter. Forecasts rely on scenario analysis supported by a light multivariate regression, where drivers like upstream capex direction, rig activity, and offshore project cycle timing are combined with interview based expectations on adoption and pricing progression. Where direct volume data is thin, gaps are handled by using proxy indicators from the closest comparable basin and then scaling by relative activity and known operator mix.
Data Validation & Update Cycle
Validation is done by checking whether the model tracks independent signals, such as completion related spending direction, regional activity swings, and the expected offshore share shift, and then reviewing outliers at a segment and region level. When a number moves sharply versus the prior run, the assumptions behind deployment mix, unit counts, or pricing are revisited, followed by targeted re-contacts with industry participants to confirm what changed.
Before sign-off, the work is reviewed in multiple steps, including analyst to analyst checks on formulas, unit logic, and year alignment so the outputs stay internally consistent. Reports are refreshed annually, and interim updates are triggered when material events occur, such as large project sanctions, sharp changes in drilling activity, or supply constraints that can move lead times and realized prices. Right before delivery, a final pass is completed so clients receive the latest view tied to the most recent public indicators.
Mordor Intelligence's Oil and Gas Electric Packer Market Size Measured Against Other Published Estimates
Published market sizes for electric packers can look far apart because the scope line is not the same across studies, and because the assumed penetration of electric setting in completions is not always validated. Differences also show up when offshore work is treated like a simple extension of onshore volumes, or when pricing is modeled with a single global average even though tool specs and service conditions vary widely.
The main gap comes from whether the estimate quietly expands into the wider packer universe (hydraulic and mechanical tools, plus adjacent completion equipment) and then applies one blended growth path. In our work, Mordor Intelligence keeps the count limited to oil and gas electric packers only, and it ties demand to completion and intervention activity proxies, followed by interview checks on adoption conditions and realistic price bands by region and deployment type.
Benchmark comparison
| Source | Market Size | Gaps in Research Methodology |
|---|---|---|
| Mordor Intelligence | USD 0.00 B (2026) | |
| Trade Journal A | USD 0.68 B (2025) | Often reported under a broader oil and gas packer label, which can mix hydraulic and mechanical packers with electric variants, and may use a single average price without separating offshore and onshore tool requirements. |
| Industry Publisher B | USD 1.66 B (2025) | May resemble a hydraulic packer or completion equipment sizing that rolls up multiple packer technologies and nearby completion tools, thereby inflating totals relative to an electric-only definition and shifting the year basis through different conversion timing. |
The spread in the table is mostly explained by scope creep into non-electric packers and by simplified assumptions on adoption and pricing, which can overstate value in high activity years. By keeping the variables tied to observable completion and intervention signals and then pressure-testing the key multipliers through interviews, the final estimate stays traceable and repeatable when the market is updated.


Key Questions Answered in the Report
What is the current Oil and Gas Packer Market size?
The Oil and Gas Packer Market is projected to register a CAGR of greater than 2.96% during the forecast period (2026-2031)
Who are the key players in Oil and Gas Packer Market?
Halliburton Company, Weatherford International plc, Schlumberger Limited, Baker Hughes Company and National Oilwell Varco Inc are the major companies operating in the Oil and Gas Packer Market.
Which is the fastest growing region in Oil and Gas Packer Market?
North America is estimated to grow at the highest CAGR over the forecast period (2026-2031).
Which region has the biggest share in Oil and Gas Packer Market?
In 2025, the North America accounts for the largest market share in Oil and Gas Packer Market.
What years does this Oil and Gas Packer Market cover?
The report covers the Oil and Gas Packer Market historical market size for years: 2020, 2021, 2022, 2023 and 2024. The report also forecasts the Oil and Gas Packer Market size for years: 2026, 2027, 2028, 2029, 2030 and 2031.
Page last updated on:


 Your data is secure and never sold or shared.


