Market Overview
| Study Period | 2021 - 2031 |
|---|---|
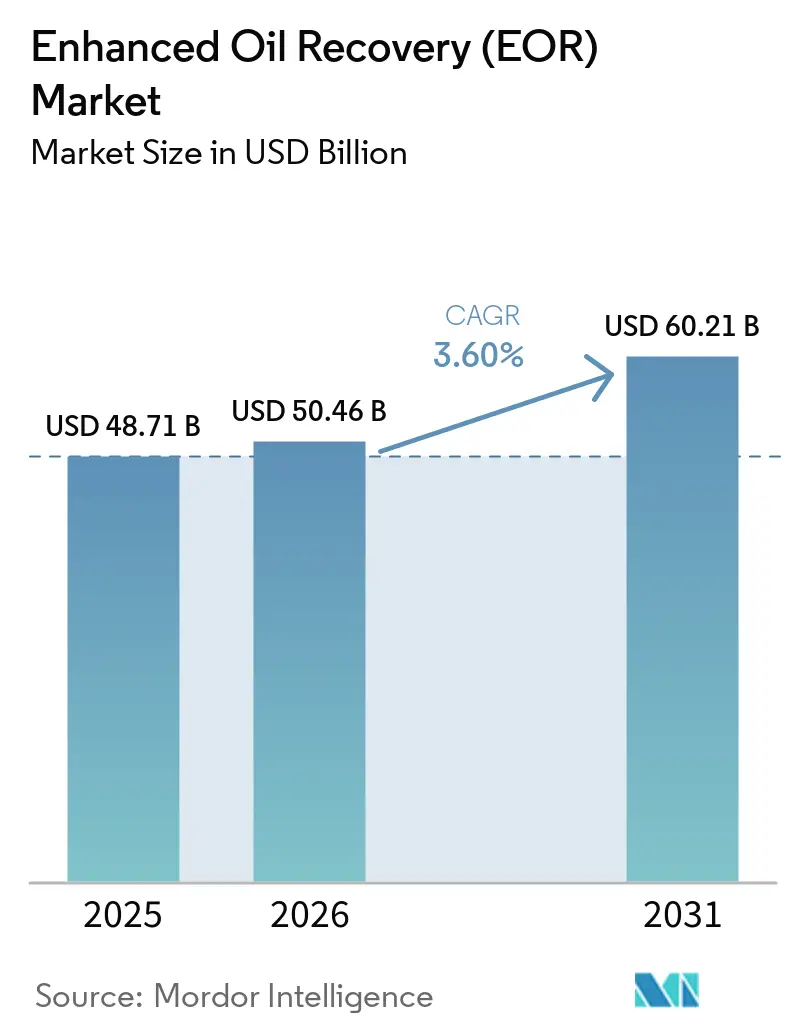
| Market Size (2026) | USD 50.46 Billion |
| Market Size (2031) | USD 60.21 Billion |
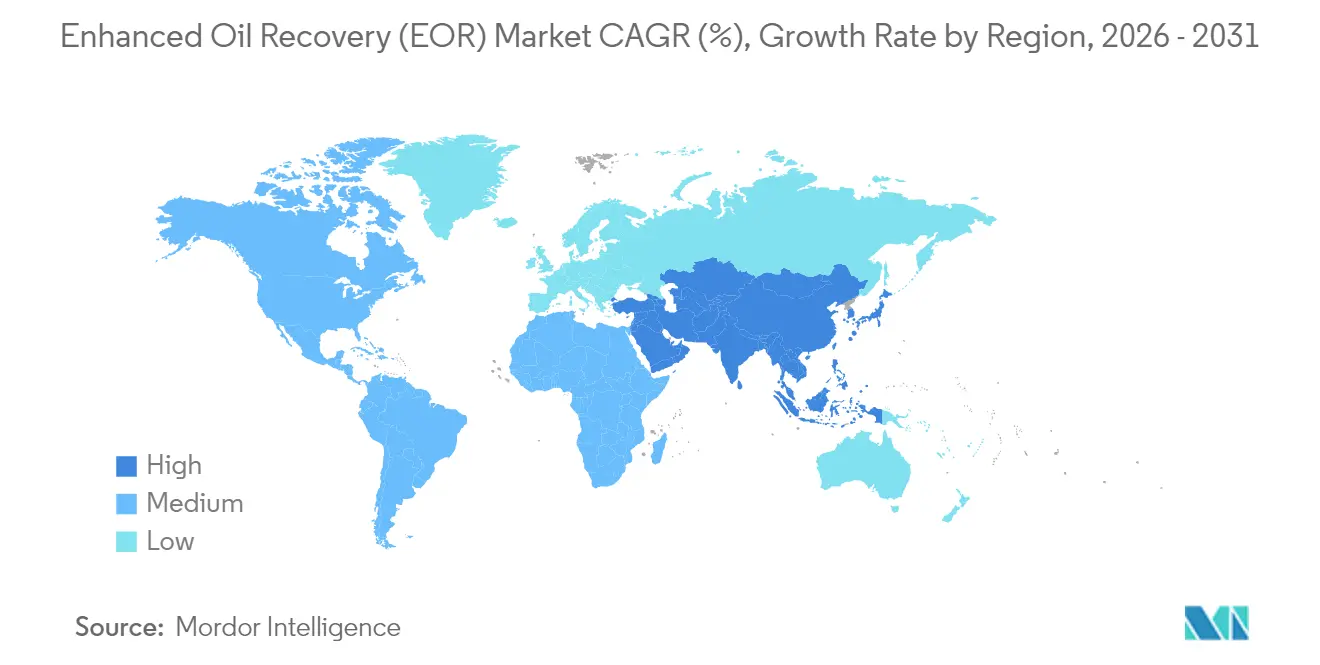
| Growth Rate (2026 - 2031) | 3.60% CAGR |
| Fastest Growing Market | Asia Pacific |
| Largest Market | North America |
| Market Concentration | Medium |
Major Players *Disclaimer: Major Players sorted in no particular order Image © Mordor Intelligence. Reuse requires attribution under CC BY 4.0. | |
Enhanced Oil Recovery (EOR) Market Analysis by Mordor Intelligence
The Enhanced Oil Recovery market size is expected to grow from USD 48.71 billion in 2025 to USD 50.46 billion in 2026 and is forecast to reach USD 60.21 billion by 2031 at 3.6% CAGR over 2026-2031.
Operator spending is shifting from exploration toward optimization of mature fields, and tax incentives that treat injected CO₂ as a regulated emission credit underpin investment confidence. Thermal methods remain the volume workhorse because they deliver quick payback in heavy-oil basins, yet the fastest capacity additions are occurring in CO₂ flooding schemes that meet both production and carbon-management objectives. Field-service firms are converging subsurface modelling with real-time production analytics, cutting well-screening time and lowering per-barrel lifting costs. Capital increasingly flows toward projects that integrate capture, transport, and injection of anthropogenic CO₂, effectively tying future supply growth to the pace of CCUS infrastructure build-out.
Key Report Takeaways
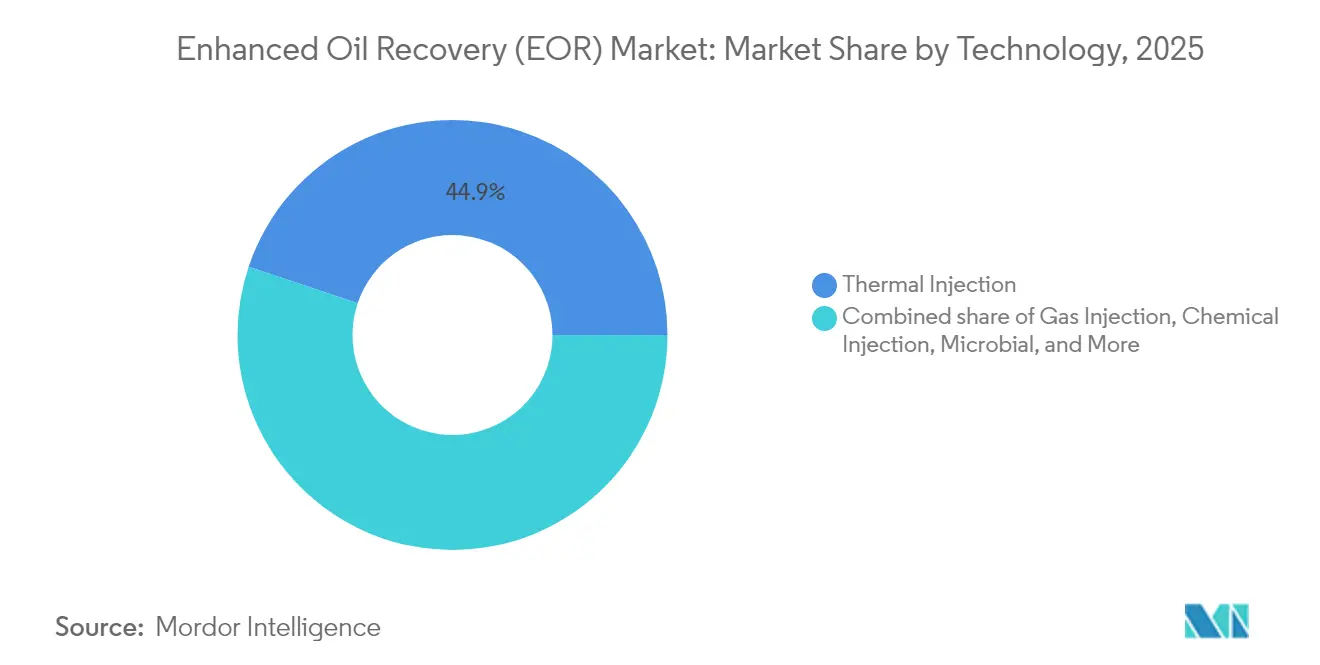
- By technology, thermal extraction held 44.85% of the enhanced oil recovery market share in 2025, whereas gas injection is projected to grow at a 6.42% CAGR through 2031.
- By reservoir type, sandstone led with 46.35% share of the enhanced oil recovery market size in 2025, while tight/shale formations are set to expand at a 7.59% CAGR.
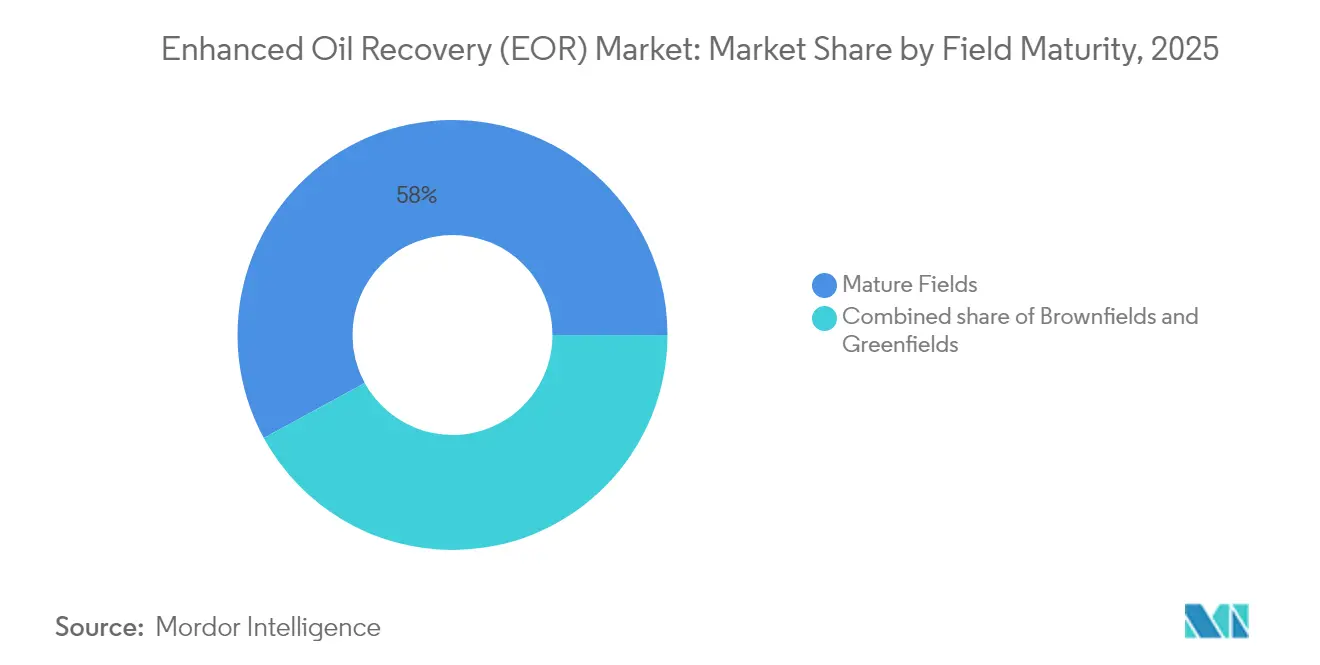
- By field maturity, mature assets accounted for 57.95% of total deployments in 2025; greenfield developments are forecast to advance at an 8.14% CAGR to 2031.
- By location of deployment, onshore operations captured 86.10% of 2025 activity; however, offshore projects are rising at a 7.08% CAGR due to deep-water innovations.
- By geography, North America maintained a 39.75% revenue share in 2025 for the enhanced oil recovery market, whereas Asia-Pacific is expected to log the fastest 7.86% CAGR through 2031.
Note: Market size and forecast figures in this report are generated using Mordor Intelligence’s proprietary estimation framework, updated with the latest available data and insights as of 2026.
Global Enhanced Oil Recovery (EOR) Market Trends and Insights
Drivers Impact Analysis*
| Driver | (~) % Impact on CAGR Forecast | Geographic Relevance | Impact Timeline |
|---|---|---|---|
| Depleting conventional reserves pushing tertiary recovery | +1.2% | Global, with concentration in North America & Middle East | Long term (≥ 4 years) |
| Government-backed CO₂ tax incentives & CCUS build-out | +0.8% | North America & EU, expanding to Asia-Pacific | Medium term (2-4 years) |
| Mature fields in N. America & Middle East nearing decline curves | +0.6% | North America & Middle East core regions | Medium term (2-4 years) |
| CO₂ availability via new blue/green hydrogen projects | +0.4% | Global, with early deployment in industrial clusters | Long term (≥ 4 years) |
| Offshore digital-rock analytics cutting EOR screening cost | +0.3% | Global offshore regions, led by North Sea & Gulf of Mexico | Short term (≤ 2 years) |
| Low-salinity nanofluid blends lowering chemical dose | +0.2% | Global, with focus on high-temperature reservoirs | Medium term (2-4 years) |
| Source: Mordor Intelligence | |||
Depleting Conventional Reserves Pushing Tertiary Recovery
Global production still relies on reservoirs first drilled 30 or more years ago, and primary plus secondary techniques leave as much as 60% of original oil in place[1]Baker Hughes, “Global Mature Fields Solutions,” bakerhughes.com. Operators are therefore prioritizing tertiary methods that can be layered onto existing infrastructure with minimal surface disruption. Improved reservoir imaging now pinpoints previously unswept zones, enabling selective injection that boosts recovery without the need for extensive infill drilling. Digital twins further reduce trial-and-error cycles by simulating fluid behaviour before field execution. As discovery volumes shrink and development wells move into more costly frontier acreage, EOR becomes the economically rational route for sustaining supply, insulating the enhanced oil recovery market against crude price swings.
Government-Backed CO₂ Tax Incentives & CCUS Build-out
Production tax credits and severance tax reductions in key jurisdictions compress the payback periods for CO₂ flood projects[2]Wyoming Legislature, “SF0018 – Severance Tax Updates,” wyoleg.gov. The United States' 45Q credit adds a separate revenue stream for every tonne of CO₂ permanently stored, converting emissions compliance into a cash flow. Saudi Arabia's plan for a 9 million tonnes per year capture hub at Jubail demonstrates how state entities are integrating capture, transport, and sequestration into a single, unified value chain. Fiscal support lowers the weighted average cost of capital, drawing ESG-constrained investors into barrels that now qualify as carbon-neutral. As more regions impose explicit carbon prices, the enhanced oil recovery market gains structural tailwinds rather than cyclic boosts.
Mature Fields in North America & Middle East Nearing Decline Curves
Permian, Eagle Ford, and Ghawar wells share a common challenge: falling pressure that cuts natural flow. Repressurization via miscible CO₂ or nitrogen extends plateau production at a fraction of the cost of a green field. The Middle East benefits from extensive surface injection grids built for past water floods, which slash new capital expenditures. Asset-life extension also protects social revenue for NOCs, adding a geopolitical imperative to maintain output. Where produced-water disposal regulations are in effect, projects that recycle water into EOR schemes gain dual compliance and cost savings. Collectively, these ageing basins provide a predictable demand floor for suppliers active in the enhanced oil recovery market.
CO₂ Availability via New Blue/Green Hydrogen Projects
Large-scale blue hydrogen captures CO₂ from reforming units that already sit inside refinery complexes, giving EOR operators high-purity streams without extra separation equipment[3]Energy Analytics Institute, “Hydrogen Growth and CO₂ Supply,” energyanalyticsinstitute.org. Canada’s Strathcona Resources secured USD 2 billion for a hub that pipes hydrogen-derived CO₂ to nearby heavy-oil fields, reinforcing how industrial clustering reduces transport tariffs STRATHCONA.CA. Similar schemes are emerging in Europe and Asia, coupling electrolytic hydrogen off-take contracts with long-term CO₂ supply agreements for oil producers. The circular linkage aligns decarbonisation targets with hydrocarbon recovery, broadening the customer base for capture vendors and anchoring CO₂ prices, which stabilises project economics across the enhanced oil recovery market.
Restraints Impact Analysis*
| Restraint | (~) % Impact on CAGR Forecast | Geographic Relevance | Impact Timeline |
|---|---|---|---|
| High cap-ex & opex of thermal processes under price volatility | -0.7% | Global, with acute impact in high-cost regions | Short term (≤ 2 years) |
| Water-use & emissions permitting delays | -0.4% | North America & EU, with spillover to APAC | Medium term (2-4 years) |
| Food-grade CO₂ shortages outside U.S. pilot clusters | -0.3% | Global excluding North America core regions | Short term (≤ 2 years) |
| ESG-linked lenders excluding incremental-oil projects | -0.2% | Global, led by European & North American banks | Medium term (2-4 years) |
| Source: Mordor Intelligence | |||
High Cap-ex & Opex of Thermal Processes Under Price Volatility
Steam generators, water-treatment units, and fuel gas lines make thermal EOR the most capital-intensive option. Margins compress sharply when crude prices dip or natural-gas feedstock rises, causing operators to defer workovers. Regions with water scarcity must pay to truck in freshwater or install large recycling plants, adding operational burden. Emerging down-hole combustion tools promise efficiency gains yet still demand specialised crews and hardware logistics. These cost sensitivities divert budgets toward gas or chemical methods, limiting near-term expansion of steam-dominated projects in the enhanced oil recovery market.
ESG-Linked Lenders Excluding Incremental-Oil Projects
A growing share of European and North American banks now screen out loans linked to new hydrocarbon volumes, even if CO₂ storage is part of the plan. Where financing is available, interest premiums exceed those for renewable energy sources, raising hurdle rates. Operators must therefore fund developments using internal cash flow or seek sovereign partners, which slows final investment decisions. The policy shift concentrates project ownership in integrated majors and NOCs with strong balance sheets, trimming opportunities for smaller independents within the enhanced oil recovery market industry.
*Our forecasts treat driver/restraint impacts as directional, not additive. The impact forecasts reflect baseline growth, mix effects, and variable interactions.
Segment Analysis
By Technology: Thermal Scale Meets Rapid Gas-Injection Growth
Thermal methods contributed 44.85% of 2025 revenue, underscoring their entrenched role in heavy-oil plays across Canada and California. Steam-assisted gravity drainage and cyclic steam stimulation continue to yield predictable barrels, even as operators retrofit boilers with burners that use low-carbon fuels. Gas injection, led by miscible CO₂ flooding, is posting the quickest global adoption, with a 6.42% CAGR outlook through 2031. The enhanced oil recovery market size for gas-injection projects is therefore expanding faster than any other technology cohort. Hybrid processes, low-salinity water alternating with CO₂ or polymer slugs, are gaining traction in pilots because they combine the sweep of water floods with the miscibility gains of solvents. Laboratory breakthroughs in biosurfactants and electromagnetic heating show promise but remain at pre-commercial stages.
The competitiveness of gas injection rises where industrial hubs guarantee a low-cost anthropogenic CO₂ supply. U.S. Gulf-Coast clusters already mix refinery off-gases into trunk lines that feed Permian injectors, while Middle East operators leverage ammonia and methanol plants for the same purpose . Steam remains dominant in bitumen deposits because reservoir viscosity still rules process choice. Nevertheless, the drive to curb scope-1 emissions nudges producers toward solvent-assisted steam generation, further blurring technology boundaries inside the enhanced oil recovery market.


By Reservoir Type: Sandstone Dominance Faces Tight-Rock Momentum
Sandstone delivers 46.35% of current volumes thanks to its favourable porosity and long history of water flooding that preconditions reservoirs for tertiary stages. The enhanced oil recovery market share, led by sandstone, is under pressure from unconventional formations, where tight/shale reservoirs are expected to show a 7.59% CAGR outlook. Micro-fracture networks formed during horizontal drilling serve as pathways for surfactant and gas slugs, facilitating significant incremental recovery despite low matrix permeability. Carbonates pose wettability challenges; nonetheless, surfactant-polymer blends and smart-water techniques are incrementally improving recovery factors, especially in Middle East super-giants.
Digital-rock analytics helps operators model pore-scale flow in heterogenous carbonates, trimming design time for chemical formulations. Heavy-oil reservoirs still require thermal inputs due to their high viscosity, yet solvent-steamed hybrids are reducing water requirements by up to 30%, thereby easing ESG pressures. As geology dictates method selection, suppliers offering multi-technology portfolios capture greater value across reservoir classes, thereby reinforcing their competitive positioning in the enhanced oil recovery market.
By Field Maturity: Mature Assets Anchor Volume, Greenfields Accelerate
Mature fields account for 57.95% of active projects, primarily due to the shortening of payback horizons resulting from infrastructure and production data. Producer strategies now include integrated work scopes—such as tubing replacements, artificial lift upgrades, and CO₂ injection networks—executed as single campaigns. Brownfield programs that layer EOR onto phased redevelopments benefit from shared cap-ex, enhancing economic resilience in the enhanced oil recovery market. Greenfield designs are shifting: subsurface teams model tertiary requirements at the appraisal stage, installing high-pressure separators and flowlines sized for future injectants. This practice underpins the 8.14% CAGR projected for greenfields, the fastest within the maturity spectrum.
Regulators in Norway and Brazil are increasingly requiring immiscible gas capacity on new FPSOs, normalizing early-life EOR. Such planning lowers lifetime lifting costs and drives service demand for high-pressure pumps and corrosion-resistant steels. Thus, the enhanced oil recovery market size linked to greenfield installations rises even before first oil, reflecting a systemic move towards proactive reservoir management.
By Location of Deployment: Onshore Strength With Offshore Upswing
Onshore basins accounted for 86.10% of deployments in 2025, reflecting easier logistics and lower service rates. The Middle East, the U.S. Lower-48, and China dominate this count, each with extensive surface grids that are prime for secondary and tertiary cycles. However, offshore is set to post a 7.08% CAGR as operators adapt subsea pumping and insulated flowlines for deep-water conditions. High-integrity pressure-protection systems on BP’s Ginger and Shell’s Gato do Mato prove deep reservoirs can safely accommodate miscible gas flooding. Early lessons from Brazil’s pre-salt carbon-rich fluids show that CO₂ re-injection also mitigates gas flaring caps imposed by regulators.
In shallow waters, compact steam generators mounted on wellhead platforms extend thermal EOR to marginal heavy-oil fields. The capital learning curve is flattening, narrowing the cost gap with onshore equivalents and widening the addressable opportunity set for vendors active in the enhanced oil recovery market.
Geography Analysis
North America leads the enhanced oil recovery market with a 39.75% revenue share in 2025, generated by large-scale CO₂ floods in the Permian Basin and thermal operations in Alberta’s oil sands. Federal and state incentives such as the 45Q credit and Wyoming’s severance-tax exemption materially lower project breakevens, while an 8,000-km pipeline grid delivers anthropogenic CO₂ at the field gate. ExxonMobil’s 2024 earnings of USD 33.7 billion underscore the importance of integrated capture-to-pipeline business models in driving profitability, even under volatile market conditions.
The Asia-Pacific region is the fastest-growing, forecasted to grow at an 7.86% CAGR through 2031. PetroChina’s polymer-flood programs in Daqing and CNOOC’s pilot gas injection in Bohai Bay illustrate rapid technology diffusion. PTTEP earmarked THB 261 billion for 2025 upstream cap-ex, including pilot miscible gas systems in the Gulf of Thailand. Australia’s Darwin CCUS hub and Japan’s long-running offshore CO₂ reinjection trials further expand regional skill sets. As industrial decarbonisation progresses, hydrogen-linked CO₂ supply clusters in China, Korea, and India will reinforce growth fundamentals for the enhanced oil recovery market.
Europe maintains steady momentum, anchored by the UK and Norway, where North Sea operators integrate CO₂ storage with extended-reach drilling to tap attic oil zones. EU taxonomy rules classify permanent CO₂ storage as sustainable, unlocking green bond financing channels for selected assets. The Middle East leverages giant naturally fractured carbonates; Saudi Aramco’s Jubail hub targets 9 million tons per year (t/y) capture, much of which will enter miscible-gas floods at Ghawar and other super-giants. South America’s growth centres on Brazilian pre-salt FPSOs equipped for reinjection loops and Venezuelan heavy-oil blocks poised for solvent-steam hybrids once sanctions ease in the enhanced oil recovery market.
Together, geography-specific policy and resource conditions shape divergent adoption curves; yet, each region now embeds EOR into its long-term supply planning, thereby cementing demand across the enhanced oil recovery market.

Competitive Landscape
Competitive Landscape
Competition is moderate, with integrated majors, NOCs, and diversified service firms controlling the highest-value segments. Firms owning capture technology, pipeline access, and reservoir expertise secure differentiated margins because regulators increasingly link CO₂ handling to enhanced oil recovery approvals. SLB’s USD 7.1 billion ChampionX acquisition deepens its chemical toolkit while adding artificial-lift synergies that cut client opex. Baker Hughes packages compressors, flexible pipe, and monitoring software into turnkey CO₂ management offerings. Halliburton’s autonomous fracturing suite enables precise proppant placement, improving primary recovery and setting the stage for later chemical slugs.
National firms also shape the field. Petrobras advances subsea CO₂ separation that suits its pre-salt context, while Saudi Aramco scales solvent-assisted steam in carbonate-heavy oil layers. Technology alliances are pivotal: SLB and Shell’s expanded Petrel™ agreement embeds shared data-model libraries that shorten appraisal timelines. Capital access is a dividing line; ESG restrictions steer Western lenders toward projects with verifiable carbon storage credits, advantaging companies that can document net-zero pathways. Consequently, portfolios that combine production gains with emissions reduction are best positioned to capture the growing value pool in the enhanced oil recovery market.
Two emergent white-space arenas intensify competitive focus. Offshore deep-water EOR requires high-pressure-rated subsea equipment, providing entry points for manufacturers of HIPPS manifolds. Meanwhile, unconventional reservoir EOR unlocks demand for nano-fluids and reservoir-friendly polymers. Firms that integrate digital twins, fibre-optic sensing, and advanced analytics will likely outpace rivals that focus solely on mechanical solutions. Overall, strategic alignment with carbon regulations, coupled with demonstrable reservoir performance, defines leadership in the enhanced oil recovery industry.
Enhanced Oil Recovery (EOR) Industry Leaders
Schlumberger Ltd.
Halliburton Company
Baker Hughes Company
Exxon Mobil Corp.
Shell plc
- *Disclaimer: Major Players sorted in no particular order


Recent Industry Developments
- June 2025: Chevron and Halliburton deployed intelligent fracturing in the Colorado shale to enhance reservoir contact. The collaboration integrates Chevron's hydraulic fracturing with Halliburton's ZEUS IQ platform.
- May 2025: ExxonMobil committed USD 1.5 billion to deep-water Nigeria projects that incorporate advanced recovery systems. The investment is planned between the second quarter of 2025 and 2027.
- March 2025: In Brazil's pre-salt oil and gas fields, Baker Hughes and Petrobras are collaborating to develop and evaluate advanced flexible pipes. These pipes are engineered to resist CO₂-induced stress corrosion cracking (SCC-CO2).
- March 2025: Shell has inked contracts worth over USD 1 billion for its Gato do Mato FPSO (Floating Production, Storage, and Offloading) project in Brazil, featuring enhanced oil recovery (EOR) capabilities.


Global Enhanced Oil Recovery (EOR) Market Report Scope
The enhanced oil recovery (EOR) market report includes:
By Technology
| Gas Injection (CO2 Miscible Flooding, Nitrogen Injection, Hydrocarbon Gas Injection) |
| Thermal Injection (Steam Flooding, In-situ Combustion, Cyclic Steam Stimulation) |
| Chemical Injection (Polymer Flooding, Surfactant-Polymer (SP), Alkali-Surfactant-Polymer (ASP), Nanofluid EOR) |
| Microbial EOR (Biosurfactant Flooding, Biopolymer Flooding) |
| Hybrid and Emerging (Low-Salinity Waterflooding, CO2-WAG, EM-Assisted Heating) |
By Reservoir Type
| Sandstone |
| Carbonate |
| Heavy Oil and Bitumen |
| Tight/Shale |
By Field Maturity
| Mature Fields |
| Brownfields |
| Greenfields |
By Location of Deployment
| Onshore |
| Offshore |
By Geography
| North America | United States |
| Canada | |
| Mexico | |
| Europe | Germany |
| United Kingdom | |
| France | |
| Italy | |
| NORDIC Countries | |
| Russia | |
| Rest of Europe | |
| Asia-Pacific | China |
| India | |
| Japan | |
| South Korea | |
| ASEAN Countries | |
| Rest of Asia-Pacific | |
| South America | Brazil |
| Argentina | |
| Rest of South America | |
| Middle East and Africa | Saudi Arabia |
| United Arab Emirates | |
| Qatar | |
| South Africa | |
| Egypt | |
| Rest of Middle East and Africa |
| By Technology | Gas Injection (CO2 Miscible Flooding, Nitrogen Injection, Hydrocarbon Gas Injection) | |
| Thermal Injection (Steam Flooding, In-situ Combustion, Cyclic Steam Stimulation) | ||
| Chemical Injection (Polymer Flooding, Surfactant-Polymer (SP), Alkali-Surfactant-Polymer (ASP), Nanofluid EOR) | ||
| Microbial EOR (Biosurfactant Flooding, Biopolymer Flooding) | ||
| Hybrid and Emerging (Low-Salinity Waterflooding, CO2-WAG, EM-Assisted Heating) | ||
| By Reservoir Type | Sandstone | |
| Carbonate | ||
| Heavy Oil and Bitumen | ||
| Tight/Shale | ||
| By Field Maturity | Mature Fields | |
| Brownfields | ||
| Greenfields | ||
| By Location of Deployment | Onshore | |
| Offshore | ||
| By Geography | North America | United States |
| Canada | ||
| Mexico | ||
| Europe | Germany | |
| United Kingdom | ||
| France | ||
| Italy | ||
| NORDIC Countries | ||
| Russia | ||
| Rest of Europe | ||
| Asia-Pacific | China | |
| India | ||
| Japan | ||
| South Korea | ||
| ASEAN Countries | ||
| Rest of Asia-Pacific | ||
| South America | Brazil | |
| Argentina | ||
| Rest of South America | ||
| Middle East and Africa | Saudi Arabia | |
| United Arab Emirates | ||
| Qatar | ||
| South Africa | ||
| Egypt | ||
| Rest of Middle East and Africa | ||


Key Questions Answered in the Report
What is the current size of the Enhanced Oil Recovery (EOR) Market?
The enhanced oil recovery market size is USD 50.46 billion in 2026 and is projected to reach USD 60.21 billion by 2031.
Which technology segment is growing the fastest?
Gas injection, particularly miscible CO₂ flooding, is expanding at a 6.42% CAGR, the highest among all technology classes.
Why is Asia-Pacific the fastest-growing region?
Aggressive deployment in China, new CCUS hubs and rising offshore projects drive an 7.86% regional CAGR through 2031.
How do government incentives affect project economics?
Credits such as the U.S. 45Q and state-level tax reductions add revenue streams that shorten payback periods and attract ESG-constrained capital.
What restrains thermal EOR adoption?
High capital and operating costs, coupled with exposure to fuel-price volatility, make steam-based projects sensitive to crude-price downturns.
Who are the leading companies in the Enhanced Oil Recovery (EOR) industry?
Integrated majors such as ExxonMobil, Shell, Chevron and service leaders like SLB and Baker Hughes hold the largest project portfolios.
Page last updated on:


