
Market Overview
| Study Period | 2021 - 2031 |
|---|---|
| Forecast Data Period | 2026 - 2031 |
| Base Year Market Size (2025) | USD 4.11 Billion |
| Market Size (2026) | USD 4.39 Billion |
| Market Size (2031) | USD 6.01 Billion |
| Growth Rate (2026 - 2031) | 6.48 % |
| Market Concentration | Medium |
Major Players *Disclaimer: Major Players sorted in no particular order Image © Mordor Intelligence. Reuse requires attribution under CC BY 4.0. | |
Europe Oil And Gas Storage Tank Market Analysis by Mordor Intelligence
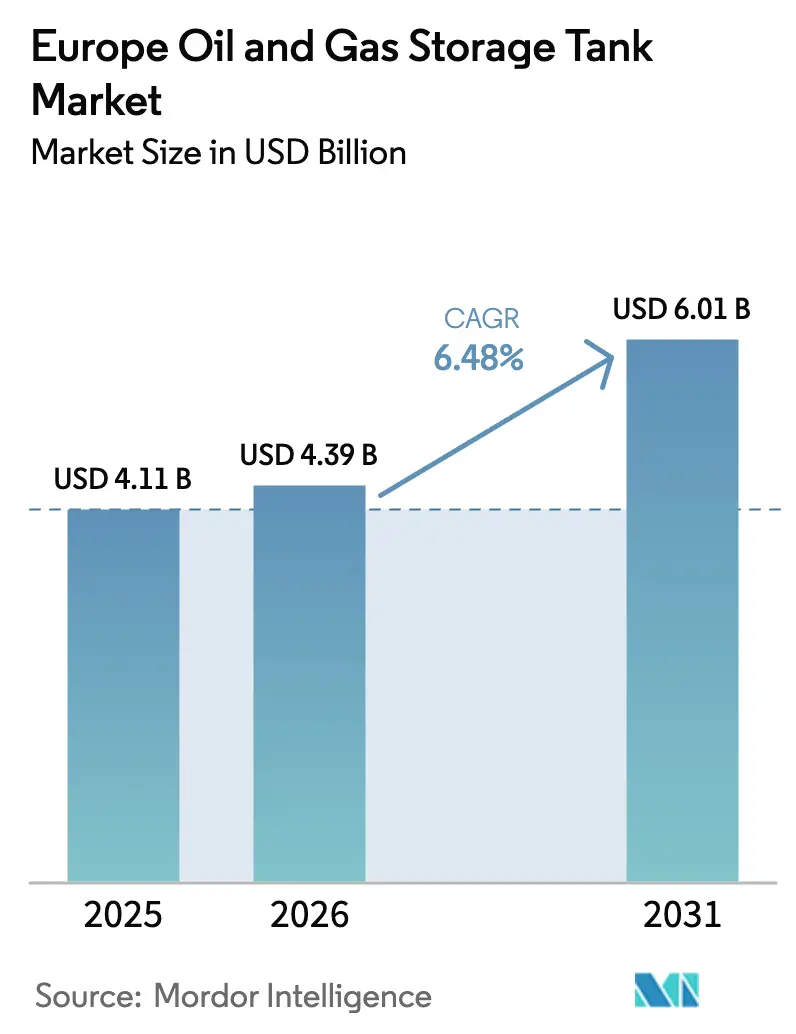
The Europe Oil And Gas Storage Tank Market size is projected to be USD 4.11 billion in 2025, USD 4.39 billion in 2026, and reach USD 6.01 billion by 2031, growing at a CAGR of 6.48% from 2026 to 2031.
This growth reflects steady capital spending on multi-fuel tank farms that can accommodate liquefied natural gas (LNG), hydrogen, and advanced biofuels in addition to crude oil and refined products. Floating-roof replacements mandated by tighter volatile-organic-compound (VOC) limits, the commissioning of LNG import terminals in Germany and the Netherlands, and rising strategic-reserve targets across the European Union are the principal revenue drivers. Conversely, declining petroleum demand, stringent environmental compliance costs, and persistent community opposition extend payback horizons for newbuild projects. Competitive intensity remains moderate because the top five independent operators control about 40% of third-party storage capacity, leaving room for regional specialists that emphasize digital-twin maintenance and modular tank solutions.
Key Report Takeaways
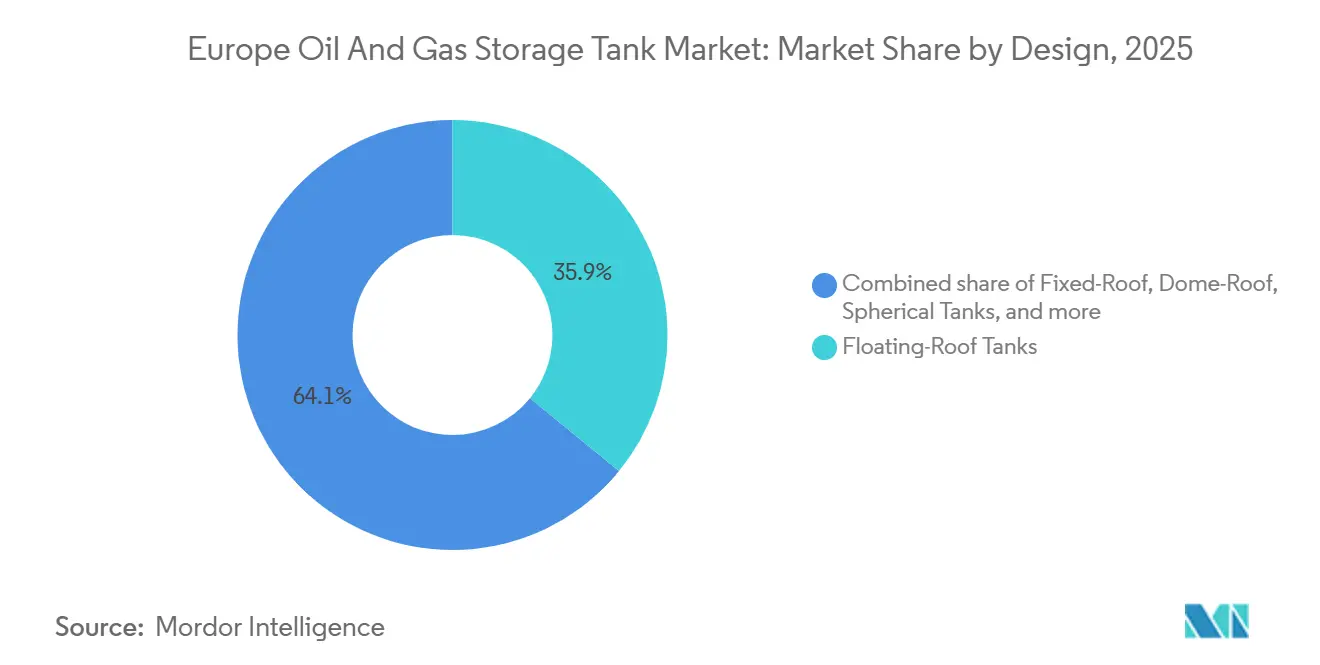
- By design, floating-roof tanks captured 35.9% revenue share in 2025; the segment is forecast to expand at a 7.5% CAGR through 2031.
- By tank type, above-ground vessels held 70.2% of Europe's oil & gas storage tank market share in 2025, while mobile and modular units are expected to post the fastest 8.9% CAGR to 2031.
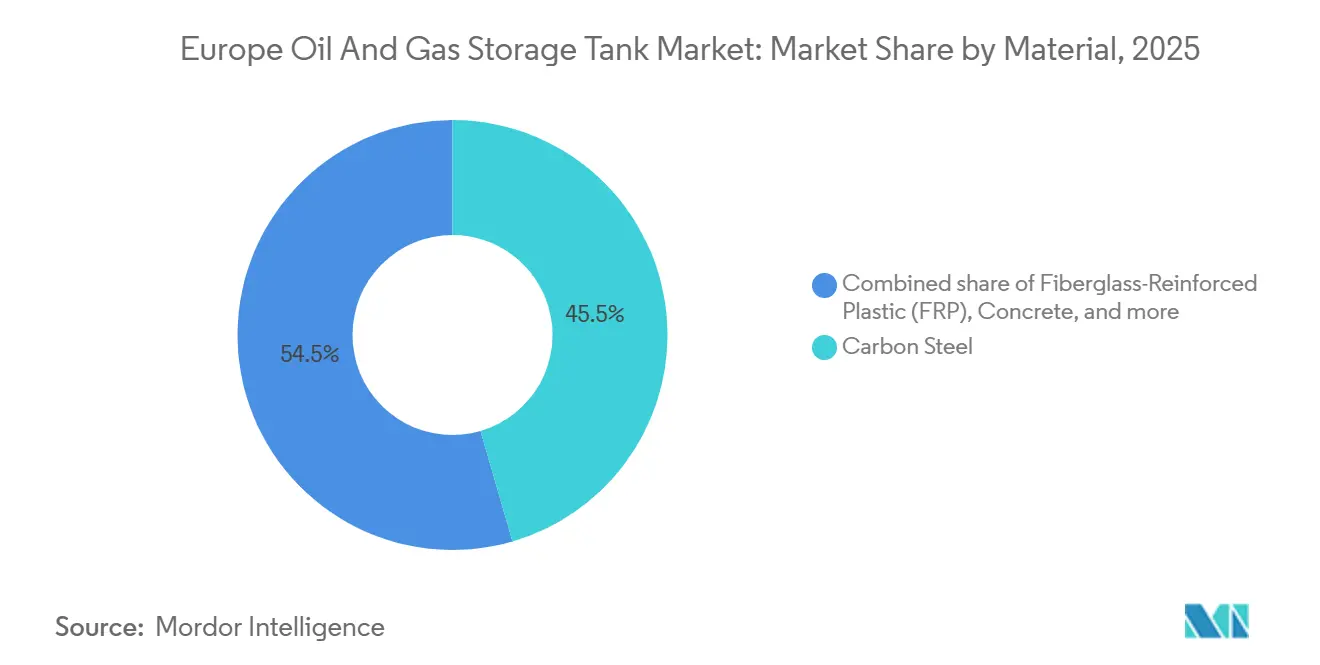
- By material, carbon steel accounted for 45.5% of Europe's oil & gas storage tank market size in 2025, whereas fiberglass-reinforced plastic (FRP) led growth at a 9.7% CAGR.
- By capacity range, the 50,000–150,000 m³ band commanded 32.7% revenue share in 2025 and is projected to rise at a 6.9% CAGR.
- By product, crude oil remained the largest category at 31.8% share in 2025; natural gas liquids, covering LPG and LNG, are poised for the highest 8.2% CAGR.
- By end user, refineries and petrochemical plants contributed 33.3% of demand in 2025 and are advancing at a 7.1% CAGR on the back of sustainable-aviation-fuel investments.
- By geography, Germany led with a 23.4% revenue share in 2025, whereas Russia is expected to record the fastest 7.6% CAGR through 2031.
Note: Market size and forecast figures in this report are generated using Mordor Intelligence’s proprietary estimation framework, updated with the latest available data and insights as of January 2026.
Market Trends and Insights
Drivers Impact Analysis of Europe Oil And Gas Storage Tank Market*
| Driver | (~) % Impact on CAGR Forecast | Geographic Relevance | Impact Timeline |
|---|---|---|---|
| Rising need for strategic petroleum reserves | +1.2% | Germany, France, Spain, Italy | Medium term (2–4 years) |
| Expansion of LNG import terminals & cryogenic tanks | +1.8% | Germany, Netherlands, Nordic Countries | Short term (≤2 years) |
| Aging storage infrastructure replacement demand | +1.0% | United Kingdom, France, Germany | Long term (≥4 years) |
| Growth in biofuels & hydrogen storage tanks | +0.9% | Nordic Countries, Germany, Netherlands | Medium term (2–4 years) |
| Repurposing decommissioned tanks for CCS storage | +0.5% | United Kingdom (North Sea), Norway, Netherlands | Long term (≥4 years) |
| Digital-twin-driven predictive maintenance retrofits | +0.7% | Global (concentrated in Germany, UK, Netherlands) | Short term (≤2 years) |
| Source: Mordor Intelligence | |||
Rising Need for Strategic Petroleum Reserves
European Union members collectively held 90 days of net import cover in December 2025, yet several governments now target 120 days by 2028.[1] Germany added 3.2 million m³ of new capacity in 2025, commissioning tanks in Wilhelmshaven and Lower Saxony that primarily fall in the 50,000–150,000 m³ sweet spot.[2] Spain awarded EUR 180 million (USD 195 million) in above-ground tank contracts near Cartagena and Tarragona, specifying corrosion-resistant coatings that extend inspection intervals to 15 years. France’s SAGESS tendered for 1.8 million m³ during 2024, reinforcing consistent demand for large-diameter carbon-steel tanks even as gasoline consumption plateaus. The resulting offtake stabilizes fabrication pipelines for regional steel shops and lifts per-unit profitability despite muted refined-product throughput.
Expansion of LNG Import Terminals & Cryogenic Tanks
Germany commissioned four floating storage and regasification units (FSRUs) between 2023 and 2025, which together required 480,000 m³ of onshore minus-162 °C storage. In May 2025, the Gate terminal in Rotterdam finished a third 180,000 m³ tank built from 9-percent-nickel steel that meets EN 14620.[3] Finland’s Inkoo facility added a 50,000 m³ bullet tank in September 2025, illustrating Nordic preference for modular, incremental capacity. Cryogenic construction costs of USD 1,200–1,800 per m³, roughly triple crude-oil equivalents, are nevertheless justified by the strategic imperative to displace Russian pipeline gas. This LNG surge underpins the 8.2% CAGR forecast for natural-gas-liquid tank demand.
Aging Storage Infrastructure Replacement Demand
Roughly 35% of Europe’s above-ground petroleum tanks predate 1985, and many exceed their 40-year design life, triggering mandatory API 653 fitness assessments. The United Kingdom’s Health and Safety Executive issued 127 improvement notices in 2024 related to floor corrosion, accelerating replacement at PetroIneos and Navigator sites. Royal Vopak launched a EUR 450 million program in 2025 to replace 22 tanks in Amsterdam, Rotterdam, and Antwerp, opting for duplex stainless steel and FRP where biofuels prevail. Modern floating-roof designs simultaneously expand capacity and cut VOC emissions, enabling compliance while limiting downtime.
Growth in Biofuels & Hydrogen Storage Tanks
The ReFuelEU Aviation regulation obliges 6% sustainable-aviation-fuel (SAF) blending by 2030, climbing to 70% by 2050. Neste installed a 25,000 m³ 316L-stainless-steel HEFA tank in March 2025 to accommodate the acidic renewable feedstock. Germany allocated EUR 1.2 billion to hydrogen refueling infrastructure in 2024, including four liquid-hydrogen depots with composite-overwrapped pressure vessels rated at 350 bar. Spanish refiners Repsol and Cepsa announced EUR 200 million each in 2025 for FRP biodiesel tanks to mitigate galvanic corrosion. FRP’s 9.7% CAGR mirrors this pivot toward corrosion-proof, lightweight vessels.
Restraints Impact Analysis of Europe Oil And Gas Storage Tank Market*
| Restraint | (~) % Impact on CAGR Forecast | Geographic Relevance | Impact Timeline |
|---|---|---|---|
| Declining petroleum demand in Europe | -1.1% | Western Europe (Germany, UK, France, Italy, Spain) | Long term (≥4 years) |
| Stringent environmental regulations & compliance costs | -0.8% | EU member states, Norway | Medium term (2–4 years) |
| Community opposition & permitting delays | -0.6% | Germany, Netherlands, Belgium (high-density corridors) | Short term (≤2 years) |
| Source: Mordor Intelligence | |||
Declining Petroleum Demand in Europe
Regional demand fell to 12.4 million b/d in 2025, shaving 2.1% year-on-year as electric-vehicle uptake hit 22% of new car registrations.[4] Germany’s gasoline and diesel consumption slipped 3.8% and 2.9%, respectively, depressing refinery utilization below 80%. Gunvor idled 400,000 m³ of middle-distillate capacity in Rotterdam early 2025, citing weak contango that no longer funds storage arbitrage. Unless crude tanks are repurposed, an estimated 1.2 million m³ will risk stranding in France by 2030.
Stringent Environmental Regulations & Compliance Cost
The 2024 update to the Industrial Emissions Directive halves allowable VOC emissions to 0.15 g/L and mandates optical-gas-imaging cameras. Upgrading a 100,000 m³ floating-roof tank costs EUR 1.2–1.8 million, and operators with multi-tank sites can face bills above EUR 20 million. Spain’s Catalonia region now mandates double-bottoms for tanks within 500 m of aquifers, adding 12–18% to capex. The Netherlands introduced a EUR 5/m³ decommissioning levy in 2024 to fund soil cleanup, further discouraging speculative builds.
*Our forecasts treat driver/restraint impacts as directional, not additive. The impact forecasts reflect baseline growth, mix effects, and variable interactions.
Europe Oil And Gas Storage Tank Market Segment Analysis
By Design:
Floating-Roof Dominance Rises with Emission RulesFloating-roof vessels accounted for 35.9% of Europe's oil & gas storage tank market revenue in 2025 and are on track for a 7.5% CAGR through 2031. The 2024 EEA directive compels internal or external floating roofs for liquids above 10 kPa Reid vapor pressure by December 2027, forcing the retrofit or replacement of roughly 1,800 fixed-roof tanks. Royal Vopak converted 14 tanks at Rotterdam in 2025, cutting VOC releases by 1,450 t/yr and avoiding ETS penalties. Fixed-roof vessels still serve low-volatility fuels, while dome-roof designs handle high snow-load sites in Finland, and bullet tanks support modular LNG satellite stations in Spain.
Dome roofs resist 5 kPa snow loads, demonstrated by Neste's 60,000 m³ Porvoo biodiesel tank engineered for –20 °C operations. Bullet tanks, typically 200 m³ each, support distributed LNG demand; Enagás deployed 18 in rural Spain during 2025. The convergence of emission compliance and inventory efficiency cements floating roofs as the default for volatile liquids through 2031.

By Tank Type:
Above-Ground Leads, Mobility AcceleratesAbove-ground tanks dominated with a 70.2% market share in 2025, reflecting lower construction costs and inspection ease. Underground newbuilds decline due to groundwater-protection rules; the Netherlands banned such tanks within 100 m of drinking-water wells in 2024. Mobile and modular tanks grow at an 8.9% CAGR as disaster-response agencies and LNG peak-shaving operators favor 50–1,000 m³ trailer-mounted units. Germany’s Federal Agency for Technical Relief bought 24 in 2025 for refinery turnarounds. Finland’s Gasgrid leased six 500 m³ LNG tanks from HOYER in early 2025, deferring capital while securing supply.
Above-ground vessels fit the 50,000–150,000 m³ capacity band favored at coastal terminals, whereas underground options require favorable geology and face costlier excavation. Mobility offers asset-light flexibility, enabling operators to redeploy capacity within 48 hours to seasonal hotspots.
By Material:
FRP Outpaces Traditional MetalsCarbon steel retained a 45.5% share in 2025 owing to its USD 800–1,200 /m³ cost and well-defined API 650 guidelines. Stainless steel held 22% for high-purity and acidic products, but FRP is the fast-growing material with a 9.7% CAGR through 2031. Decal Spain delivered 38 FRP biodiesel tanks in 2025, each warrantied for 25 years without recoating. Alkion installed eight FRP units on reclaimed land near Venice, saving EUR 1.2 million in deep-pile foundations. EU renewable-energy mandates favor corrosion-proof materials, bolstering FRP adoption.
Stainless 316L vessels dominate SAF and renewable-diesel storage, as shown by TotalEnergies’ 180,000 m³ La Mède installation in 2024. Concrete tanks remain niche at 8% share for low-value liquids due to incompatibility with leak-detection standards.
By Capacity Range:
Mid-Tier Tanks Optimize EconomicsTanks between 50,000 and 150,000 m³ represented 32.7% of the market in 2025 and will grow 6.9% annually. A 100,000 m³ tank buffers 7–10 days of crude for a 200,000 bbl/d refinery, balancing working-capital cost with operational resilience. Germany’s PCK Raffinerie added two 120,000 m³ crude vessels in 2024, reducing pumping energy by 18% after consolidating four smaller tanks. Sub-5,000 m³ tanks serve airport hydrant systems; Aéroports de Paris installed 14 for SAF segregation in 2025. Mega-tanks above 150,000 m³, although cheapest per m³, face tougher seismic and permitting hurdles, concentrated in Rotterdam and Antwerp.
By Product:
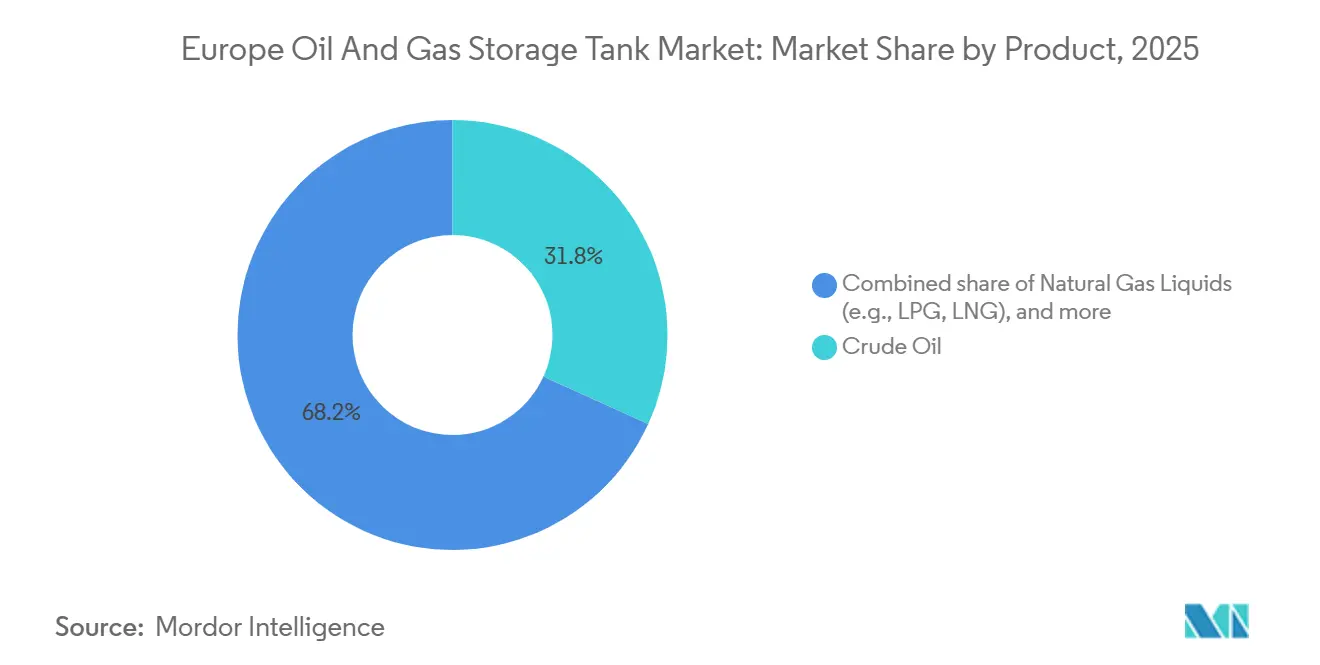
LNG Storage Expands FastestCrude oil held a 31.8% share in 2025, yet LNG and LPG collectively post an 8.2% CAGR to 2031 as import hubs proliferate. Gate terminal’s fourth truck-loading bay now serves 180 industrial customers across Northwest Europe. Spain plans to add 400,000 m³ across Barcelona and Cartagena by 2028. Conventional refined products lose ground to SAF and renewable diesel, which require dedicated stainless or FRP segregation tanks. Specialty petrochemicals such as methanol and BTX maintain an 8% niche, anchored in Rotterdam’s Botlek and Antwerp’s chemical clusters.
By End User:
Refinery Demand Persists Despite RationalizationRefineries and petrochemical complexes delivered 33.3% of 2025 demand and are forecast to grow 7.1% yearly, propelled by SAF and hydrogen co-processing lines. Traders like Vitol commissioned proprietary capacity, 250,000 m³ in Rotterdam in June 2025, to capture blending margins and reduce counterparty risk. Strategic-reserve agencies offer 15-year take-or-pay leases, exemplified by Spain’s 400,000 m³ commitment to Rubis in 2024. Logistics firms HOYER and LBC diversify into chemicals to offset petroleum volume declines, sustaining a 6.3% CAGR.
Geography Analysis
Germany and Russia Oil and Gas Storage Tank Market
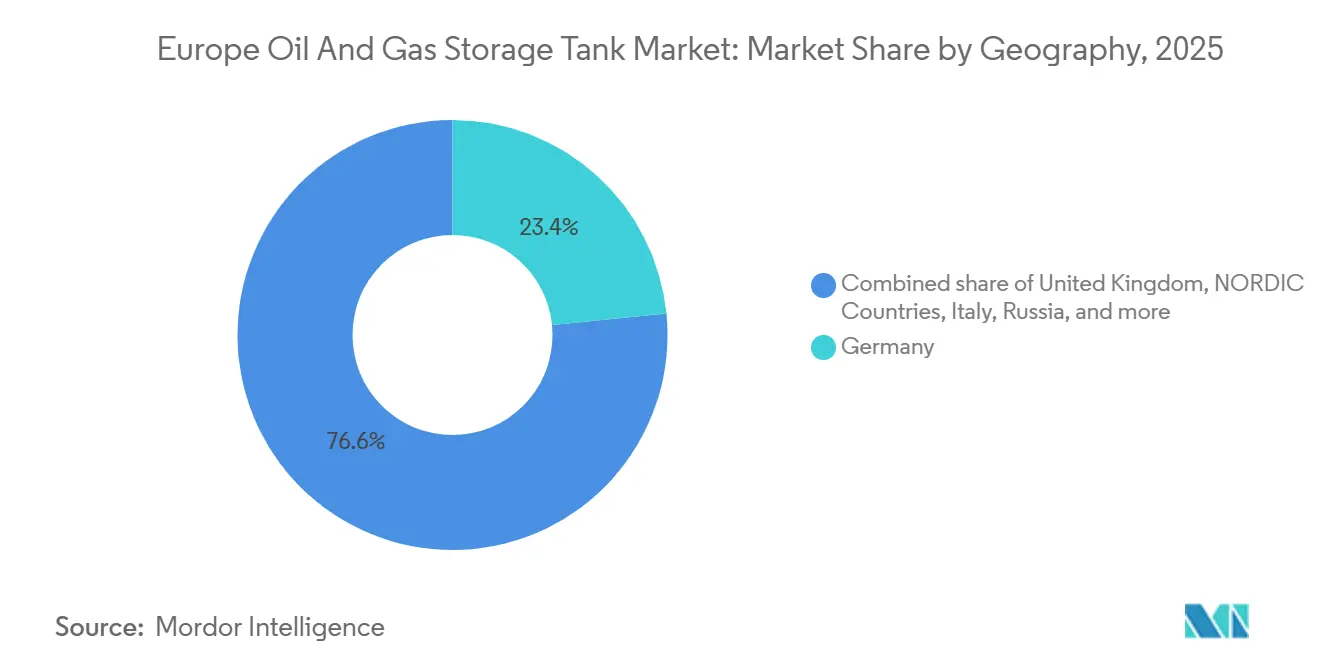
Germany led the European oil & gas storage tank market with a 23.4% share in 2025, underpinned by four FSRUs totaling 30 bcm/year and 480,000 m³ of cryogenic storage commissioned between 2023 and 2025. Strategic-reserve additions of 3.2 million m³ and SAF infrastructure investments sustain a 6.7% CAGR through 2031 despite lower refinery throughput. Russia is forecast to have the fastest 7.6% CAGR as Transneft’s 1.2 million m³ Ust-Luga expansion and Gazprom Neft’s 300,000 m³ product tanks at Omsk bolster export-oriented capacity. Regulatory cycles of 15 years reduce lifecycle compliance cost, favoring carbon-steel mega-tanks.
Broader European Markets
The United Kingdom, France, Italy, and Spain collectively accounted for 38% of 2025 revenue. UK LNG storage grew 120,000 m³ in 2024, with another 200,000 m³ planned by 2028. France’s La Mède biorefinery added 80,000 m³ SAF capacity in 2025. Italy’s Saras replaced six fixed roofs with four floating roofs, cutting VOCs 1,100 t/yr. Spain’s Repsol and Cepsa each invested EUR 200 million in biofuel terminals using FRP tanks in 2025.
Nordic markets, Norway, Sweden, Finland, Denmark, represent 9% share and grow 6.8% annually, led by LNG imports and hydrogen pilots. Norway inaugurated a 50,000 m³ CO₂ tank at Øygarden in June 2025, showcasing reuse potential for decommissioned crude infrastructure. Finland’s modular LNG bullet tanks underscore the region’s preference for incremental capacity that avoids multiyear permitting.
Regulatory Landscape
The European regulatory framework for oil and gas storage tanks is tightening around emissions, safety integrity, and energy-security obligations. The EU Industrial Emissions Directive update (2024) drives VOC monitoring and control upgrades, including optical-gas-imaging requirements and lower VOC thresholds, which are pushing floating-roof retrofits and higher spend on seals and vapor-control systems at large coastal terminals and refinery tank farms. Alongside emissions compliance, strategic and gas-security rules are also shaping tank utilization and investment sequencing. Regulation (EU) 2025/1733 extends gas storage filling provisions through end-2027 and requires Member States to submit annual filling trajectories with indicative intermediate targets.
Energy-security policy is also influencing which hydrocarbons and derivatives receive priority storage. Regulation (EU) 2026/261 introduces national diversification planning linked to the phasing out of Russian oil imports by end-2027, and it adds monitoring mechanisms for Russian gas in temporary or transit storage, increasing scrutiny on custody, tracking, and reporting for operators handling cross-border volumes. At the project-permitting layer, the Council of the European Union has been reviewing measures under the European Grids Package, including proposals to streamline permitting for energy storage projects, while the European Commission continues active coordination through its Gas and Oil Coordination Groups, including supply-risk monitoring noted in May 2026.
Competitive Landscape
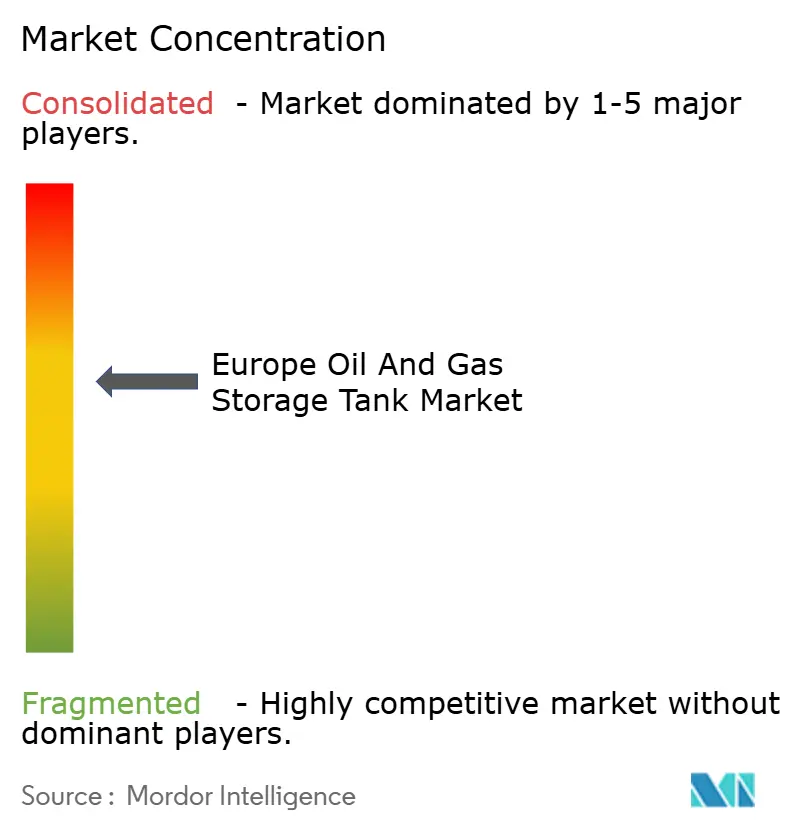
The European oil & gas storage tank market competition is moderate, with Royal Vopak, Oiltanking, VTTI, Odfjell, and Rubis holding 40% of third-party capacity. Royal Vopak’s EUR 450 million renewal program targets a 30% Scope 1 reduction by 2030, focusing on floating roofs and stainless steel. VTTI’s 250,000 m³ Europoort expansion, finished in November 2025, integrates 98% VOC-capture vapor-recovery and secured a 10-year Shell Trading SAF contract. Odfjell delayed a Rotterdam chemical-tank project 14 months due to permitting uncertainty, illustrating regulatory risk.
Hydrogen, CCS, and modular emergency tanks represent white-space niches. Germany’s hydrogen roadmap implies 300,000–400,000 m³ of new compressed or liquid tanks by 2030. BP’s and Equinor’s CCS plans open retrofit orders for supercritical CO₂ tanks. Challenger firms like Dyer Gas and Virtor Oy leverage skid-mounted LNG and hydrogen vessels to undercut incumbents on lead time, delivering 22 modular LNG tanks in Germany during 2025. Technology adoption increasingly separates leaders; ROSEN’s twin system on 340 tanks extends API 653 intervals from five to seven years.
Europe Oil And Gas Storage Tank Industry Leaders
-
Royal Vopak N.V.
-
Oiltanking GmbH
-
Vitol Tank Terminals International BV (VTTI)
-
HES International BV
-
Rubis Terminal
- *Disclaimer: Major Players sorted in no particular order
Europe Oil And Gas Storage Tank Market Companies Covered in this Report
- Royal Vopak NV
- Oiltanking GmbH
- HOYER GmbH
- Vitol Tank Terminals International BV (VTTI)
- Eisenbau Heilbronn GmbH
- Lapesa Grupo Empresarial SL
- GLS Tanks International GmbH
- ROSEN Group
- Dyer Gas GmbH
- Virtor Oy
- HES International BV
- Odfjell SE (Terminals)
- Rubis Terminal
- Navigator Terminals
- Gunvor Petroleum Rotterdam BV
- LBC Tank Terminals
- PetroIneos
- Alkion Terminals
- Decal Spain
- TotalEnergies Raffinerie Mitteldeutschland GmbH
Market Opportunities and Future Outlook
Multi-product and conversion-ready terminals represent a white-space segment as European operators work to rebalance legacy petroleum storage against faster-growing needs in LNG, sustainable fuels, and energy-transition molecules. Conversion activity is already visible, including Vopak shifting parts of its Europoort terminal toward pyrolysis oil storage, which creates demand for corrosion-aware tank materials, segregation, and upgraded loading and vapor-control systems. On the gas side, EU gas-storage policy continuity through end-2027 (Regulation (EU) 2025/1733) supports utilization discipline and operational planning at LNG-linked and gas-adjacent hubs, sustaining opportunities for cryogenic and other above-ground infrastructure in Northwest Europe.
A second opportunity track comes from integrating liquid terminals with power and flexibility assets, which changes storage-site investment profiles while keeping core competencies in permitting, safety systems, and operations. In July 2026, Royal Vopak completed its acquisition of a majority stake in Green Energy Storage (GES) and took FID on a 200 MW/800 MWh battery energy storage project in Oosterhout, Netherlands, indicating further capital allocation toward industrial and energy-transition infrastructure at established logistics nodes. Separately, Vopak and Gasunie reached a conditional final investment decision on 1 June 2026 to extend the EemsEnergyTerminal with long-term LNG supply contracts signed for 2028-2036, reinforcing that contracted security-of-supply projects continue to progress and generate adjacent demand for compliant storage, monitoring, and debottlenecking services.
Recent Industry Developments in Europe Oil And Gas Storage Tank Market
- July 2026: Completed acquisition of majority stake in Green Energy Storage (GES) and took Final Investment Decision (FID) on a 200 MW / 800 MWh battery energy storage project in Oosterhout, Netherlands. The move expands battery storage capacity and accelerates Dutch deployment of grid scale storage assets.
- June 2026: Shareholders Gasunie and Vopak took a conditional Final Investment Decision (cFID) for the extension of EemsEnergyTerminal, with LNG supply contracts secured through 2028-2036. The expansion strengthens European LNG infrastructure capacity under long term contracts and reinforces resilience to demand shifts in gas infrastructure.
- May 2026: Signed agreement in principle to acquire a majority stake in Green Energy Storage (GES) to accelerate large-scale battery storage development in the Netherlands. The arrangement increases battery storage capacity and offsets reliance on fossil fuels by accelerating deployment of grid-scale storage assets.
Europe Oil And Gas Storage Tank Market Report Scope and Research Methodology
Market Definition and Coverage
This market covers revenue generated from supplying and installing storage tanks and related tank system work used in oil and gas storage applications across Europe, including terminals and upstream or midstream storage sites, within the study period.
Scope exclusions: Storage caverns and broader non-tank infrastructure such as pipelines, pumps, and refinery processing units are excluded.
Segments Covered in This Report
- By Design
- Fixed-Roof Tanks
- Floating-Roof Tanks
- Dome-Roof Tanks
- Spherical Tanks
- Bullet Tanks and Others
- By Tank Type
- Aboveground Storage Tanks (ASTs)
- Underground Storage Tanks (USTs)
- Mobile/Modular Tanks
- By Material
- Carbon Steel
- Stainless Steel
- Fiberglass-Reinforced Plastic (FRP)
- Concrete
- Others
- By Capacity Range
- Up to 5k m³
- 5 to 50k m³
- 50 to 150k m³
- Above 150k m³
- By Product
- Crude Oil
- Refined Petroleum Products
- Natural Gas Liquids (e.g., LPG, LNG)
- Aviation Fuel and Middle Distillates
- Specialty Hydrocarbons/Petrochemicals
- By End-User
- Oil and Gas Producers
- Refineries and Petrochemical Plants
- Traders and Distributors
- Strategic Petroleum Reserve Agencies (SPRs)
- Logistics/Transportation companies
- By Geography
- Germany
- United Kingdom
- France
- Italy
- Spain
- NORDIC Countries
- Russia
- Rest of Europe
Data Sources, Market Sizing, and Validation
Desk Research
To build the base structure of the model, we first compiled country level energy and industrial signals that explain where storage demand is coming from. Public statistics and official publications were used to map petroleum product movements, refinery throughput changes, and gas supply balancing needs, then to define the addressable tank demand pool by country.
Examples of sources used include Eurostat for energy balances and trade tables, the International Energy Agency for oil and gas market indicators, and Joint Organisations Data Initiative data for petroleum statistics where available. We also referred to national energy ministry releases and port authority publications that describe terminal expansions, plus standards and safety references such as ECHA and other official guidance that influence tank design and replacement cycles. Company annual reports, investor presentations, and reputable press were then used to confirm project timelines and typical order patterns. Where public data had gaps, we supplemented with selected paid subscriptions for company financials, patent lookups, and shipment level trade checks. This list is illustrative, and many other public, official, and paid sources were also reviewed for collection, validation, and clarification.
Primary Interviews and Surveys
Primary work was used to convert desk signals into realistic pricing and volume assumptions, since tank orders are often project based and timing varies by country. We spoke with stakeholders such as terminal operators, EPC and maintenance firms, tank fabricators, and inspection specialists across major European hubs, then used their inputs to confirm capacity additions, replacement drivers, and how specifications shift by stored product.
These discussions helped us triangulate average selling price bands, typical tank sizes ordered, and the share of demand tied to regulatory inspections and corrosion remediation, which is difficult to observe cleanly from public sources alone.
Distribution of primary research fieldwork respondents
| Company type | Respondent position |
|---|---|
| Top tier: 36% | CXOs: 17% |
| Mid tier: 47% | Functional/Unit leaders: 33% |
| Smaller Players: 17% | Managers: 50% |
Market-Sizing & Forecasting
Sizing starts from a top down build where country level oil product and crude storage requirements are reconstructed using energy balance indicators, refinery utilization direction, import export dependence, and known terminal capacity changes. Those demand signals are then translated into tank capacity additions and maintenance driven replacements, and finally into revenue using validated price per capacity and project mix assumptions.
To keep the totals grounded, results are checked with selective bottom up approximations, such as sampled project trackers and channel checks on awarded tank packages, plus volume times ASP calculations by common tank size bands. Key inputs used in the model include terminal expansion announcements, observed refinery throughput shifts, inventory policy signals related to security of supply, typical API and EN driven inspection cycles, and steel and coating cost movements that affect installed pricing. Where project data is incomplete, gaps are handled by using conservative infill rates based on similar ports or industrial clusters, then tested again through expert feedback.
For forecasting, scenario analysis is used because the market is influenced by policy moves, refinery closures or upgrades, and the timing of terminal investments that can pull demand forward or delay it. The scenario paths are anchored to expert consensus on the project pipeline and replacement timing, and then smoothed at the country level to avoid overreacting to one off megaproject years.
Data Validation & Update Cycle
Validation is done through multiple checks so the final number stays consistent with real world operating signals. We compare model outputs against independent metrics such as announced storage capacity additions, regional energy trade direction, and observed order activity discussed by industry participants. We also review outliers at the country and application level before sign off.
If a major variance is found, the assumptions are revisited. When needed, experts are re contacted to confirm whether the change is timing related, scope related, or price related. Reports are refreshed annually, with interim updates when material events occur such as major terminal approvals, cancellations, or regulation changes that can shift replacement demand. Before delivery, an analyst performs a fresh pass so clients receive the latest updated view.
Mordor Intelligence's Europe Oil and Gas Storage Tank Market Size Versus Other Published Estimates
Published market sizes for Europe oil and gas storage tanks can look far apart because the underlying scope is not always the same, and project timing assumptions can be treated differently. Differences also come from how installed pricing is built up, what is counted as a tank related service, and how fast the estimates are refreshed when large terminal projects move.
Underground gas storage caverns sit outside Mordor Intelligence's scope, and that single exclusion can materially lower reported values versus estimates that bundle caverns with aboveground tank systems. Another common gap is that some publishers apply a single regional price per cubic meter, even though corrosion remediation, floating roof upgrades, and compliance driven retrofits can shift realized pricing across countries and tank types. Currency timing, and whether 2025 is treated as a full base year or partly forecast, can also create a visible spread in the published numbers.
Benchmark comparison
| Source | Market Size | Gaps in Research Methodology |
|---|---|---|
| Mordor Intelligence | USD 4.11 B (2025) | |
| Trade Journal A | USD 2.32 B (2025) | Uses a narrower interpretation focused on tank manufacturing value, and it often excludes installation, foundation work, and integrity upgrade packages that drive a large share of project spend in Europe. |
| Industry Database B | USD 5.10 B (2026) | Likely bundles adjacent storage infrastructure and counts more aggressive capacity expansion assumptions for 2026, which inflates the total when project timing is not normalized across countries. |
Looking at the table, most of the spread can be explained by what is included around the tank itself and how the project calendar is treated in the base year versus the first forecast year. By keeping inclusions tied to tank system revenue and validating the demand pool with capacity additions plus replacement signals, the resulting estimate stays traceable to inputs that can be repeated and rechecked.
Key Questions Answered in the Report
What is the current and projected value for Europe oil & gas storage tank market?
The market size stood at USD 4.39 billion in 2026 and is forecast to reach USD 6.01 billion by 2031, reflecting a 6.48% CAGR.
Which tank design captures the largest revenue share across Europe?
Floating-roof vessels hold 35.9% of 2025 revenue and are advancing at a 7.5% CAGR because VOC rules favor this low-emission architecture.
How fast is demand for LNG and other natural-gas-liquid storage expanding?
LNG and LPG tank capacity posts the region’s quickest 8.2% CAGR through 2031, driven by new FSRUs and cryogenic terminals in Germany, the Netherlands, and Finland.
What role do digital twins play in maintaining European tank farms?
Platforms from ROSEN and Siemens Energy cut unplanned downtime by up to 22% and trim annual inspection costs 15% by shifting to condition-based maintenance.
How do new EU environmental standards affect capital costs?
Upgrading a 100,000 m³ floating-roof tank to meet 2024 VOC limits requires EUR 1.2–1.8 million in seal, vapor-recovery, and monitoring systems.