Perishable Goods Transportation Market Size and Share
Market Overview
| Study Period | 2019 - 2030 |
|---|---|
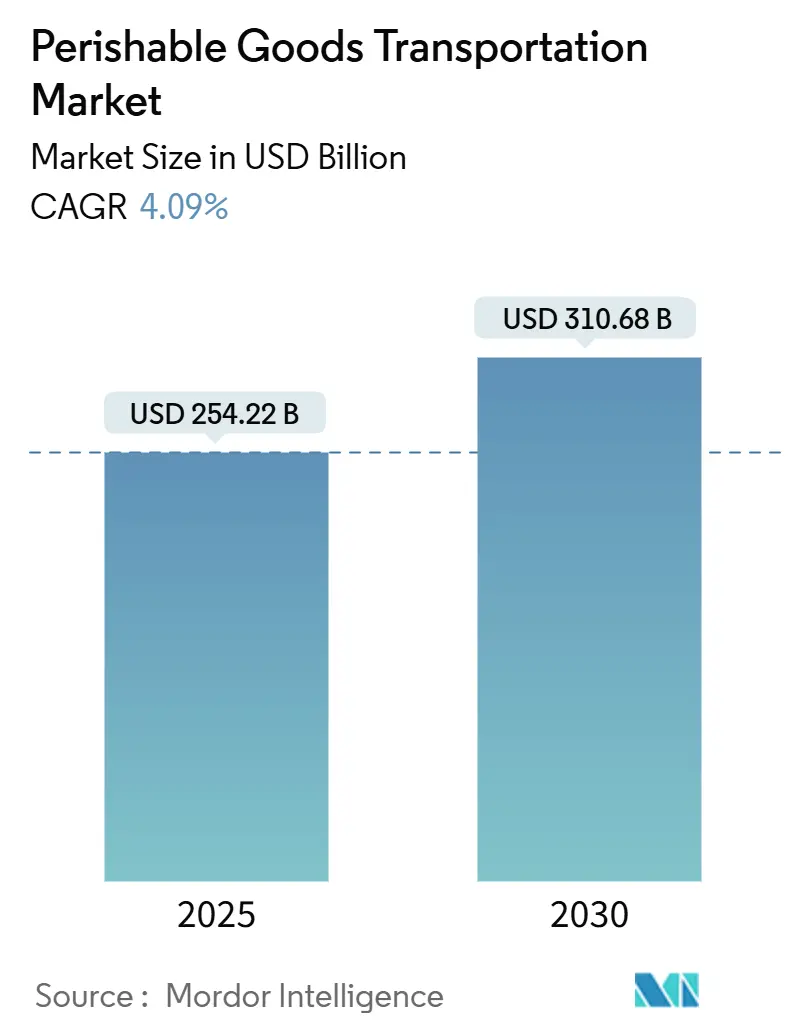
| Market Size (2025) | USD 254.22 Billion |
| Market Size (2030) | USD 310.68 Billion |
| Growth Rate (2025 - 2030) | 4.09% CAGR |
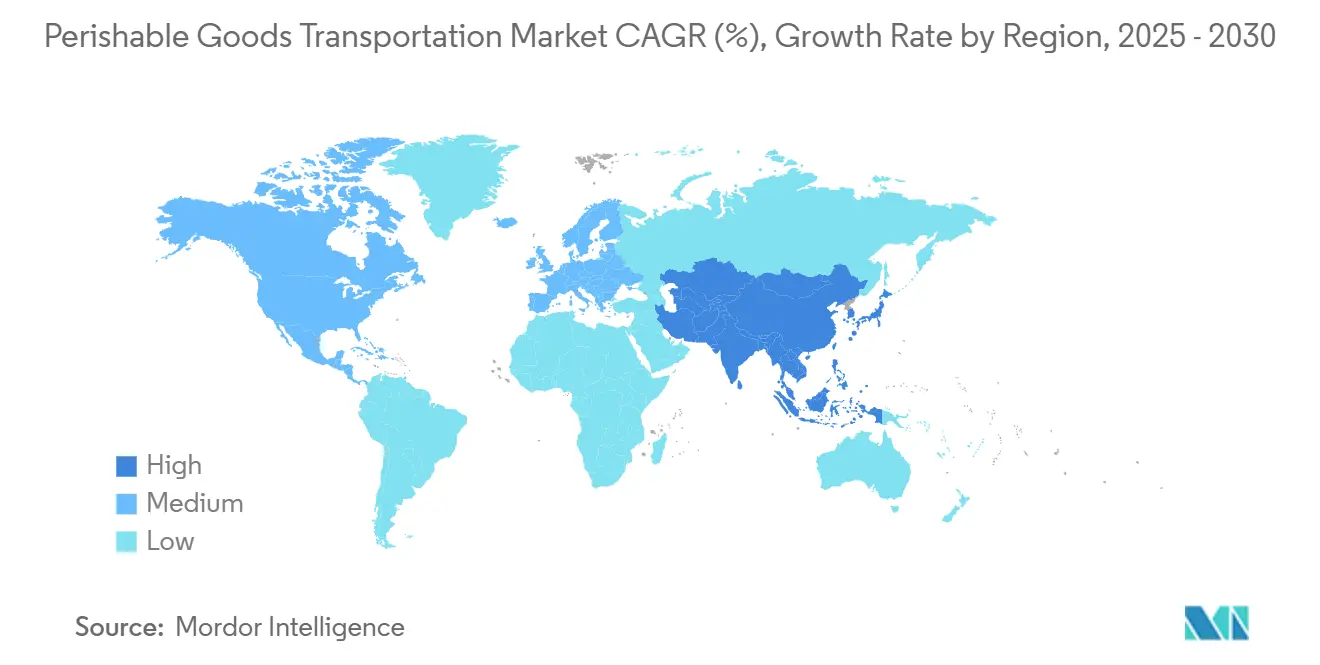
| Fastest Growing Market | Asia Pacific |
| Largest Market | Asia Pacific |
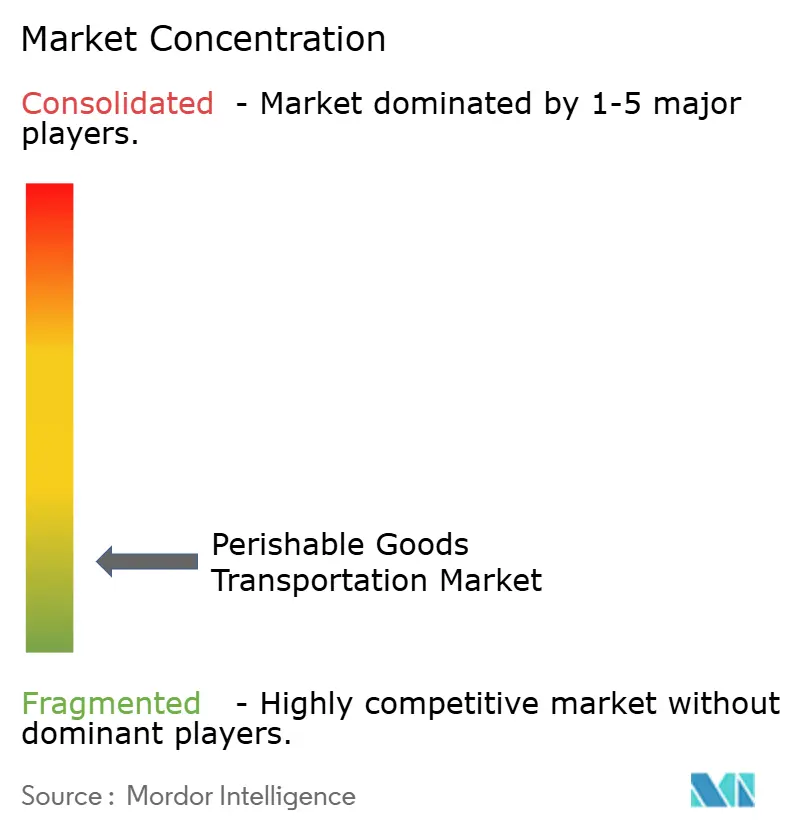
| Market Concentration | Low |
Major Players *Disclaimer: Major Players sorted in no particular order Image © Mordor Intelligence. Reuse requires attribution under CC BY 4.0. | |
Perishable Goods Transportation Market Analysis by Mordor Intelligence
The Perishable Goods Transportation Market size is estimated at USD 254.22 billion in 2025, and is expected to reach USD 310.68 billion by 2030, at a CAGR of 4.09% during the forecast period (2025-2030).
Demand is rising on the back of post-pandemic infrastructure upgrades, tighter food-safety rules and the accelerating digitization of cold-chain networks. E-commerce grocery volumes, temperature-sensitive pharmaceutical flows and stricter traceability mandates are together creating a structural need for reliable chilled and frozen distribution[1]U.S. Federal Register, “Requirements for Additional Traceability Records for Certain Foods,” FEDERALREGISTER.GOV. Modal diversification, particularly the growth of premium air corridors for biologics, is altering cost–speed trade-offs, while large logistics providers are consolidating to unlock scale efficiencies. At the same time, technology—AI route optimization, IoT sensors and cloud-based visibility platforms—has shifted from differentiator to baseline capability.
Key Report Takeaways
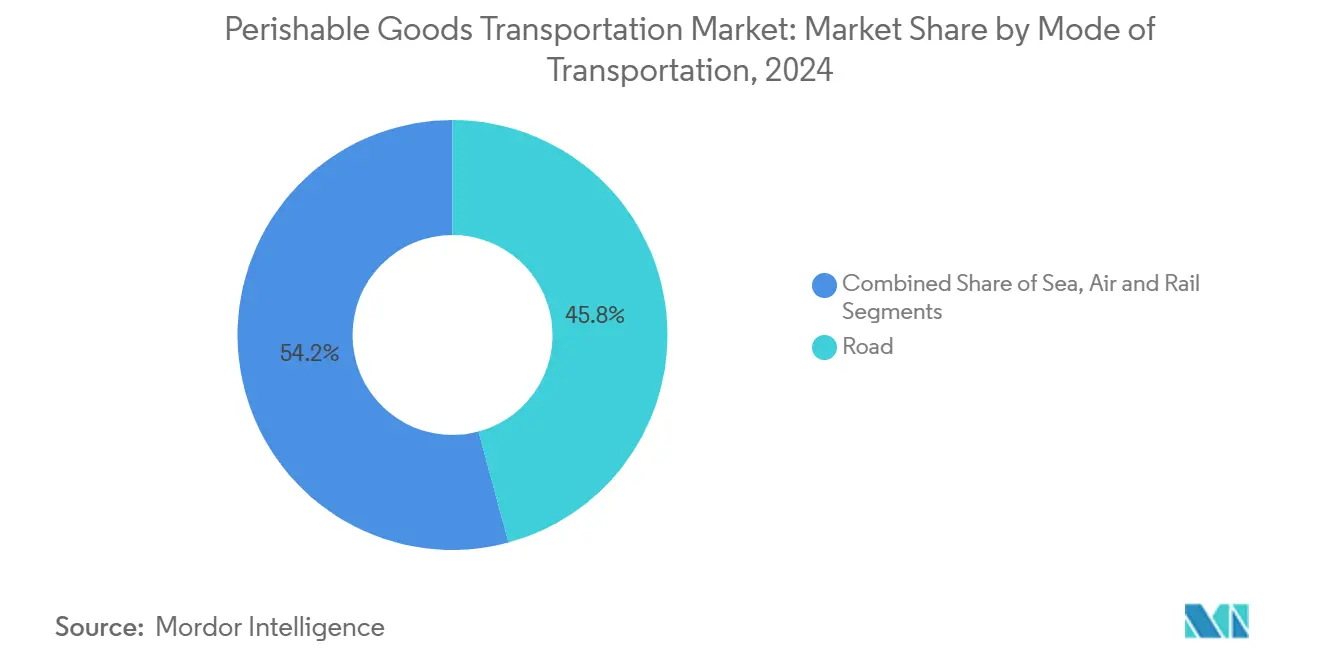
- By mode of transport, road networks led with a 45.80% share of the perishable goods transportation market in 2024, whereas air freight is projected to advance at a 7.80% CAGR through 2030.
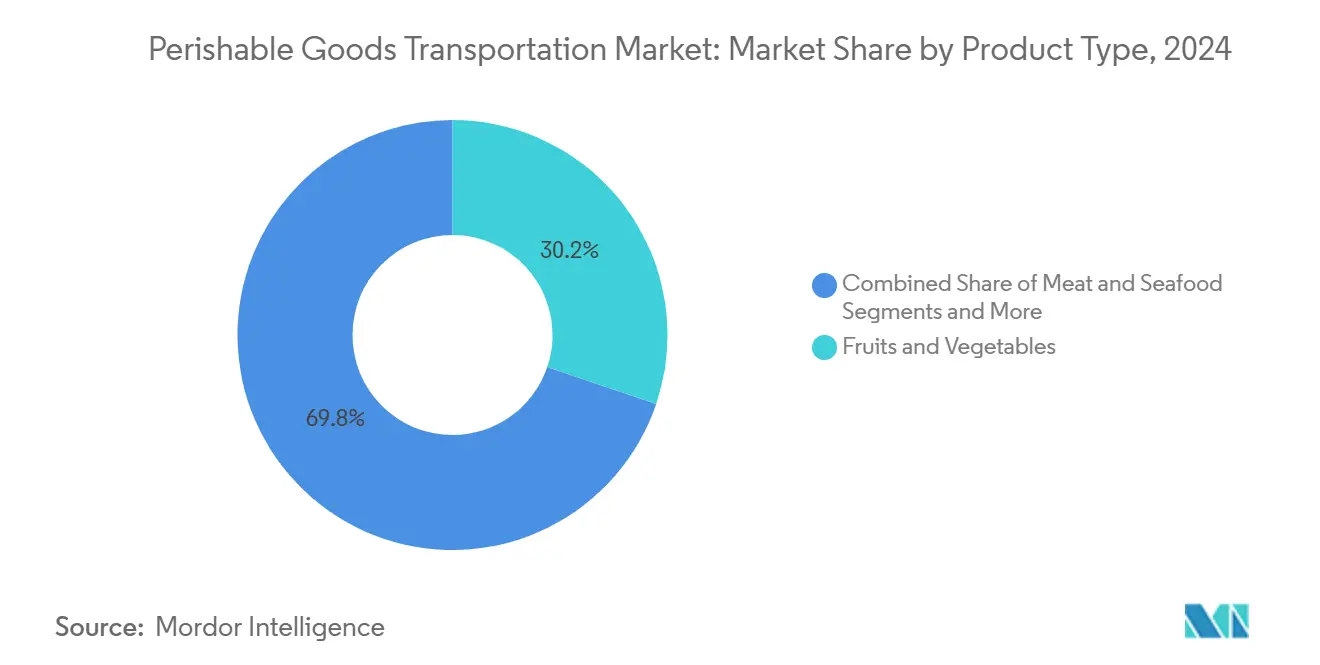
- By product type, fruits and vegetables accounted for 30.20% of the perishable goods transportation market share in 2024; pharmaceuticals and biologics are forecast to expand at a 12.10% CAGR to 2030.
- By temperature range, chilled cargo held 57.11% of the perishable goods transportation market size in 2024, while frozen goods are set to increase at an 8.30% CAGR to 2030.
- By geography, Asia-Pacific dominated with 32.00% revenue share in 2024 and is poised for a 10.80% CAGR through 2030.
Global Perishable Goods Transportation Market Trends and Insights
Drivers Impact Analysis*
| Driver | (∼) % Impact on CAGR Forecast | Geographic Relevance | Impact Timeline |
|---|---|---|---|
| E-commerce grocery boom | +0.8% | Asia-Pacific core, spill-over to Latin America | Medium term (2-4 years) |
| Post-COVID vaccine cold-chain upgrades | +0.6% | Global, concentrated in North America & EU | Short term (≤ 2 years) |
| Stricter food-safety regulations | +0.5% | North America & EU, expanding to Asia-Pacific | Long term (≥ 4 years) |
| Direct-to-consumer meal-kit expansion | +0.4% | North America & EU, emerging in urban Asia-Pacific | Medium term (2-4 years) |
| AI-driven dynamic route optimization | +0.3% | Global, early adoption in developed markets | Medium term (2-4 years) |
| Arctic shipping lanes opening | +0.2% | Northern hemisphere, Russia-China-Europe corridor | Long term (≥ 4 years) |
| Source: Mordor Intelligence | |||
E-commerce Grocery Boom in Emerging Economies
Mobile first purchasing and wider digital-payment adoption are spurring unprecedented online grocery volumes in emerging Asia. Large marketplaces now bundle same-day fresh deliveries that hinge on city-proximate cold storage hubs and dense road-based reefer fleets. Chinese operators are rolling out fully automated frozen warehouses able to function at -30 °C, leapfrogging legacy manual facilities. Gulf Cooperation Council governments are also fast-tracking multi-temperature depots to bolster food security agendas, and regional spend on cold-chain assets is projected to top USD 41 billion by 2030. Start-ups focusing on electric last-mile vans are further raising service expectations, pushing incumbents to adopt greener vehicles and precise, hour-level delivery slots. This surge in perishables-heavy e-commerce underpins long-run volume visibility for the perishable goods transportation market
Post-COVID Vaccine Cold-Chain Upgrades
The global race to distribute mRNA vaccines catalyzed heavy investment in GDP-certified storage, sensor-laden trailers and redundant monitoring software. Those assets are now repurposed for higher-margin biologics, insulin analogues and high-value seafood, driving cross-segment synergies. DHL Group alone earmarked EUR 2 billion for healthcare logistics expansion by 2030, including new pharma hubs in Singapore, Leipzig and Indianapolis. Cooling capacity initially sized for billions of vaccine doses now supports broader temperature-controlled flows, ensuring better lane density and lower empty-return ratios. Standard operating procedures drafted for vaccine handling are increasingly adopted by food consignors, harmonizing documentation and reducing compliance complexity.
Stricter Food-Safety Regulations
The FDA’s FSMA 204 rule will require 24-hour traceability for foods on the Food Traceability List from January 2026 onward, compelling carriers and shippers to invest in interoperable data platforms. In parallel, EU Regulation 2021/382 tightens hygiene protocols for animal-origin products, reinforcing the call for end-to-end temperature logs[2]European Commission, “Commission Regulation (EU) 2021/382,” EUR-LEX.EUROPA.EU. Global consumer-goods brands now prefer 1-platform documentation across regions, prompting LSPs to integrate blockchain ledgers with WMS and TMS modules. While compliance costs are material, operators report reduced spoilage claims and faster recall execution—benefits that indirectly widen the perishable goods transportation market.
Rapid Rise of Direct-to-Consumer Meal-Kit Services
Meal-kit suppliers have moved from weekly subscriptions to on-demand, recipe-curated boxes delivered within 24 hours. HelloFresh’s partnership with Rivian underscores the push toward zero-emission vans that still guarantee chilled integrity to the doorstep. Logistics providers are trialing reusable gel-pack solutions certified for 9-day thermal protection, lowering single-use packaging waste and total landed cost. Warehouse automation picks individual SKUs into modular totes, enabling high mix and short lead-times without sacrificing temperature control. These innovations solidify the growth outlook for the perishable goods transportation market by capturing incremental volumes from home-cooking consumers.
Restraints Impact Analysis*
| Restraint | (∼) % Impact on CAGR Forecast | Geographic Relevance | Impact Timeline |
|---|---|---|---|
| Shortage of qualified reefer truck drivers | −0.7% | North America & EU, emerging in Asia-Pacific | Short term (≤ 2 years) |
| High CAPEX/OPEX for multi-temperature fleets | −0.5% | Global, most acute in developed markets | Medium term (2-4 years) |
| Port bottlenecks & reefer plug-point scarcity | −0.4% | Global port hubs, concentrated on Asia-Europe routes | Short term (≤ 2 years) |
| Increasing insurance premiums for temperature excursions | −0.3% | Global, with regional variations in coverage | Medium term (2-4 years) |
| Source: Mordor Intelligence | |||
Shortage of Qualified Reefer Truck Drivers
North American carriers face an 80,000-driver supply gap that disproportionately affects temperature-controlled lanes requiring extra certification. Younger recruits show limited interest in long-haul positions that involve manual unloading at cold docks and strict hygiene audits. Regulatory misalignment—such as differing cannabis laws between states and federal drug-testing rules—shrinks the eligible labor pool. Carriers are responding with pay premiums, sign-on bonuses and in-cab safety technology, yet churn rates remain elevated. Autonomous convoy pilots could ease the crunch but commercial deployment is unlikely before the end of the decade, keeping near-term pressure on capacity and operating costs within the perishable goods transportation market
High CAPEX/OPEX for Multi-Temperature Fleets
Reefer trailers cost well above standard dry vans and require specialty components such as zone-dividing bulkheads, high-density insulation and back-up gensets. Energy expenses are rising amid tighter refrigerant regulations and mandatory switchovers to lower-GWP coolants. Small-to-mid sized fleet operators struggle to finance replacements on five-year cycles, hampering their ability to bid on complex multi-stop retail contracts. OEMs are introducing electric-standby units that allow plug-in at loading docks to curb diesel usage, but adoption hinges on shore-power availability. The capital burden could accelerate consolidation as large asset-based 3PLs spread equipment amortization over higher freight volumes, reinforcing scale advantages in the perishable goods transportation market
*Our forecasts treat driver/restraint impacts as directional, not additive. The impact forecasts reflect baseline growth, mix effects, and variable interactions.
Segment Analysis
By Mode of Transportation: Road Density Sustains Volume While Air Captures Value
In 2024, road services captured 45.80% of the perishable goods transportation market share thanks to their unmatched door-to-door reach and extensive refrigerated-truck fleets. The segment benefits from dense interstate networks that handle fresh produce, dairy and meal kits with flexible routing. However, driver shortages and stricter carbon regulations press profitability, pushing large carriers to deploy route-optimization AI and solar-assisted refrigeration units.
Air cargo, while accounting for a far smaller volume base, is projected to grow at 7.80% CAGR through 2030 as biologics, cell therapies and high-value seafood require sub-48-hour transit windows. Airlines are expanding dedicated cool-cells and tarmac rapid-transfer protocols to minimize temperature excursions, reinforcing their premium positioning in the perishable goods transportation market size context.
Sea freight remains integral for bananas, meat and frozen bakery, leveraging reefer containers that now embed IoT probes streaming lane-level data to shippers. Rail intermodal solutions, such as CPKC’s Mexico–Midwest Express, are gaining traction by offering lower-carbon alternatives with near-truck transit times. The modal hierarchy is thus shifting toward multimodal agility where products move seamlessly from port to rail to road within unified visibility platforms, amplifying resilience across the perishable goods transportation market.


By Product Type: Fresh Produce Still Leads as Pharma Surges
Fruits and vegetables accounted for 30.20% of 2024 revenue, underpinned by year-round demand in urban centers and the globalization of sourcing. Shelf-life limitations and consumer preference for freshness keep value density moderate, but huge tonnage cements their influence on capacity planning. In contrast, pharmaceuticals and biologics are forecast to post a 12.10% CAGR, making them the fastest-expanding customer vertical.
Advanced therapies frequently demand 2–8 °C or deep-frozen dry-ice environments, commanding freight premiums of 2–4 × dry cargo rates. That revenue upside has prompted general 3PLs to acquire GDP-certified sites and hire Qualified Persons to maintain compliance. Protein segments—meat and seafood—show steady mid-single-digit growth, supported by rising middle-class diets in Asia-Pacific and upgraded blast-freezer capacity near fishing ports. Bakery, confectionery and dairy categories exploit extended chilled shelf-life to penetrate distant markets, aided by value-added packaging that reduces moisture migration. Overall, higher-margin healthcare volumes are reshaping pricing benchmarks and attracting fresh capital into the perishable goods transportation market size for specialized cargo.
By Temperature Range: Chilled Cargo Dominates, Frozen Gains Momentum
Chilled shipments between 2 °C and 8 °C represented 57.11% of total 2024 spend, reflecting their centrality to vaccines, ready-to-eat meals and fresh protein. Widespread regulatory oversight, including continuous temperature logging, drives investment in dual-fuel gensets and redundant probes to protect cargo integrity.
Frozen goods, moving at −18 °C or below, are projected to rise at an 8.30% CAGR through 2030 as consumers pivot to convenience foods amid busy lifestyles. Chainwide quick-service restaurant rollouts in emerging Asia create incremental frozen-food corridors, boosting containerized reefer demand on intra-Asia lanes. Ambient-stable but monitored items—such as premium chocolate susceptible to bloom—sit in a niche zone, utilizing insulated totes rather than active cooling. Operators increasingly retrofit trailers with multi-temperature partitions, enabling mixed loads that maximize fill ratios while complying with strict segregation rules. This capability is set to unlock additional margin expansion across the perishable goods transportation market.
Geography Analysis
Asia-Pacific commanded 32.00% of global revenue in 2024 and is anticipated to log a 10.80% CAGR to 2030, reflecting the convergence of large-scale manufacturing, surging urban incomes and e-commerce penetration. China’s roll-out of robotic cold warehouses and India’s status as a key generic-drug exporter continue to expand domestic cold-chain footprints while feeding international volumes. Collaborative cross-border trucking corridors and ASEAN trade facilitation shorten lead times, enhancing competitive advantage for the perishable goods transportation market in the region. Investments in high-efficiency ammonia-CO₂ cascade systems also lower energy intensity, aligning with regional decarbonization goals.
North America maintains a mature yet dynamic profile. Expansion of last-mile grocery delivery and biotechnology manufacturing sustains demand, but capacity constraints surface in congested border crossings and aging port infrastructure. Americold’s Kansas City import-export hub will integrate with CPKC rail lines, illustrating how modal diversification mitigates port bottlenecks[3]Americold, “Plans for First Cold Storage Facility on CPKC Rail Network in Missouri,” IR.AMERICOLD.COM. Federal infrastructure grants targeting shore-power installations are expected to improve energy economics for refrigerated drayage, supporting longer-term sustainability objectives within the perishable goods transportation market.
Europe’s stringent regulatory environment fosters technology adoption despite modest volume growth. Post-Brexit documentation adds layers of compliance, but unified EU food-safety standards offer clarity for cross-border haulers. Port congestion in Rotterdam and Antwerp—where dwell times recently reached 7–10 days—has encouraged the use of inland barge and rail links for buffer storage. The bloc’s ambition to cut transport emissions 55% by 2030 is spurring trials of hydrogen-powered refrigerated trucks, a development poised to influence equipment renewal cycles across the perishable goods transportation market.

Competitive Landscape
Perishable goods transportation remains moderately fragmented. DSV’s EUR 14.3 billion purchase of Schenker in 2024 created a top-tier logistics operator with 4.3 million TEU capacity and 17.5 million m² warehousing, signaling an industry pivot toward mega-scale entities[4]DSV A/S, “DSV Signs Agreement to Acquire Schenker,” DSV.COM Source: Lineage Logistics, “Direct-to-Consumer Solutions,” ONELINEAGE.COM . Kuehne + Nagel and DHL Global Forwarding, meanwhile, prioritize asset-light digital platforms that integrate myriad subcontractors yet ensure uniform GDP and HACCP compliance. Start-ups focusing on AI visibility layers now license their software to incumbents, blurring lines between tech vendor and 4PL.
Capital intensity acts as a barrier to entry; nonetheless, niche specialists thrive. Lineage Logistics’ USD 18 billion IPO funds automated high-bay freezers reaching −35 °C, catering to protein exporters and mRNA vaccine makers alike. UPS’s acquisitions of Frigo-Trans and BPL illustrate how parcel integrators seek healthcare refrigeration expertise to complement their global networks. Market differentiation is shifting from owning trucks to managing data—real-time condition monitoring, blockchain traceability and AI-driven lane matching—driving continuous investment across the perishable goods transportation market.
Strategic alliances are equally prominent. CPKC partners with Americold to build rail-side cold hubs, enabling shippers to bypass congested ports and cut emissions by up to 30% per tonne-kilometer. Meal-kit brands collaborate directly with carriers on sustainable last-mile solutions, such as Rivian electric vans, influencing fleet-mix decisions upstream. As regulations and customers demand end-to-end temperature transparency, competitive intensity increasingly revolves around technology stacks rather than physical capacity alone.
Perishable Goods Transportation Industry Leaders
Kuehne + Nagel
DHL Global Forwarding
DSV A/S
C.H. Robinson
FedEx Logistics
- *Disclaimer: Major Players sorted in no particular order

Recent Industry Developments
- June 2025: NewCold announced expansion of its Southern Alberta automated facility, adding high-bay frozen capacity with next-generation ammonia-CO₂ refrigeration.
- April 2025: DHL Group committed EUR 2 billion to healthcare cold-chain infrastructure by 2030, including new GDP-certified hubs in three continents.
- March 2025: Lineage Logistics bought ColdPoint Logistics for USD 223 million, boosting Mid-West protein corridor capacity by 62,000 pallet positions.
- December 2024: CPKC and Americold unveiled a USD 500 million–USD 1 billion program for rail-side cold storage across North America over the next decade.


Global Perishable Goods Transportation Market Report Scope
| Road |
| Sea |
| Air |
| Rail |
| Fruits & Vegetables |
| Meat & Seafood |
| Dairy Products |
| Bakery & Confectionery |
| Pharmaceuticals & Biologics |
| Others |
| Cold chain | Ambient (15-25 degree C) |
| Chilled (2-8 degree C) | |
| Frozen (Less than 0 degree C) | |
| Non- Cold Chain |
| North America | United States |
| Canada | |
| Mexico | |
| South America | Brazil |
| Peru | |
| Chile | |
| Argentina | |
| Rest of South America | |
| Asia-Pacific | India |
| China | |
| Japan | |
| Australia | |
| South Korea | |
| South East Asia (Singapore, Malaysia, Thailand, Indonesia, Vietnam, and Philippines) | |
| Rest of Asia-Pacific | |
| Europe | United Kingdom |
| Germany | |
| France | |
| Spain | |
| Italy | |
| BENELUX (Belgium, Netherlands, and Luxembourg) | |
| NORDICS (Denmark, Finland, Iceland, Norway, and Sweden) | |
| Rest of Europe | |
| Middle East and Africa | United Arab of Emirates |
| Saudi Arabia | |
| South Africa | |
| Nigeria | |
| Rest of Middle East And Africa |
| By Mode of Transportation (Value) | Road | |
| Sea | ||
| Air | ||
| Rail | ||
| By Product Type (Value) | Fruits & Vegetables | |
| Meat & Seafood | ||
| Dairy Products | ||
| Bakery & Confectionery | ||
| Pharmaceuticals & Biologics | ||
| Others | ||
| By Temperature Range (Value) | Cold chain | Ambient (15-25 degree C) |
| Chilled (2-8 degree C) | ||
| Frozen (Less than 0 degree C) | ||
| Non- Cold Chain | ||
| By Geography (Value) | North America | United States |
| Canada | ||
| Mexico | ||
| South America | Brazil | |
| Peru | ||
| Chile | ||
| Argentina | ||
| Rest of South America | ||
| Asia-Pacific | India | |
| China | ||
| Japan | ||
| Australia | ||
| South Korea | ||
| South East Asia (Singapore, Malaysia, Thailand, Indonesia, Vietnam, and Philippines) | ||
| Rest of Asia-Pacific | ||
| Europe | United Kingdom | |
| Germany | ||
| France | ||
| Spain | ||
| Italy | ||
| BENELUX (Belgium, Netherlands, and Luxembourg) | ||
| NORDICS (Denmark, Finland, Iceland, Norway, and Sweden) | ||
| Rest of Europe | ||
| Middle East and Africa | United Arab of Emirates | |
| Saudi Arabia | ||
| South Africa | ||
| Nigeria | ||
| Rest of Middle East And Africa | ||


Key Questions Answered in the Report
What is the current value of the perishable goods transportation market?
The perishable goods transportation market size is USD 254.22 billion in 2025 and is projected to reach USD 310.68 billion by 2030.
Which region leads the perishable goods transportation market in 2025?
Asia-Pacific holds the largest regional share at 32.00% and is also growing the fastest at a 10.80% CAGR through 2030.
Why is air freight growing faster than other modes?
High-value pharmaceuticals and time-critical perishables justify premium rates, driving a 7.80% CAGR for air freight through 2030.
What product segment is expanding the quickest?
Pharmaceuticals and biologics are forecast to grow at a 12.10% CAGR owing to rising personalized medicine and biologics output.
Page last updated on:


