
Market Overview
| Study Period | 2020 - 2031 |
|---|---|
| Forecast Data Period | 2026 - 2031 |
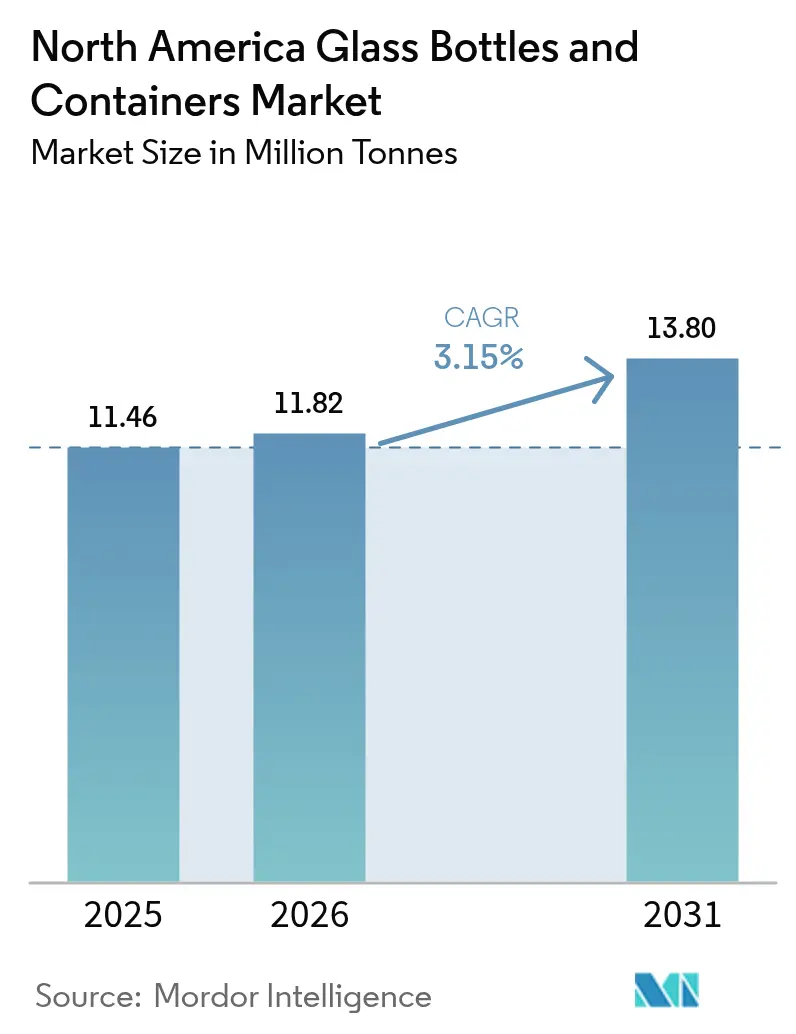
| Base Year Market Size (2025) | 11.46 Million tonnes |
| Market Volume (2026) | 11.82 Million tonnes |
| Market Volume (2031) | 13.8 Million tonnes |
| Growth Rate (2026 - 2031) | 3.15 % |
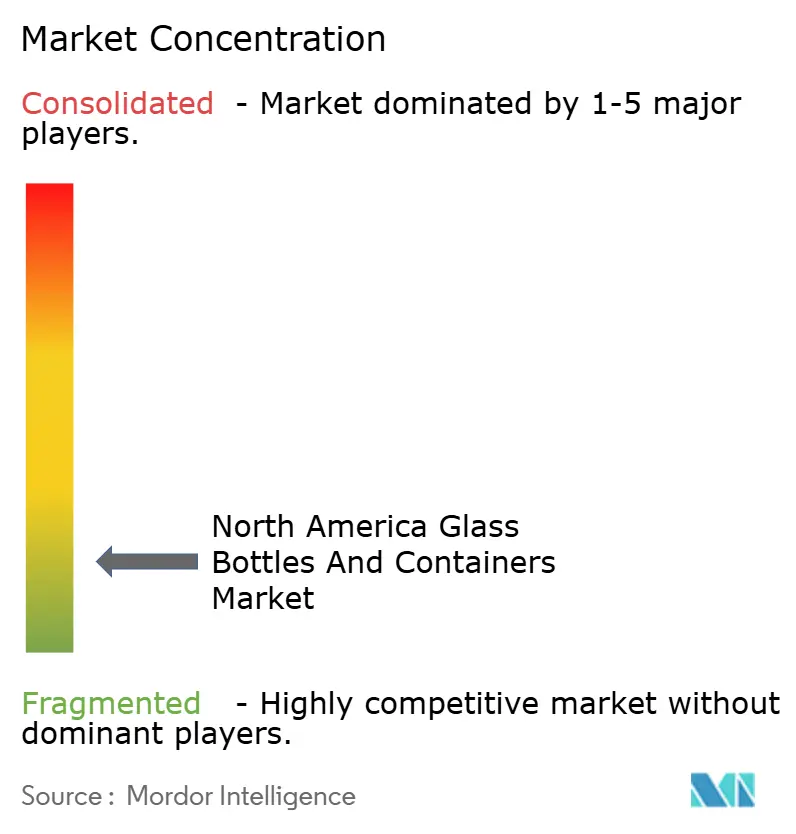
| Market Concentration | Low |
Major Players *Disclaimer: Major Players sorted in no particular order Image © Mordor Intelligence. Reuse requires attribution under CC BY 4.0. | |
North America Glass Bottles And Containers Market Analysis by Mordor Intelligence
North America Glass Bottles and Containers Market size in 2026 is estimated at 11.82 million tonnes, growing from 2025 value of 11.46 million tonnes with 2031 projections showing 13.8 million tonnes, growing at 3.15% CAGR over 2026-2031. Demand resilience mirrors the material’s infinite recyclability, chemical inertness, and premium shelf appeal that align with tightening circular-economy mandates and health-centric consumer choices. Craft beverage expansion, luxury beauty uptake, and e-commerce’s need for damage-resistant packaging collectively underpin steady volume gains. Consolidation among large producers, furnace energy-reduction investments, and color-shift preferences toward amber glass further define near-term competitive dynamics within the North America glass bottles and containers market.
Key Report Takeaways
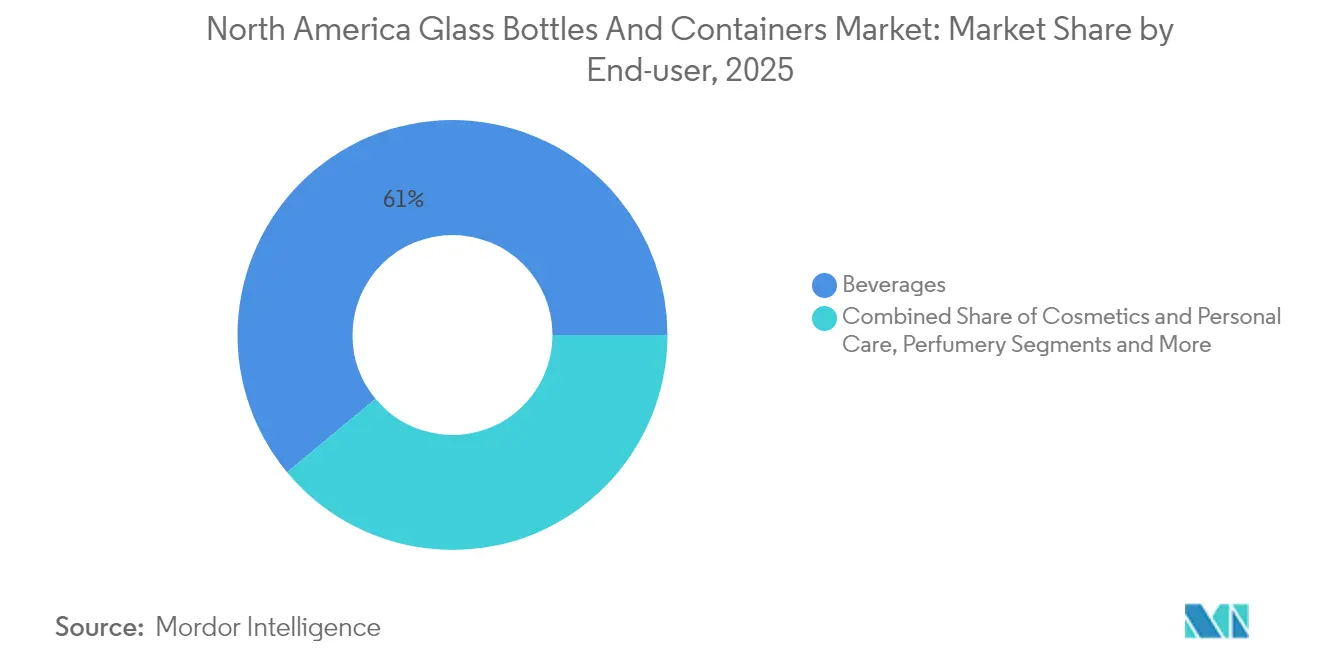
- By end-user, beverages captured 61.02% of the North America glass bottles and containers market share in 2025.
- By color, the North America glass bottles and containers market for amber glass is projected to grow at a 3.69% CAGR between 2026-2031.
Note: Market size and forecast figures in this report are generated using Mordor Intelligence’s proprietary estimation framework, updated with the latest available data and insights as of 2026.
Market Trends and Insights
Drivers Impact Analysis of North America Glass Bottles And Containers Market*
| Driver | (~) % Impact on CAGR Forecast | Geographic Relevance | Impact Timeline |
|---|---|---|---|
| E-commerce growth drives demand for durable, premium packaging | +0.8% | United States and Canada, spill-over to Mexico | Medium term (2-4 years) |
| Craft beverage boom fuels demand for custom glass bottles | +0.7% | United States core, expanding to Canada | Short term (≤ 2 years) |
| Sustainability push and recyclability favor glass over plastic | +0.6% | Global with early gains in California, New York, Ontario | Long term (≥ 4 years) |
| Extended Producer Responsibility programs promote glass adoption | +0.4% | Canada nationwide, select U.S. states | Medium term (2-4 years) |
| Embossing and artistic finishes enhance brand differentiation | +0.3% | North America premium segments | Short term (≤ 2 years) |
| Consumer shift toward healthier packaging fuels glass preference | +0.5% | United States and Canada urban markets | Medium term (2-4 years) |
| Source: Mordor Intelligence | |||
E-commerce growth drives demand for durable, premium packaging
U.S. online retail volume is expected to jump 53% between 2024 and 2029, compelling brands to seek rigid solutions that survive multi-stage shipping while preserving product aesthetics. Glass bottles satisfy both requirements; they resist compression forces and create a signature “unboxing” moment that strengthens direct-to-consumer loyalty. Cosmetics, artisanal condiments, and niche beverages, all common in subscription boxes, now specify custom protective inserts that pair with lightweight glass formats to minimize breakage. Fulfillment centers increasingly incorporate automated void-fill lines calibrated for standard 250-mL and 500-mL bottle footprints, lowering handling costs. As last-mile networks refine temperature-controlled services, cold-chain beverage sellers can maintain premium positioning without resorting to multilayer plastics. Together, logistics optimization and consumer perception cement glass as the go-to vessel within the North America glass bottles and containers market.
Craft beverage boom fuels demand for custom glass bottles
The United States added more than 300 distilleries and 250 microbreweries in 2024 alone, each emphasizing localized identity and shelf differentiation. Embossed logos, non-uniform shoulder profiles, and cork-finish necks have become hallmark cues that command pricing premiums in tasting rooms. Custom molds, once viable only above 500,000-unit runs, are now economical at 50,000 units thanks to modular tooling and 3-D sand-printing of blanks. Canadian cideries echo the trend, importing colored flint/amber hybrids that blend UV protection with see-through appeal. Regional glasshouses in Kentucky, Missouri, and Ontario benefit from short lead times, cutting freight emissions and reinforcing sustainability stories. These factors combine to lift value throughput for customized formats inside the North America glass bottles and containers market.
Sustainability push and recyclability favor glass over plastic
Glass can be reclaimed endlessly with no loss in purity, positioning it at the heart of statewide single-use legislation. California’s mandate that all packaging be recyclable or compostable by 2032, coupled with extended bottle-bill refunds in New York, boosts cullet demand and improves collection economics. Brands now label percentage-of-recycled-content on neck bands, triggering a 14-point uplift in purchase intent among millennial consumers. Wine and spirits marketers publicize closed-loop partnerships that channel tasting-room empties back into local furnaces, cutting carbon footprint by 30% versus a virgin batch. Investment in low-carbon electric furnaces accelerates, with two such lines slated to start in Ohio by late 2026. Combined, policy momentum and brand messaging amplify the material-of-choice narrative for the North America glass bottles and containers market.
Extended Producer Responsibility programs promote glass adoption
Nine Canadian provinces operate EPR schemes requiring producers to finance end-of-life recovery. Clear-glass processing fees average CAD 0.50 per kilogram (USD 0.37) versus higher levies on composite plastics, tilting economics toward glass. British Columbia already achieves 79.6% recovery, supplying high-quality cullet that lowers furnace energy use by up to 3%. U.S. pilot EPR proposals in Maine and Oregon borrow fee-modulation models that reward mono-material packaging.[1]Packaging School Faculty, “Extended Producer Responsibility for Packaging in Canada,” PackagingSchool.comAs policy spreads, small brands discover that switching to lightweight amber bottles can offset fee exposure while satisfying retailer recyclability scorecards. Therefore, EPR acts as a structural tailwind for the North America glass bottles and containers market.
Restraints Impact Analysis of North America Glass Bottles And Containers Market*
| Restraint | (~) % Impact on CAGR Forecast | Geographic Relevance | Impact Timeline |
|---|---|---|---|
| Recycling infrastructure gaps limit cullet availability | -0.5% | Rural areas across North America | Long term (≥ 4 years) |
| Weight and fragility increase last-mile delivery costs | -0.4% | E-commerce-dense urban centers | Medium term (2-4 years) |
| Plastic and metal packaging continue to dominate mass SKUs | -0.3% | Mass-market retail channels | Long term (≥ 4 years) |
| High furnace energy requirements raise carbon exposure | -0.2% | Manufacturing regions with high energy costs | Short term (≤ 2 years) |
| Source: Mordor Intelligence | |||
Recycling infrastructure gaps limit cullet availability
Glass collection varies from Oregon’s 73% to Illinois’s 8%, constraining a reliable secondary feedstock stream. Rural towns often lack drop-off depots, forcing haulers to landfill mixed-color cullet. Strategic Materials Inc. runs 42 processing plants, yet still covers fewer than half of the U.S. counties. When cullet supply dips, batch recipes revert to virgin soda-lime, raising fuel use by 15% and eroding carbon credentials. Manufacturers in well-served corridors like the Pacific Northwest enjoy cost advantages of USD 15 per ton over Midwest peers, exacerbating regional imbalances inside the North America glass bottles and containers market.
Weight and fragility increase last-mile delivery costs
Shipping a 12-pack of 330-mL glass bottles weighs 2.4 kg more than equivalent cans, escalating zone-based courier fees by 18% on average. Protective corrugate dividers add material cost and enlarge dimensional weight. Small e-tailers struggle to absorb surcharges, nudging them toward lighter formats. Producers counter through light-weighting: a major spirits brand shaved 90,000 tons by reducing the bottle wall thickness by 1 mm in 2024. Nevertheless, fragile handling requirements remain a cost headwind across the North America glass bottles and containers market.
*Our forecasts treat driver/restraint impacts as directional, not additive. The impact forecasts reflect baseline growth, mix effects, and variable interactions.
North America Glass Bottles And Containers Market Segment Analysis
By End-User:
Beverages Anchor Volume, Beauty Accelerates UpsideSales to beverage producers represented 61.02% of the North America glass bottles and containers market in 2025, thanks to entrenched craft-beer, premium-spirits, and functional-drink consumption. Regulatory limits on plastics in alcoholic packaging further entrench glass as the default for flavor preservation and brand heritage storytelling. The segment is projected to chart stable low-single-digit gains as SKU proliferation offsets plateauing mainstream beer volumes. Premium mixers and ready-to-drink cocktails tap fluted neck designs and embossing cues previously reserved for spirits, elevating average selling prices. Cosmetics and personal care, while having a smaller base, are forecast to post a 3.6% CAGR through 2031, outpacing all other end-uses within the North America glass bottles and containers market. Luxury skincare labels emphasize thick-walled jars that convey heft and reusability; refill stations in prestige department stores spur repeat visits.
Pharmaceutical demand benefits from the FDA’s 2024 consolidated guidance, which streamlines validation for Type I borosilicate vials. Contract development and manufacturing organizations (CDMOs) therefore broaden vial portfolios, lifting medical-grade glass production. Food segments such as gourmet jams, dipping sauces, and cold-pressed oils sustain niche growth, leveraging transparent glass to showcase natural textures and reinforce artisanal positioning. Collectively, diversified uptake across these verticals underpins long-term stability for the North America glass bottles and containers market size.



By Color:
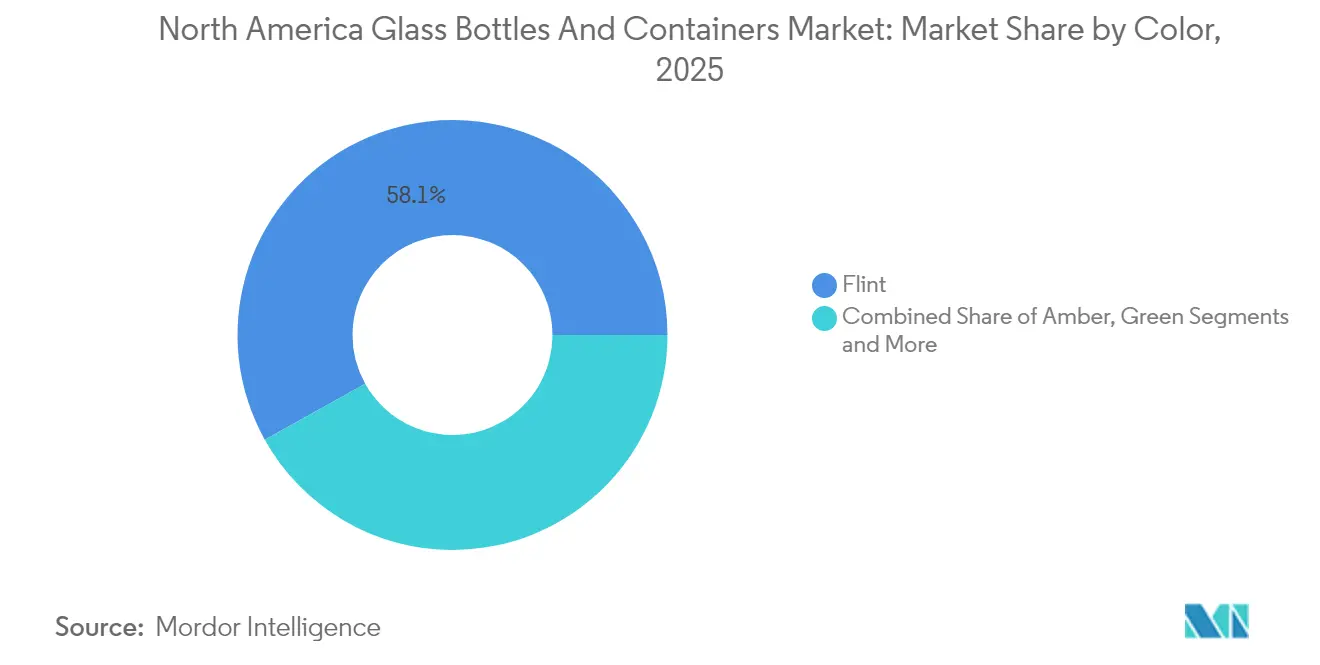
Amber Outpaces as Flint Retains ScaleFlint glass held 58.10% of the North America glass bottles and containers market share in 2025, serving sectors where clarity informs freshness cues and dosing accuracy. Pharmaceutical fillers require line-vision inspection systems that rely on crystal-clear walls, ensuring ongoing baseline demand. Beverages such as vodka and botanical spirits champion ultra-flint variants with low iron content, enhancing optic brilliance and shelf lighting effects. The category’s volume outlook, however, is tempered by rising ultraviolet-sensitivity awareness that favors darker tones for nutraceuticals and cold-brew coffee.
Amber glass is slated to advance at a 3.69% CAGR, the quickest among color classes, propelled by premium beer, sunscreen serums, and CBD tinctures. Producers market amber’s ability to block up to 97% of UV-A rays, reducing photodegradation without chemical stabilizers. High recycled-content amber cullet helps brands broadcast carbon-reduction milestones, adding marketing heft. Collaborations with craft-distilling co-ops in Texas and Ontario have produced proprietary amber hues that echo barrel char, reinforcing authenticity narratives within the North America glass bottles and containers market size.
Geography Analysis
United States Glass Bottles and Containers Market
The United States supplies over 70% of regional output, buoyed by proximity to large beverage hubs and a dense network of recycling processors. O-I Glass recorded USD 141 million operating profit in Q1 2025, a 38% leap year on year, citing 4% higher shipments and stable net pricing signals of effective capacity alignment. Craft distilleries in Kentucky, Tennessee, and New York underpin specialized bottle demand, while West Coast kombucha facilities champion lightweight flint bottles in 200-mL formats. Federal Infrastructure Investment and Jobs Act funds earmarked for municipal recycling upgrades promise to ease cullet shortages in Midwestern states by late 2027.
Canada Glass Bottles and Containers Market
Canada contributes a consistent volume under a stringent Extended Producer Responsibility umbrella. Provincial recovery fees that favor mono-material containers spur glass circulation loops, with British Columbia’s 79.6% packaging recovery rate topping North American charts. Ontario’s forthcoming Blue-Box revamp will shift full financial responsibility to producers, nudging multinational beverage groups to revamp bottle shapes compatible with single-stream sorters. Quebec’s established curbside program channels substantial funding, nearly CAD 1 billion, since 2005 into optical-sorting retrofits. These frameworks bolster cullet supply, lowering batch energy demand in the North America glass bottles and containers market.
Mexico Glass Bottles and Containers Market
Mexico serves as both export platform and expansion frontier. Established player Vitro operates furnaces in Coahuila and Nuevo León, shipping flint beer bottles to U.S. border breweries under favorable trade tariffs. Domestic premium-tequila brands specify heavy-base, art-glass decanters that showcase artisanal hand-finishing, elevating per-unit value. New cullet-processing capacity in Guadalajara, scheduled for Q3 2026, will feed growing cosmetic-jar orders from cross-border contract fillers. Coupled with rising middle-class spending, these investments place Mexico as a growth lever within the broader North America glass bottles and containers market.
Competitive Landscape
Market concentration is moderate. The top five suppliers account for roughly 55% of regional shipments, a figure shaped by recent restructuring. Ardagh Group, downgraded to CCC by Fitch, is shuttering under-utilized beer-bottle lines in California and Ohio to stabilize cash flows. O-I Glass’s “Fit to Win” program envisages at least six permanent furnace closures through 2026, trimming redundant capacity while allocating USD 650 million in savings toward electric-melter pilots. These moves seek to balance supply with post-pandemic demand normalization in the North America glass bottles and containers market.
Strategic direction tilts toward decarbonization. Leading companies co-invest with power utilities in renewable-electricity purchase agreements that underwrite hybrid furnaces capable of 30% CO₂ cuts. Closed-loop partnerships with Strategic Materials Inc. guarantee cullet purity exceeding 98%, enabling weight reduction without compromising strength. Select producers trial hydrogen-oxy fuel combustion, reporting promising NOₓ reductions. Patenting of hot-end coating formulations that maintain scratch resistance on thinner walls adds another competitive veneer.
Mergers and acquisitions target specialized niches. Gerresheimer’s December 2024 purchase of Bormioli Pharma expands its presence in injectable biologics containment. TricorBraun’s 2025 acquisition of Euroglas and Glaspack brings premium European wine-bottle shapes into its catalog for North American importers. Equipment vendors also consolidate; Indicor’s March 2025 deal for AGR International secures glass-inspection know-how essential for ramping pharmaceutical quality standards. Overall, innovation, sustainability metrics, and selective consolidation shape rivalry inside the North America glass bottles and containers market.
North America Glass Bottles And Containers Industry Leaders
O-I Glass, Inc
Ardagh Group S.A.
Anchor Glass Container Corporation
Gerresheimer AG
Stoelzle Glass Group
- *Disclaimer: Major Players sorted in no particular order
North America Glass Bottles And Containers Market Companies Covered in this Report
- O-I Glass, Inc.
- Ardagh Group S.A.
- Anchor Glass Container Corporation
- Gerresheimer AG
- Stoelzle Glass Group
- Berlin Packaging LLC
- TricorBraun Inc.
- Kaufman Container
- O.Berk Company, LLC
- MJS Packaging
- Burch Bottle & Packaging, Inc.
- General Bottle Supply
- Pacific Vial Manufacturing Inc.
- North Mountain Supply
- Silver Spur Corporation
- Glassnow, Inc.
- Love Bottle LLC
- Vitro Packaging LLC
- Gallo Glass Company
- The Cary Company
Read Analysis of North America Glass Bottles And Containers Companies

Market Opportunities and Future Outlook
Decarbonization and productivity upgrades across North American container-glass capacity are creating whitespace for suppliers that can support lighter-weight designs, higher recycled-cullet tolerance, and more consistent cosmetic quality for premium beverage and beauty SKUs. The market is already showing investment signals in 2026, including Stoelzle Glass USA's USD 100 million modernization program at Monaca, Pennsylvania, with a furnace rebuild scheduled for July 2026 and a stated target to lift daily melting capacity to around 400 tons. On the demand side, Coca-Cola Consolidated's USD 35 million plan to add a glass bottle production line at Indianapolis, Indiana (construction scheduled to start in late 2026) adds pull for standardized bottle formats and local sourcing.
Policy-linked recycling economics and stewardship programs remain an actionable lever for glass adoption, especially where payments or fee modulation directly reward recycled content and mono-material packaging. California's AB 899 (signed October 2025) extends and increases market-development payments that incentivize recycled glass use by container manufacturers, reinforcing business cases for cullet-processing partnerships and closed-loop collection around major beverage corridors. At the same time, 2026 legislative action such as Vermont's H.915 (scheduled to take effect in July 2026) keeps producer-funded end-of-life frameworks active, giving brand owners and packagers a clearer basis for material choices, and enabling glass manufacturers to differentiate on verified recycled content and domestic supply continuity amid trade and tariff volatility.
Recent Industry Developments in North America Glass Bottles And Containers Market
- June 2026: Ardagh Glass Packaging-North America expanded its American-made premium spirits portfolio with a new 700 ml liquor bottle. The launch followed the Alcohol and Tobacco Tax and Trade Bureau (TTB) ruling that authorized additional standards of fill, enabling spirits brands to broaden SKU architectures without shifting away from glass.
- October 2025: Anchor Glass Container Corporation completed a comprehensive recapitalization, cutting total debt by over 60% and securing USD 100 million in new capital. The transaction strengthened its ability to fund furnace rebuilds and other capacity-related upgrades across its U.S. manufacturing network, supporting service reliability for beverage and food customers.
- December 2024: Gerresheimer completed its acquisition of Bormioli Pharma. The deal broadened Gerresheimer's sterile and sensitive-drug packaging portfolio, reinforcing its pharmaceutical-grade glass and containment capabilities that carry into higher-spec container requirements in North America.


North America Glass Bottles And Containers Market Report Scope and Research Methodology
Market Definition and Coverage
This market covers rigid packaging containers made from glass, mainly bottles and jars, used to pack and sell products across North America. Market sizing is built on physical volumes shipped and consumed in the region over the study period.
Scope exclusions: Glass vials and ampoules used in pharma packaging are excluded from this market sizing.
Segments Covered in This Report
- By End-user
- Beverages
- Alcoholic
- Beer
- Wine
- Spirits
- Other Alcoholic Beverages (Cider and Other Fermented Drinks)
- Non-Alcoholic
- Juices
- Carbonated Drinks (CSDs)
- Dairy Product Based Drinks
- Other Non-Alcoholic Beverages
- Alcoholic
- Food (Jam, Jelly, Marmalades, Honey, Sausages and Condiments, Oil, Pickles)
- Cosmetics and Personal Care
- Pharmaceuticals (excluding Vials and Ampoules)
- Perfumery
- Beverages
- By Color
- Green
- Amber
- Flint
- Other Colors
- By Country
- United States
- Canada
- Mexico
Data Sources, Market Sizing, and Validation
Desk Research
Desk work starts by mapping how container glass demand is created in beverages, food, and personal care, and then aligning it with the supply base in the United States and Canada. For this, we leaned on public data points such as US Census manufacturing series, US International Trade Commission trade statistics, Statistics Canada manufacturing and trade tables, and EPA materials and recycling publications, alongside industry association releases and technical papers.
To keep assumptions realistic, we also reviewed company annual reports and investor presentations for capacity additions, furnace rebuild timelines, and utilization commentary, followed by reputable press coverage on energy, cullet availability, and regulatory packaging signals. In a few places, paid database subscriptions were used for company financials, patent lookups, and shipment level import export checks, mainly to confirm direction and spot gaps. These examples are not exhaustive, and many other public sources were also used for data collection, validation, and clarification during the study.
Primary Interviews and Surveys
Primary work was used to confirm what is actually moving the market in recent quarters, and to tighten inputs that are hard to read from public data, such as color mix shifts and lightweighting pace. We spoke with manufacturers, distributors, brand and packaging procurement teams, and recycling value chain experts across the United States and Canada. The feedback was then used to reconcile desk assumptions and finalize the model ranges.
Distribution of primary research fieldwork respondents
| Company type | Respondent position |
|---|---|
| Top tier: 34% | CXOs: 17% |
| Mid tier: 47% | Functional/Unit leaders: 40% |
| Smaller Players: 19% | Managers: 43% |
Market-Sizing & Forecasting
For sizing, the top-down step rebuilds demand from end-use pools where glass is a regular pack choice, then converts those pools into container glass volume using pack format and typical weight ranges. Once the demand pool is established, it is pushed through country splits and color splits to match the market definition.
The model is guided by practical inputs such as alcoholic and non-alcoholic beverage output and filling trends, food category pack penetration for jars and bottles, premiumization signals that affect glass share, cullet availability and recycling rates that influence supply response, and furnace rebuild or capacity expansion timing. To corroborate the totals, we also ran selective bottom-up checks using sampled supplier shipment patterns, trade flow direction for empty containers, and price per tonne ranges to sanity-check implied volumes and growth. Where company or category data was missing, we used proxy indicators from comparable categories and then adjusted them based on what interviewees described as realistic substitution and mix behavior.
Forecasts were built using scenario analysis. The core case is anchored to expected beverage and food demand growth, then stress-tested for energy cost swings, regulatory packaging shifts, and changes in recycling constraints. The final outlook reflects what industry participants said is achievable in the next five years, rather than a purely mechanical extrapolation.
Data Validation & Update Cycle
Outputs are cross-checked against independent signals such as historic volume patterns, trade movements, and known capacity events, so the growth path does not drift away from real market constraints. If an assumption creates a sudden jump in tonnes, it is flagged, reviewed, and traced back to a specific driver before it remains in the model.
Before sign-off, the work goes through a multi-step internal review where calculations, units, and country splits are rechecked, and key assumptions are challenged with at least one additional analyst pass. Reports are refreshed annually, and interim updates are made when material events occur, including major furnace shutdowns, large expansions, or policy shifts that change glass adoption. Right before delivery, a quick validation pass is done again so clients receive the most current view.
Mordor Intelligence's North America Glass Bottles Containers Market Estimate Compared With Other Published Estimates
Published market figures for this space often do not match because the product boundary and the measurement unit can change from one study to the next. Differences also show up when a report blends all glass packaging formats into one number or when it converts volume to value using a single price assumption that does not reflect mix and energy-driven price swings.
Glass vials and ampoules in pharma packaging sit outside Mordor Intelligence's scope here, and that inclusion choice alone can widen the gap versus sources that label the market as total glass packaging. Beyond scope, the spread is typically driven by how beverage and food demand indicators are translated into container volumes, how recycled content constraints are treated, and whether exchange rates and inflation timing are applied consistently for the stated year.
Benchmark comparison
| Source | Market Size | Gaps in Research Methodology |
|---|---|---|
| Mordor Intelligence | USD 11.46 M (2025) | |
| Trade Publisher A | USD 16.97 B (2024) | Uses a broader glass packaging definition and reports value, which can fold in pharma formats and other glass packs beyond bottles and containers, and it also depends heavily on average price assumptions. |
| Industry Tracker B | USD 11.42 B (2024) | Reported as a value market for glass packaging with a different base year, and the estimate can shift based on how ASP progression, inflation timing, and currency conversion are applied across countries. |
The comparison mainly points to scope and unit differences, where some sources describe a value market for all glass packaging and others isolate container glass volumes. By keeping the demand pool tied to clear end uses and then checking it against capacity and trade signals, the resulting size stays traceable to repeatable inputs that a buyer can reconcile year over year.


Key Questions Answered in the Report
How large is the North America glass bottles and containers market in 2026?
The market reached 11.82 million tonnes in 2026 and is projected to grow at a 3.15% CAGR to 2031.
Which end-use holds the largest share?
Beverage applications control 61.02% of regional volume, driven by craft beer and premium spirits.
What is the fastest-growing color segment?
Amber glass is forecast to rise at a 3.69% CAGR through 2031 thanks to its UV-blocking and premium cues.
How are Extended Producer Responsibility laws affecting demand?
Provincial EPR fees favor recyclable mono-material containers, nudging more brands toward glass packaging.
Which country drives the majority of regional output?
The United States supplies over 70% of North American glass container production, supported by extensive manufacturing and recycling infrastructure.
Page last updated on:


 Your data is secure and never sold or shared.


