Market Overview
| Study Period | 2019 - 2030 |
|---|---|
| Forecast Data Period | 2025 - 2030 |
| Historical Data Period | 2019 - 2023 |
| Market Size (2025) | USD 29.56 Billion |
| Market Size (2030) | USD 36.87 Billion |
| Growth Rate (2025 - 2030) | 4.52% CAGR |
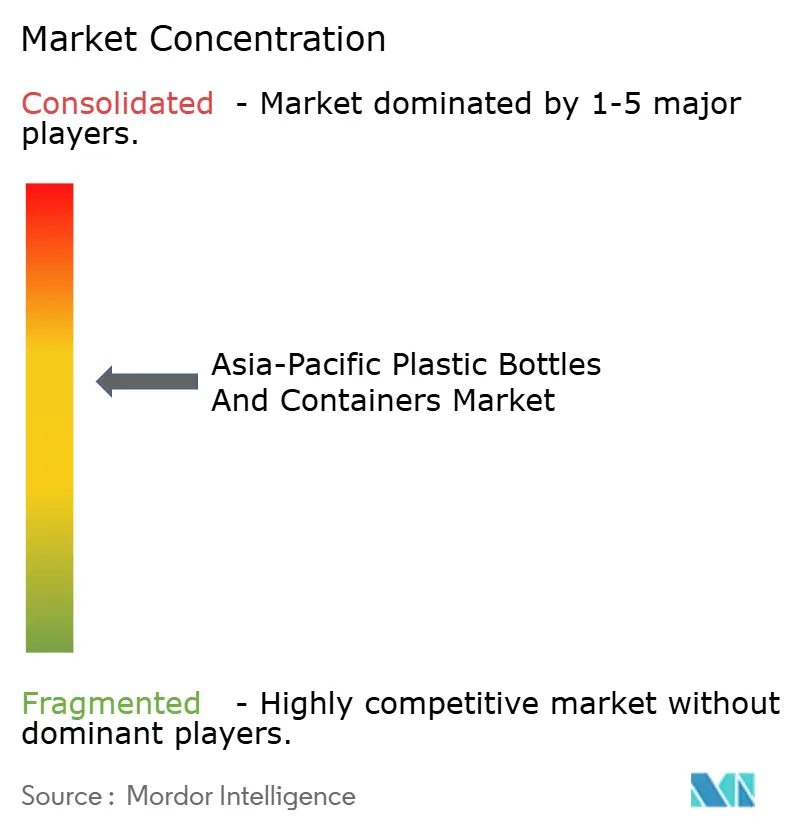
| Market Concentration | Medium |
Major Players *Disclaimer: Major Players sorted in no particular order Image © Mordor Intelligence. Reuse requires attribution under CC BY 4.0. | |

Asia-Pacific Plastic Bottles And Containers Market Analysis by Mordor Intelligence
The Asia-Pacific plastic bottles and containers market size stood at USD 29.56 billion in 2025 and is forecast to reach USD 36.87 billion by 2030, advancing at a 4.52% CAGR. Momentum stems from a growing middle class, rapid e-commerce penetration, and government policies that reward recycled content adoption. Beverage producers continue to favor lightweight PET, pharmaceutical fillers are shifting to precision molded PP, and brand-owners invest in refillable formats to meet 2030 sustainability pledges. At the same time, resin price swings tied to crude oil volatility encourage converters to hedge raw material exposure through greater use of rPET and HDPE recyclate. Regional players are also digitizing their factories with AI-enabled vision systems that cut scrap rates, a move that supports both cost efficiency and carbon-reduction targets.
Key Report Takeaways
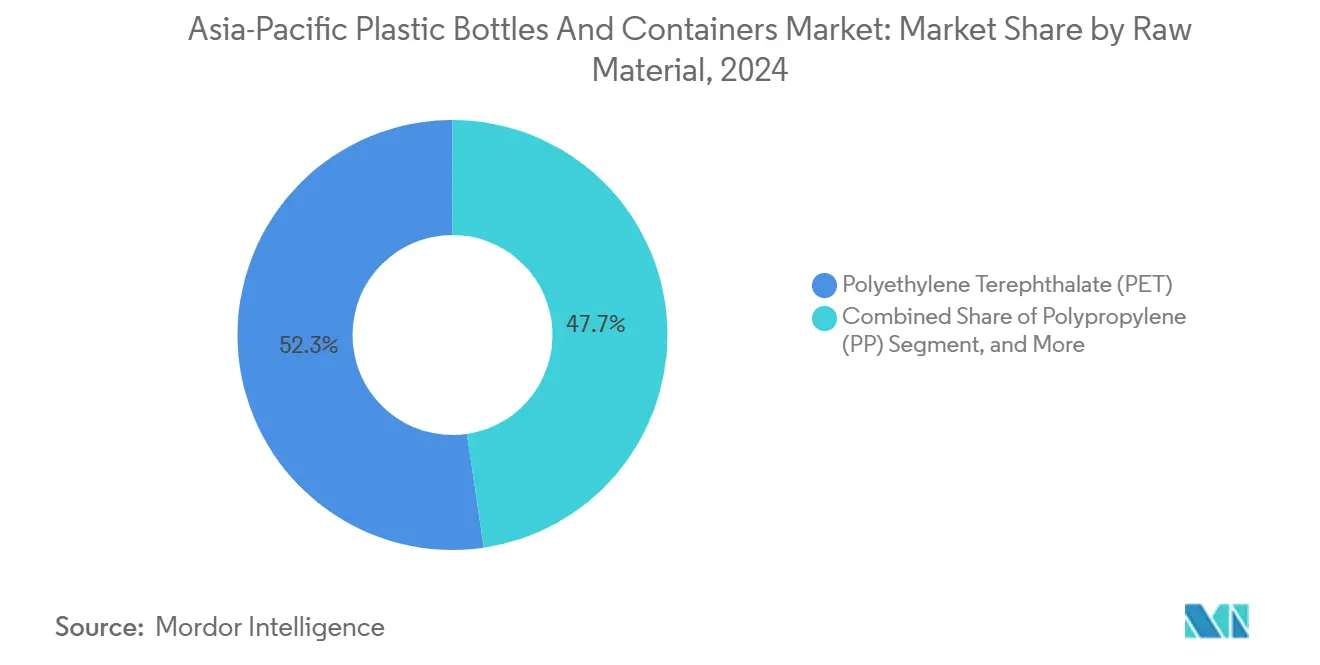
- By raw material, PET held 52.32% of the Asia-Pacific plastic bottles and containers market share in 2024, while PP is projected to expand at a 5.11% CAGR through 2030.
- By packaging type, bottles accounted for 48.32% of the Asia-Pacific plastic bottles and containers market size in 2024, whereas ampoules and vials are poised for the fastest growth at a 6.64% CAGR to 2030.
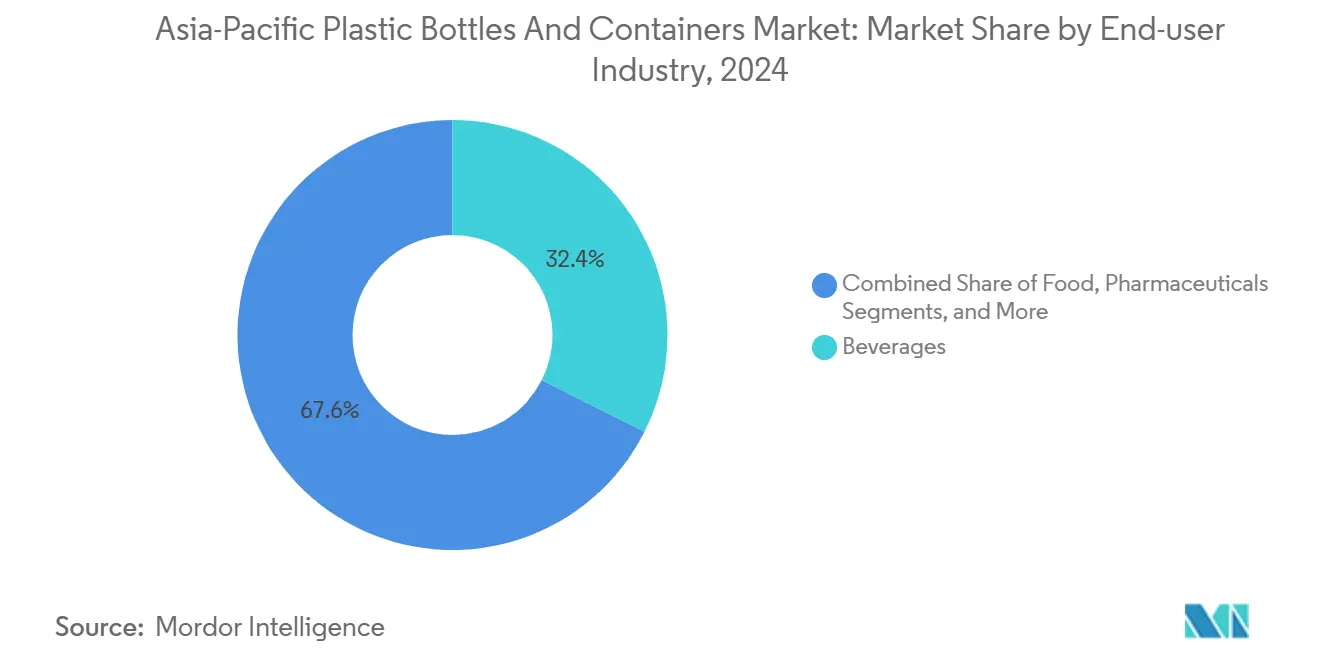
- By end-user, beverages captured 32.43% of the Asia-Pacific plastic bottles and containers market share in 2024; pharmaceuticals are forecast to accelerate at a 5.84% CAGR over the same period.
- By manufacturing technology, injection stretch blow molding (ISBM) dominated with 29.89% revenue share in 2024, while injection blow molding (IBM) leads growth at a 5.22% CAGR through 2030.
- By country, China contributed 22.67% of the Asia-Pacific plastic bottles and containers market size in 2024, yet India is advancing the quickest at a 6.12% CAGR between 2025-2030.
Asia-Pacific Plastic Bottles And Containers Market Trends and Insights
Drivers Impact Analysis*
| Driver | (~) % Impact on CAGR Forecast | Geographic Relevance | Impact Timeline |
|---|---|---|---|
| Lightweight, recyclable packaging adoption | +0.8% | Japan, South Korea, regional spillover | Medium term (2-4 years) |
| Rising aseptic PET demand in dairy drinks | +0.6% | China, India, ASEAN | Short term (≤ 2 years) |
| Expansion of e-commerce grocery fulfillment | +0.9% | Urban China and India | Short term (≤ 2 years) |
| Japan’s mandatory rPET content quotas | +0.4% | Japan | Medium term (2-4 years) |
| Brand pledges for 100% refillable formats | +0.5% | Region-wide multinational brands | Long term (≥ 4 years) |
| AI/IoT in blow-mold quality control | +0.3% | China, Thailand, Malaysia | Medium term (2-4 years) |
| Source: Mordor Intelligence | |||


Accelerating shift toward lightweight, recyclable packaging
Converters across the Asia-Pacific plastic bottles and containers market cut resin usage to offset HDPE spot prices that oscillated between USD 1,145-1,205 per t during 2024. ALPLA responded by doubling its regional recycling capacity to 700,000 t, enabling new thin-wall containers made from 100% rPET.[1]ALPLA Group, “Corporate Facts & Figures,” alpla.com Brand-owners gain freight savings from lower pack weights, while regulators view lightweighting as an intermediate step toward full circularity. Advanced simulation software further optimizes wall-thickness distribution and reduces design cycles, helping converters defend margins even when virgin resin prices spike.
Growth in aseptic PET bottle demand for dairy and functional drinks
Shelf-stable dairy beverages now favor PET over cartons thanks to multi-layer barrier technology that protects nutrients without refrigeration. SIG’s EUR 90 million aseptic plant in India came online in February 2025, adding 4 billion packs of annual capacity to serve local dairies. Producers benefit from longer distribution reach in hot climates, and lighter PET cuts logistics costs by up to 35% relative to glass. The rapid pivot also lifts demand for specialty closures with tamper-evidence and oxygen-scavenging features, creating incremental revenue for closure suppliers.
Rapid expansion of e-commerce grocery fulfillment centers
Online grocers require containers that survive automated picking lines yet minimize material waste. AI-driven sizing algorithms cut oversized packaging, trimming average plastic use by 10% per order and lowering damage rates. Amazon’s USD 7.7 million investment in robotic sortation technology underscores the need for monomaterial packs that move cleanly through recycling streams. This dynamic compels converters to design PET and HDPE bottles with rigid geometries compatible with robotic grippers while printing scannable QR codes for inventory accuracy.
Mandated rPET quotas under Japan’s Containers and Packaging Recycling Law
Legislation now obligates Japanese beverage bottlers to include a minimum recycled content-10% in 2025 and rising to 25% by 2030-creating guaranteed demand for food-grade rPET flakes. Toray and SK Chemicals struck multi-year supply agreements to secure feedstock, pushing regional recycling investments above USD 250 million since 2024. Neighboring countries benefit as surplus high-quality flakes flow into Japan, lifting prices and improving collection economics across ASEAN.
Restraints Impact Analysis*
| Restraint | (~) % Impact on CAGR Forecast | Geographic Relevance | Impact Timeline |
|---|---|---|---|
| Single-use plastic bans in ASEAN | −0.7% | Thailand, Malaysia, Indonesia, Philippines | Short term (≤ 2 years) |
| Virgin resin price volatility | −0.5% | Import-dependent economies | Short term (≤ 2 years) |
| Limited supply of food-grade rPET flakes | −0.4% | China, India, Japan | Medium term (2-4 years) |
| Consumer shift to aluminum and paper | −0.3% | Premium segments in Japan and Australia | Medium term (2-4 years) |
| Source: Mordor Intelligence | |||
Single-use plastic bans across ASEAN markets
Thailand’s phased ban on certain plastic sachets and Malaysia’s tighter waste-import rules force converters to redesign portfolios or lose shelf space. Short compliance windows raise tooling costs and complicate regional sourcing strategies. Multinationals mitigate risk by standardizing PET bottle designs that qualify for local recycling exemptions, while smaller firms face margin pressure from costly material substitutions.
Volatile virgin resin pricing tied to crude-oil swings
Spot HDPE and PET costs moved in a USD 60 per t band during 2024, disrupting budget planning and squeezing processor spreads. Integrated players with upstream resin assets absorb shocks, but independent converters lean on formula-based contracts pegged to Platts indices. The uncertainty accelerates procurement of recycled feedstock, yet tight bale supply limits immediate substitution potential.
*Our forecasts treat driver/restraint impacts as directional, not additive. The impact forecasts reflect baseline growth, mix effects, and variable interactions.
Segment Analysis
By Raw Material: PET Dominance Meets PP Upside
PET commanded 52.32% of the Asia-Pacific plastic bottles and containers market share in 2024, anchored by beverage applications and an expanding rPET supply chain. The material’s clarity, barrier performance, and established collection networks keep it ahead even as virgin resin prices fluctuate. The segment is projected to grow steadily, supported by SK Chemicals’ USD 98.4 million recycled-PET investment that adds 120,000 t of annual capacity. PP, while smaller, is climbing at a 5.11% CAGR on the back of pharmaceutical and cosmetics demand that values its chemical resistance. Each new PP medical vial displaces glass, cutting breakage rates and cold-chain weight.
Converters also explore bio-based PE and chemically recycled feedstocks to future-proof their portfolios. HDPE remains indispensable for household cleaners, with suppliers like KEYUAN highlighting its durability in caustic environments. LDPE and specialty copolymers serve niche closures and dropper bottles, though their volume contribution is minor. Material choices thus balance cost, regulatory acceptance, and performance as sustainability metrics gain prominence.


By Packaging Type: Bottles Still Rule as Vials Surge
Bottles held 48.32% of the Asia-Pacific plastic bottles and containers market size in 2024, thanks to their ubiquity in beverages, edible oils, and personal care. Lightweighting has lowered the average 500 ml PET bottle weights to 17 g in China, saving resin and transport costs. Yet specialized pharmaceutical vials and ampoules are advancing fastest at a 6.64% CAGR, underpinned by vaccine fill-finish investments and growing biologics output. Gerresheimer’s acquisition of Bormioli Pharma in December 2024 strengthens its vial footprint and unlocks cross-selling into Asian injectables plants.[2]Gerresheimer AG, “Acquisition of Bormioli Pharma,” gerresheimer.com
Jars and canisters cater to premium cosmetics, where thick-wall PET conveys glass-like aesthetics without breakage risk. Jerrycans remain essential for agrochemicals and lubricants, with UN-certified HDPE grades ensuring leak-proof transport. Niche forms such as collapsible bag-in-bottle structures appear in functional beverage launches, signaling ongoing innovation.
By End-user Industry: Beverages Anchor, Pharma Accelerates
Beverages contributed 32.43% of 2024 revenue, reinforcing the centrality of PET to the Asia-Pacific plastic bottles and containers market. Still and sparkling water brands invest in tethered-cap designs that meet EU rules already adopted voluntarily by ASEAN exporters, boosting recyclability. Pharmaceuticals, however, exhibit the strongest trajectory at a 5.84% CAGR through 2030 as governments expand universal health coverage and biologics pipelines. SIG’s aseptic lines enable long-shelf-life dairy-based nutrition drinks that blur categories and capture value in both pharma and beverage channels.
Food processors require barrier jars for sauces and condiments, while cosmetics brands push for PCR content to align with corporate ESG goals. Industrial chemicals round out demand with HDPE jerrycans that comply with hazardous-goods norms. End-use diversification, therefore, cushions the sector against single-category downturns.
By Manufacturing Technology: ISBM Scale Versus IBM Precision
ISBM delivered 29.89% of 2024 output, favored for high-speed bottle production that achieves excellent material distribution. Energy-efficient ovens and dual-axis orientation further cut cycle times, sustaining dominance in the Asia-Pacific plastic bottles and containers market. IBM, though smaller, outpaces overall growth at 5.22% CAGR given its aptitude for small, high-tolerance containers required by injectable drugs and premium serums.
Extrusion blow molding supplies larger volumes for household and industrial chemicals, where thick walls and handleware are priorities, while compression molding fills select cap applications. AI-enabled closed-loop control systems now retrofit across all platforms, with converters reporting scrap reductions of up to 30% in the first year of deployment.
Geography Analysis
China accounted for 22.67% of the Asia-Pacific plastic bottles and containers market size in 2024, underpinned by vast filler demand and integrated resin production. Domestic recyclers collected 3.9 million t of PET bottles in the same year, feeding both local and export pellet markets. Yet price volatility-HDPE spot swings of USD 60 per t within six months-encourages brand-owners to dual-source resin to protect margins.
India is the fastest riser, projected to grow at 6.12% CAGR through 2030 on the back of urbanization and a thriving pharmaceutical export sector. SIG’s greenfield aseptic plant near Ahmedabad adds 4 billion packs to domestic capacity, enabling local dairies to move from pouches to PET bottles.[3]SIG Combibloc Group AG, “SIG Opens New Plant in India,” sig.biz Government production-linked incentives further tilt the investment calculus toward domestic manufacture, reducing reliance on imports.
Japan and South Korea set the region’s regulatory tone. Japan’s rPET quotas compel fillers to lock in long-term flake contracts, while South Korea has raised mandatory recycled content in PET bottles to 10% starting 2025. Australia emphasizes deposit-return schemes that push PET recovery rates above 70%, whereas ASEAN markets balance growth ambitions with bans on certain single-use items. Collectively, these diverse policy landscapes demand agile supply chains that can pivot between recycled and virgin feedstocks while maintaining cost competitiveness.
Competitive Landscape
Regional competition is moderate, with the top five converters estimated to hold roughly 35% combined share, leaving headroom for niche specialists. Amcor closed its merger with Berry Global in February 2025, creating a USD 24 billion packaging leader with expanded Asian reach and deeper rPET capabilities. ALPLA invests heavily in closed-loop recycling, targeting 700,000 t capacity by 2030 to secure feedstock for branded customers pursuing 30% PCR targets.
Mauser expanded rigid industrial packaging by acquiring Consolidated Container in 2025, reinforcing its UN-certified drum and IBC portfolio. Gerresheimer’s 2024 purchase of Bormioli Pharma bolsters high-precision vial supply for Asian injectables plants. SK Chemicals differentiates itself with chemically recycled PET that meets food-contact norms, positioning itself as a strategic resin partner for converters that lack upstream integration.
Innovation centers on circularity and digitalization. Converters retrofit AI vision systems that detect micro-defects in preforms, reducing scrap and energy use. Brand-owners pilot refill stations in South Korea and Japan, spurring development of durable PET grades. Material science advances-such as depolymerized monomers for infinite PET recycling-are gaining traction as capital costs fall. Collectively, these moves signal a strategic pivot from pure volume growth to value-driven, sustainable production across the Asia-Pacific plastic bottles and containers market.
Asia-Pacific Plastic Bottles And Containers Industry Leaders
Amcor plc
ALPLA Werke Alwin Lehner GmbH & Co KG
Gerresheimer AG
Silgan Holdings Inc.
Pact Group Holdings Ltd.
- *Disclaimer: Major Players sorted in no particular order

Recent Industry Developments
- February 2025: SIG inaugurated a EUR 90 million aseptic-packaging plant in India to serve dairy and functional beverage fillers.
- February 2025: Mauser Packaging Solutions acquired Consolidated Container Company, broadening its rigid-packaging footprint.
- February 2025: Amcor completed its merger with Berry Global, forming a USD 24 billion global packaging group.
- January 2025: ALPLA opened a new blow-molding facility in Thailand to meet Southeast Asian demand.


Asia-Pacific Plastic Bottles And Containers Market Report Scope
For this study, bottles are defined as rigid plastic containers with an open cap medium or a dispensing interface (such as a dropper, nozzles, pumps, sprays, etc.) that are primarily used by the manufacturer to pack fluid products. Containers are defined as rigid plastic containers that have only an open cap or closure medium for dispensing and usually contain very high or very minimal quantities of product (jars, canisters, buckets/pails, boxes, gallons, tubs, etc.) and are considered in this category. Unlike bottles, the containers classified in this section are, in most cases, re-usable and have a high demand from aftermarket sales as compared to the demand or consumption from manufacturers.
The scope is limited to B2B demand. The estimates exclude the weight of the content that is packed inside the plastic bottles and containers.
The Asia-Pacific plastic bottles and containers market is segmented by raw materials (polyethylene terephthalate (PET), polypropylene (PP), low-density polyethylene (LDPE), high-density polyethylene (HDPE), other raw materials), end-user vertical (beverages [bottled water, carbonated soft drinks, dairy-based, other beverages], food, cosmetics, pharmaceuticals, household care, other End-user verticals), by country (China, India, Japan, Australia and New Zealand, Southeast Asia, and Rest of Asia Pacific). The report offers market forecasts and size in volume (metric tons) and value (USD) for all the above segments.
By Raw Material
| Polyethylene Terephthalate (PET) |
| High-Density Polyethylene (HDPE) |
| Polypropylene (PP) |
| Low-Density Polyethylene (LDPE) |
| Bio-based and Compostable Materials |
By Packaging Type
| Bottles |
| Jars and Canisters |
| Jerrycans |
| Ampoules and Vials |
| Other Packaging Types |
By End-user Industry
| Beverages | Bottled Water |
| Carbonated Soft Drinks | |
| Dairy and Functional Drinks | |
| Alcoholic Beverages | |
| Food | |
| Pharmaceuticals | |
| Cosmetics and Personal Care | |
| Industrial Chemicals | |
| Other End-user Industries |
By Manufacturing Technology
| Extrusion Blow Moulding |
| Injection Stretch Blow Moulding |
| Injection Blow Moulding |
| Compression Blow Moulding |
| Other Manufacturing Technologies |
By Country
| China |
| India |
| Japan |
| South Korea |
| Australia |
| Indonesia |
| Thailand |
| Malaysia |
| Rest of Asia-Pacific |
| By Raw Material | Polyethylene Terephthalate (PET) | |
| High-Density Polyethylene (HDPE) | ||
| Polypropylene (PP) | ||
| Low-Density Polyethylene (LDPE) | ||
| Bio-based and Compostable Materials | ||
| By Packaging Type | Bottles | |
| Jars and Canisters | ||
| Jerrycans | ||
| Ampoules and Vials | ||
| Other Packaging Types | ||
| By End-user Industry | Beverages | Bottled Water |
| Carbonated Soft Drinks | ||
| Dairy and Functional Drinks | ||
| Alcoholic Beverages | ||
| Food | ||
| Pharmaceuticals | ||
| Cosmetics and Personal Care | ||
| Industrial Chemicals | ||
| Other End-user Industries | ||
| By Manufacturing Technology | Extrusion Blow Moulding | |
| Injection Stretch Blow Moulding | ||
| Injection Blow Moulding | ||
| Compression Blow Moulding | ||
| Other Manufacturing Technologies | ||
| By Country | China | |
| India | ||
| Japan | ||
| South Korea | ||
| Australia | ||
| Indonesia | ||
| Thailand | ||
| Malaysia | ||
| Rest of Asia-Pacific | ||


Key Questions Answered in the Report
How large is the Asia-Pacific plastic bottles and containers market in 2025?
The market is valued at USD 29.56 billion in 2025.
What is the projected CAGR for plastic bottle demand in Asia-Pacific through 2030?
The overall market is forecast to expand at a 4.52% CAGR between 2025 and 2030.
Which material leads consumption across Asia-Pacific packaging converters?
PET remains dominant with a 52.32% share in 2024, sustained by beverage demand and mature recycling streams.
Why is India the fastest-growing regional market?
Rising urbanization, a vibrant pharmaceutical export base, and new aseptic filling capacity push India’s growth to a 6.12% CAGR through 2030.
How are converters responding to regulatory recycled-content mandates?
They are investing in rPET capacity, signing long-term flake supply deals, and lightweighting existing bottle designs to reduce virgin resin use.
What technology trend most boosts manufacturing efficiency?
AI-enabled in-line defect detection cuts scrap by up to 30% and lowers energy consumption, improving both cost and sustainability performance.
Page last updated on:


