United States Container Glass Market Size and Share
Market Overview
| Study Period | 2020 - 2031 |
|---|---|
| Forecast Data Period | 2026 - 2031 |
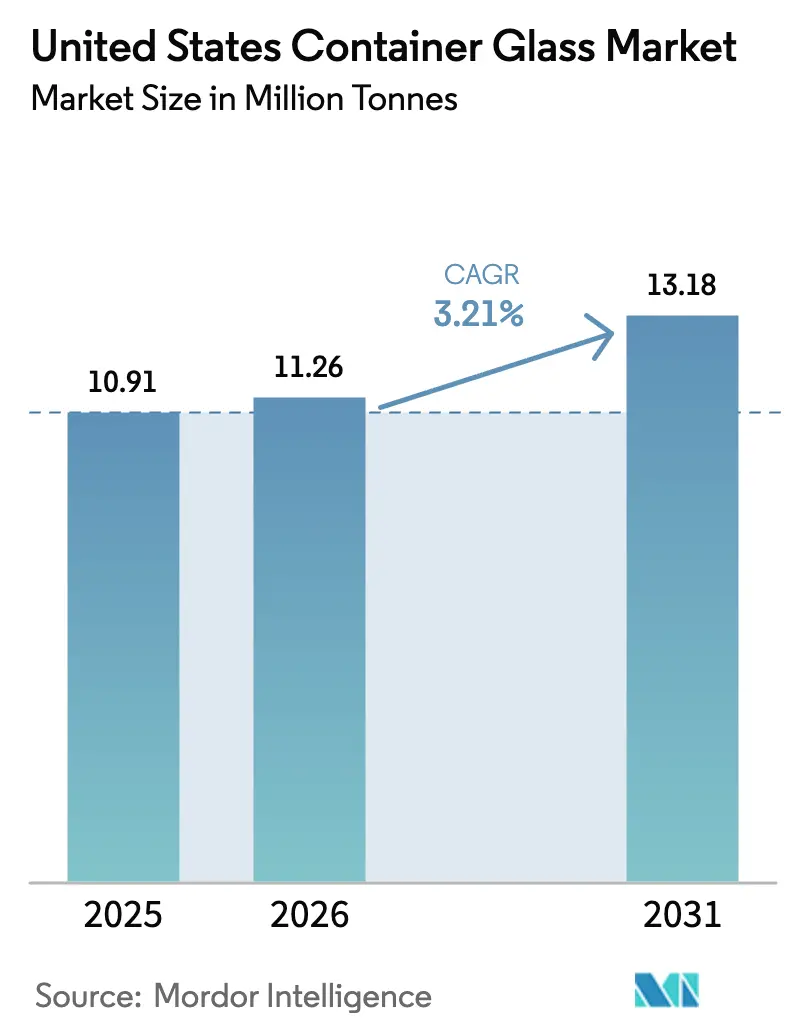
| Base Year Market Size (2025) | 10.91 Million tonnes |
| Market Volume (2026) | 11.26 Million tonnes |
| Market Volume (2031) | 13.18 Million tonnes |
| Growth Rate (2026 - 2031) | 3.21% CAGR |
| Market Concentration | Low |
Major Players *Disclaimer: Major Players sorted in no particular order Image © Mordor Intelligence. Reuse requires attribution under CC BY 4.0. | |
United States Container Glass Market Analysis by Mordor Intelligence
The United States Container Glass Market size was valued at 10.91 million tonnes in 2025 and estimated to grow from 11.26 million tonnes in 2026 to reach 13.18 million tonnes by 2031, at a CAGR of 3.21% during the forecast period (2026-2031). Maturation of legacy beverage demand, intensifying competition from lighter‐weight substitutes, and expanding corporate sustainability commitments shape a steady but disciplined growth trajectory. Supply-side consolidation, capacity lightweighting, and federal decarbonization grants reinforce operating resilience even as fixed-cost absorption comes under pressure. Premiumization in craft spirits, cold-brew coffee, kombucha, and functional beverages keeps the value mix favorable, while rising cullet utilization and recycled-content mandates bolster the circular appeal of glass packaging. Energy dependence on natural gas and freight volatility remain cost headwinds, but flexible MAGMA furnaces, lightweight 300-gram wine bottles, and biofuel pilots point to durable competitiveness gains.
Key Report Takeaways
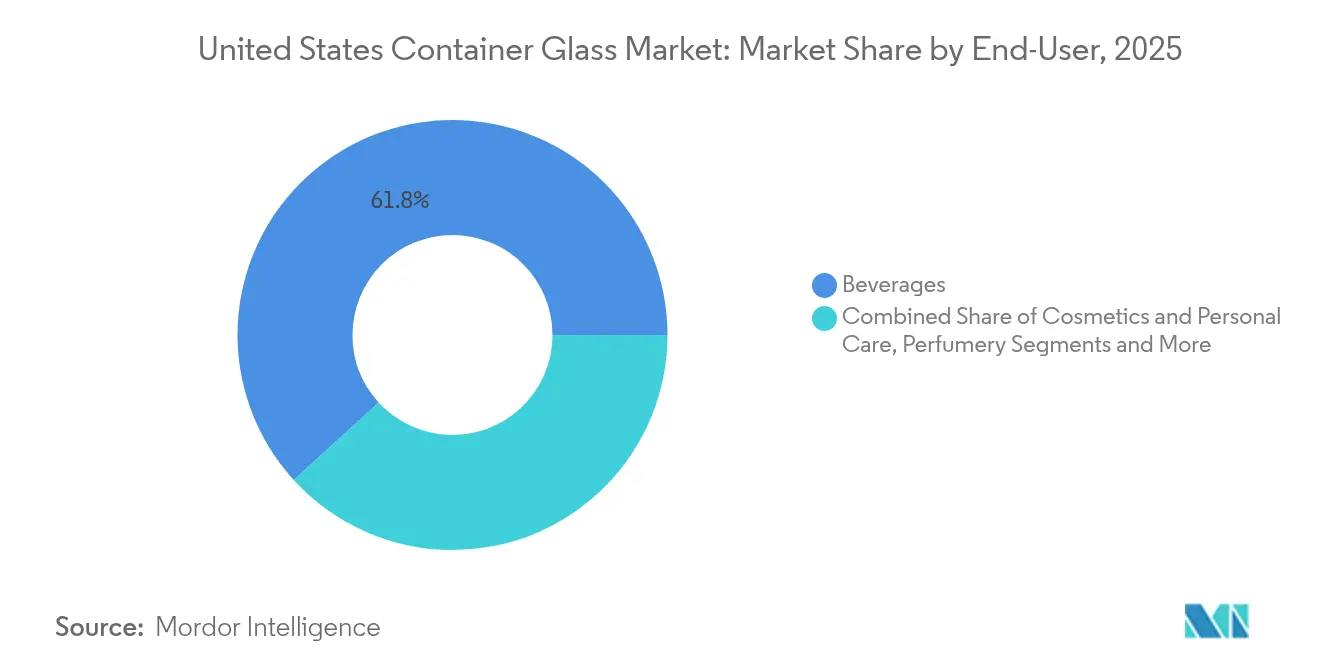
- By end-user, beverages captured 61.78 % of the United States container glass market share in 2025.
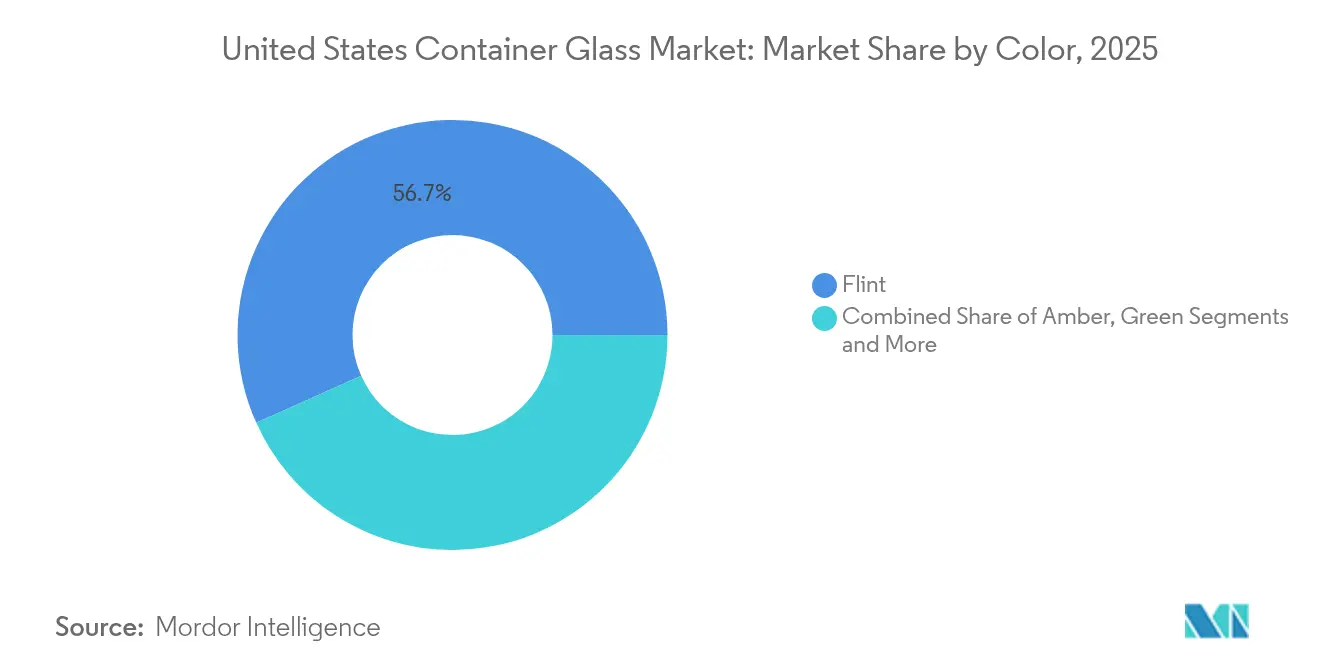
- By color, the United States container glass market for amber glass is projected to grow at a 4.30% CAGR between 2026-2031.
Note: Market size and forecast figures in this report are generated using Mordor Intelligence’s proprietary estimation framework, updated with the latest available data and insights as of 2026.
United States Container Glass Market Trends and Insights
Drivers Impact Analysis*
| Driver | (~) % Impact on CAGR Forecast | Geographic Relevance | Impact Timeline |
|---|---|---|---|
| Sustainable Packaging Trends | +0.8% | National; stronger adoption in California, New York, Oregon | Medium term (2-4 years) |
| Premiumization in Beverage and Food Packaging | +0.7% | National; dense in urban craft clusters | Short term (≤ 2 years) |
| Craft Beverage Boom | +0.6% | Pacific Northwest, Northeast, California | Medium term (2-4 years) |
| Innovation in Bottle Design and Shape | +0.4% | National; premium brands | Long term (≥ 4 years) |
| Recycling and Circular Economy Initiatives | +0.5% | Bottle-deposit states | Long term (≥ 4 years) |
| Smart Packaging Technologies | +0.2% | National; early premium adoption | Long term (≥ 4 years) |
| Source: Mordor Intelligence | |||
Sustainable Packaging Trends
Glass benefits from its infinitely recyclable nature, enabling brands to credibly meet scope 3 emissions targets while signaling premium environmental positioning to consumers; 92% of U.S. shoppers characterize glass as eco-friendly, compared with 41% for plastic. The Glass Packaging Institute and Boston Consulting Group have mapped a path to lift post-consumer glass recycling from 31% to 50% by 2030, which would eliminate emissions equivalent to removing 300,000 cars annually. Deposit-return states already achieve recovery rates above 60%, creating localized cullet pipelines that cut melting energy by roughly 3% for every 10-point jump in recycled content. Federal support accelerates the trend: the Department of Energy has committed USD 125 million to O-I decarbonization trials, including oxy-fuel combustion, hydrogen, and electric melting pilots.
Premiumization in Beverage and Food Packaging
Premium positioning elevates glass across spirits, ready-to-drink cocktails, and functional cafés where tactile heft and clarity communicate authenticity. Diageo’s 180-gram lightweight Johnnie Walker bottle proves premium cues can coexist with material reduction, trimming per-bottle carbon by roughly 90 grams CO₂. O-I’s Catalyst Collection uses neuroscience-led shapes and resealable closures to trade consumers up through emotional engagement. Premium cold-brew coffee, kombucha, and craft sodas adopt flint and specialty-tint formats to stand apart from mass-market PET, boosting value per ton even when volumes lag aluminum.[1]O-I Glass, “The Catalyst Collection,” glass-catalog.com Net result: the premium tier guards margins and counters share loss in value segments for the United States container glass market.
Craft Beverage Boom
America hosts more than 9,600 craft breweries, many clustered in Oregon, Washington, New York, and Pennsylvania, each demanding small-batch, differentiated glass SKUs. Ardagh now offers domestically produced 12-ounce emerald-green, amber, and flint bottles that craft brewers can interchange on filling lines without capital tweaks, minimizing downtime and inventory exposure. The craft spirits segment values glass’s inert barrier that protects vapor-phase congeners, preserving flavor fidelity central to premium storytelling. Regional wineries likewise cling to glass for oxidative and UV protection, sustaining demand even as cans nibble lower-price tiers. Aggregated, these micro-markets generate resilient, high-margin tonnage that bolsters the United States container glass market.
Innovation in Bottle Design and Shape
Flexible manufacturing drives bespoke shapes at commercial speed. O-I’s second-generation MAGMA line in Bowling Green switches molds on demand with smaller forehearths, enabling economical runs below 150,000 units. Ultra technology achieves up to 30% lightweighting without sacrificing strength, cutting transport costs while defending shelf appeal. Verallia’s 390-gram Estampe bottle leverages 82% recycled content to deliver a 25% lower carbon footprint versus legacy 500-gram wine formats. Additive glass printing prototypes, NFC tags for traceability, and AR-enabled label embossing further expand the innovation curve. Collectively, design agility and resource efficiency fortify the competitiveness of the United States container glass market.
Restraints Impact Analysis*
| Restraint | (~) % Impact on CAGR Forecast | Geographic Relevance | Impact Timeline |
|---|---|---|---|
| Competition from Plastic and Aluminum Packaging | -0.9% | National; value beverage tiers | Short term (≤ 2 years) |
| High Transportation Costs Due to Glass Weight | -0.6% | National; distance from furnaces | Medium term (2-4 years) |
| Energy-Intensive Manufacturing and Emissions | -0.4% | High-cost energy states | Long term (≥ 4 years) |
| Fragility and Breakage During Handling | -0.3% | National; high-volume channels | Medium term (2-4 years) |
| Source: Mordor Intelligence | |||
Competition from Plastic and Aluminum Packaging
PET bottles weigh 87% less than comparable glass, translating into shipping costs that run roughly one-third lower per case and nearly eliminate breakage returns. Aluminum’s resurgence in ready-to-drink cocktails further erodes unit volumes, aided by rapid-chill convenience and infinite curbside recyclability. Distillery 98’s move to 83-gram paper bottles underscores a fringe but disruptive frontier, claiming a six-fold carbon advantage over glass per manufacturer data. Regulatory compliance favors plastics: 49 CFR Part 178 imposes vibration, hydrostatic, and drop-test regimes on composite packagings with glass inners, adding certification spend unfamiliar to blow-molded containers. Unless glass producers narrow cost gaps via lightweighting and cullet adoption, share erosion in mass channels could temper the growth of the United States container glass market.
High Transportation Costs Due to Glass Weight
Sea-and-road freight price spikes magnify glass’s mass penalty. UNCTAD data show spot rates from China to the U.S. East Coast doubling to USD 9,945 per forty-foot unit in mid-2024, a squeeze passed through disproportionately to heavier payloads such as pallets of glass bottles. Red Sea diversions lengthened voyage legs by 12%, spurring bunker consumption threefold at elevated speeds. Domestically, moving filled glass from Midwest furnaces to West Coast craft wineries incurs fuel surcharges that can exceed 15% of delivered cost, while PET travels in lightweight rolls at a fraction of the price. Although lightweight 300-gram wine bottles ease the burden, transport economics remain a structural restraint on the United States container glass market.
*Our forecasts treat driver/restraint impacts as directional, not additive. The impact forecasts reflect baseline growth, mix effects, and variable interactions.
Segment Analysis
By End-User: Beverages Drive Volume Growth
Beverages contributed 61.78% of the United States container glass market share in 2025, equal to 6.74 thousand kilotons of throughput, and are forecast to climb at a 3.02% CAGR through 2031. Spirits dominate the value mix with tall, thick-base flint bottles that codify premium cues, shielding the segment from PET encroachment. Beer volume has plateaued, yet double-digit craft expansions sustain niche glass SKUs such as stubby heritage formats and 750-milliliter bombers. Wine absorbs 750-milliliter and magnum bottles with regional color preferences, Bordeaux green in Napa, flint in Oregon Pinot, while aluminum cans nibble share in entry-price rosé. Non-alcoholic craft sodas, cold-brew coffee, and kombucha outpace total beverage growth, using glass to convey artisanal authenticity, preserve carbonation, and satisfy clean-label shoppers.
Cosmetics and personal care constitute the fastest-growing application, expanding at a 4.45% CAGR toward 2031 on the back of prestige skincare, fragrance, and refill-ready formats. Airless glass jars curb oxidation in vitamin-C serums, and mascara tubes integrate 40% recycled content without color compromises. Food, jam, and sauces remain steady staples, with gourmet condiments trading up to French-square jars featuring embossed branding.


By Color: Flint Dominance with Amber Growth
Flint glass retained 56.70% of the United States container glass market size in 2025, owing to its clarity, design neutrality, and broad adoption across spirits, sauces, and specialty beverages. Visibility of liquid color enhances shelf differentiation for cold-brew coffee, which often layers nitrogen cascades in clear bottles to theatrical effect. The emphasis on Instagram-ready visuals further cements Flint’s role in premium non-alcoholic drinks.
Amber glass is poised for the fastest uptake at 4.30% CAGR thanks to its UV-blocking advantage that safeguards light-sensitive biologics and hop oils. Expansion of biologic injectables and vitamin-enriched beverages stretches Amber’s footprint into pharmaceuticals and functional drinks.
Green glass concentrates in wine bottle clusters, where tradition and regional identity trump functional considerations; Oregon’s BottleDrop program supports closed-loop green cullet flows, lifting recycled content above 70%. Specialty cobalt blues and matte blacks inhabit limited-edition spirits and craft soda runs, capturing premium price real estate, although representing under 3% of total tonnage.
Geography Analysis
Furnace corridors in Ohio anchor the United States container glass market-Pennsylvania, the Gulf Coast, and the Southeast, co-located with natural-gas grids and silica deposits that lower batch costs. O-I’s Bowling Green, Kentucky MAGMA plant exemplifies the pivot toward agile, regionally distributed capacity optimized for sub-500-ton daily pulls. Western wineries rely heavily on import flows and West Coast furnaces, but logistical shocks in 2024 underscored the resilience of domestic supply.
Bottle-bill states like California, Oregon, and New York report recycling rates above 60%, underpinning stable cullet pipelines that reduce batch costs per ton by USD 6-8 and cutting furnace CO₂ emissions 5% per 10-point cullet gain. Midwest recycling lags below 20% owing to single-stream MRF contamination, constraining cullet availability and perpetuating virgin batch mining in Illinois and Indiana. Energy pricing differentials further shape competitiveness: Gulf Coast furnaces capitalize on sub-USD 3.00 per MMBtu Henry Hub natural-gas contracts, whereas New England pays 1.8× premiums, driving inbound shipment from lower-cost regions.
Federal decarbonization funding channeled USD 125 million to O-I’s Ohio and Texas retrofits, adding oxy-fuel boosters and furnace electrification pilots that could slash emissions 25% by 2027. Port congestion in Los Angeles-Long Beach during 2024 manifested in container dwell fees, incentivizing West Coast beverage brands to onshore bottle sourcing rather than import heavier flint bottles from Asia.
Competitive Landscape
The United States container glass market is moderately concentrated: O-I Glass, Ardagh Group, and Verallia collectively hold about a 65% share, while a long tail of regional furnaces and specialty converters fills niche volumes[3]ARD Finance S.A., “Interim Report Q2 2024,” ardholdings-sa.com . O-I’s “Fit to Win” restructuring targets USD 650 million in savings by 2027 and includes furnace rebuilds, MAGMA rollouts, and a 100% biofuel pilot in Harlow that achieved 88% cullet charge in March 2025. Ardagh shuttered Houston and indefinitely curtailed Seattle in 2024, redeploying production to higher-efficiency furnaces even as it introduced a 300-gram lightweight wine line in July 2025.
Verallia’s European electric furnace insights may transfer to U.S. sites, positioning the firm for leadership in electrification know-how. Strategic focus has shifted from sheer capacity toward flexibility, circularity, and digital engagement. Diageo partnered with SharpEnd to embed NFC chips in Johnnie Walker bottles, enabling provenance verification and dynamic content, thereby elevating glass from container to connected touchpoint.
O-I and Revino are piloting a rinse-and-reuse wine bottle loop in the Pacific Northwest that can extend bottle life eight cycles, improving cost parity with aluminum while reducing CO₂ by 80 grams per rotation. Barriers to entry remain formidable: DOT certification for hazardous inner glass packaging and capital-intensive furnaces create supply-side discipline that tempers price wars even as margins narrow.
United States Container Glass Industry Leaders
O-I Glass, Inc
Ardagh Group S.A.
Verallia S.A.
Gerresheimer AG
Stoelzle Glass USA Inc.
- *Disclaimer: Major Players sorted in no particular order

Recent Industry Developments
- March 2025: O-I completed a 100% biofuel furnace trial at Harlow, U.K., running 88% cullet charge and oxy-fuel burners.
- February 2025: O-I reported FY 2024 results, highlighting restructuring progress under Fit to Win and confirmed a USD 650 million cumulative savings target.
- January 2025: Gerresheimer closed the Bormioli Pharma acquisition, adding Gx Cap digital adherence packaging to its U.S. lineup.
- December 2024: Ardagh published a global decarbonization roadmap pledging science-based targets across its North American glass network.


United States Container Glass Market Report Scope
Glass bottles and containers offer an effective solution for preserving consumables, ensuring their safety, freshness, and quality over extended periods while facilitating transportation. These packaging solutions are designed to protect contents from external factors such as light, air, and moisture, which can degrade product quality. The alcoholic and non-alcoholic beverage industries primarily utilize glass bottles and containers due to their chemical inertness, sterility, and non-permeability. These properties make glass ideal for maintaining beverages' flavor, aroma, and overall integrity.
Additionally, glass packaging is recyclable and environmentally friendly, aligning with growing consumer preferences for sustainable products. This market analysis encompasses vital end-user industries, including beverages, food, pharmaceuticals, and cosmetics. Each of these sectors has specific requirements for packaging, and glass containers are tailored to meet these diverse needs, from preserving food products to ensuring the stability of pharmaceutical formulations and protecting the quality of cosmetic items.
The United States container glass market is segmented by end-user vertical (beverages [alcoholic beverages (beer, wine, spirits, and other alcoholic beverages {cider and other fermented drinks}), non-alcoholic beverages (juices, carbonated drinks (CSDs), dairy product-based drinks, other non-alcoholic beverages)], food [jam, jelly, marmalades, honey, sausages and condiments, oil, pickles], cosmetics and personal care, pharmaceuticals (excluding vials and ampoules), and perfumery), by color (green, amber, flint and other colors). The report offers market forecasts and size in volume (kilotons) for all the above segments.
| Beverages | Alcoholic | Beer |
| Wine | ||
| Spirits | ||
| Other Alcoholic Beverages (Cider and Other Fermented Drinks) | ||
| Non-Alcoholic | Juices | |
| Carbonated Drinks (CSDs) | ||
| Dairy Product Based Drinks | ||
| Other Non-Alcoholic Beverages | ||
| Food (Jam, Jelly, Marmalades, Honey, Sausages and Condiments, Oil, Pickles) | ||
| Cosmetics and Personal Care | ||
| Pharmaceuticals (excluding Vials and Ampoules) | ||
| Perfumery | ||
| Green |
| Amber |
| Flint |
| Other Colors |
| By End-user | Beverages | Alcoholic | Beer |
| Wine | |||
| Spirits | |||
| Other Alcoholic Beverages (Cider and Other Fermented Drinks) | |||
| Non-Alcoholic | Juices | ||
| Carbonated Drinks (CSDs) | |||
| Dairy Product Based Drinks | |||
| Other Non-Alcoholic Beverages | |||
| Food (Jam, Jelly, Marmalades, Honey, Sausages and Condiments, Oil, Pickles) | |||
| Cosmetics and Personal Care | |||
| Pharmaceuticals (excluding Vials and Ampoules) | |||
| Perfumery | |||
| By Color | Green | ||
| Amber | |||
| Flint | |||
| Other Colors | |||


Key Questions Answered in the Report
What CAGR is projected for U.S. container glass demand through 2031?
The United States container glass market is forecast to grow at 3.21% CAGR between 2026 and 2031, reaching 13.18 million tonnes by the end of the period.
Which application currently drives the highest glass tonnage in the country?
Beverage packaging leads with 61.78% share and continues to anchor volume growth, especially in craft spirits, beer, and premium non-alcoholic drinks.
Why is amber glass gaining faster than other colors?
Amber bottles provide UV protection critical for biologics, pharmaceuticals, and hop-rich craft beers, supporting a 4.30% CAGR through 2031.
How are glass makers addressing high energy intensity?
Producers are trialing oxy-fuel combustion, lightweight designs, higher cullet loads, and even 100% biofuel furnaces to cut costs and emissions.
Which states post the highest glass recycling rates?
Oregon, California, and New York exceed 60% recovery thanks to deposit-return laws, creating robust cullet supply chains that lower batch costs.
Page last updated on:


